www.elsevier.com / locate / bres
Research report
Organization of efferent neurons in area 19: the projection to
extrastriate area 21a
a c a,b ,
*
Tara H. Stewart , Jamie D. Boyd , Joanne A. Matsubara
a
Department of Ophthalmology, University of British Columbia, 2550 Willow Street, Vancouver, British Columbia, Canada V5Z 3N9
b
Department of Anatomy, University of British Columbia, 2550 Willow Street, Vancouver, British Columbia, Canada V5Z 3N9
c
Department of Biological Science, Simon Fraser University, 888 University Way, Burnaby, British Columbia, Canada V5A 1S6 Accepted 25 July 2000
Abstract
The organization of efferent neurons in area 19 of the cat was examined by bulk injections of retrograde tracers, WGA–HRP and CTX–Au, into extrastriate area 21a. In one case, the cortex was cut coronally and retrogradely labeled cells in area 19 were present in columnar register throughout layers 2 to 6, with the majority of labeled cells in layers 2 / 3. The number of columns per tissue section ranged from 0 to 4 and had a centre-to-centre spacing ranging from 0.6 to 0.9 mm. A few lightly labeled cells were found between the columns. In six other cases, the visual cortex was flattened, and cut in the tangential plane to reveal a pattern of irregular, widely spaced bands that were elongated in the mediolateral direction with a mean centre-to-centre spacing of 2.6 mm. The density of labeled cells within these bands fluctuated such that dense aggregates of cells were found, on average, at 0.9 mm intervals along the bands. This tangential heterogeneity in density, along with the patchy columnar staining witnessed in the coronal plane, suggests that the widely spaced efferent projection bands may have a patchy substructure with a spacing of approximately 1 mm. The pattern of efferent projection bands and its substructure in area 19 is reminiscent of the stripe-like organization of V2 found in primates. 2000 Elsevier Science B.V. All rights reserved.
Theme: Sensory systems
Topic: Visual cortex: extrastriate
Keywords: Visual cortex; Parallel processing; Cytochrome oxidase; Cortical module
1. Introduction and irregularly spaced stripes running in the mediolateral direction [3]. Projections from area 19 to extrastriate area Patchy networks are a common feature of cat primary 21a have also been reported to be patchy in the coronal visual cortex. The intrinsic [19,20,28], callosal [3,39,56] plane [13,43,49]. However, the exact nature of these and corticocortical connections [6,8,32] are all examples of patches, and their periodicity, has not yet been examined in patchy networks in cat area 17. More recently, a patchy the tangential plane, which is the preferred plane of section system of cytochrome oxidase (CO) blobs was identified in for studying variations in labeling density across an entire cat area 17 [5,15,34]. Cortical areas beyond primary visual area.
cortex also demonstrate patchy architecture, for instance Of interest in this study is whether the pathway from area 19 of the cat forms reciprocal and often patchy area 19 to area 21a demonstrates a patterned organization. connections with as many as 13 other visual areas [49]. This type of organization is a common feature of parallel Area 19 also receives patchy thalamocortical innervation processing streams in the cat and may bear a relationship [25] and the callosal innervation is patchy with elongated with the functional specialization of area 21a [38]. Segre-gation of inputs to area 21a have already been found in the primary visual cortex where efferents to area 21a originate
*Corresponding author. Eye Care Centre, 2550 Willow Street,
Van-in the patchy CO blob columns of the primary visual
couver, British Columbia, Canada V5Z 3N9. Tel.:11-604-875-4383; fax:
cortex [8]. Area 21a also demonstrates several
physiologi-11-604-875-4663.
E-mail address: [email protected] (J.A. Matsubara). cal features that suggest it is functionally specialized. For
instance, most neurons in area 21a exhibit high spatial mg / kg, Austin Laboratories) were given to the animals to frequency selectivity and are orientation, but not motion, reduce brain edema.
selective [14,31,53]. This study addresses area 21a inputs
arising from area 19, as area 19 is a pivotal visual area 2.2. Histology with connections to over 11 extrastriate visual areas
[4,18,49], suggesting that it plays a role in several process- The animals were given an overdose of barbiturate
ing streams in the cat visual system. anesthetic three days after surgery. They were then
per-In this study we made large injections of a retrograde fused transcardially with 700 ml of phosphate buffer (0.1 tracer to saturate area 21a, as identified stereotaxically. The M, pH 7.2) with 0.5% sodium nitrite. In six cases, a organization of the efferent projection to area 21a was solution of 2% paraformaldehyde in phosphate buffer was examined in both the tangential and coronal planes. delivered with a perfusion pump at a rate of 60 ml / min for Retrograde labeling in area 19 revealed a complex pattern 4 min. The visual cortex was then unfolded and flattened of bands in area 19, elongated in the mediolateral direc- tangentially as described by Olavarria and Van Sluyters tion. Within these bands, clusters of dense staining was [36]. The visual hemispheres were left between two glass found, which suggests a substructure to the overall banded slides submersed in 4% paraformaldehyde and 20%
suc-pattern. rose in phosphate buffer. After 5 h, the glass slides were
removed and the sections were allowed to free float for 8 h. The tissue was then cut tangentially at 50 mm on a 2. Materials and methods microtome. In one case (with WGA–HRP injected), 4% paraformaldehyde was used in the perfusion and
after-2.1. Animals and surgical procedure wards the visual cortex was cryoprotected and 50 mm
coronal sections were cut on a microtome.
Seven normal adult cats of both sexes were used. Five of Alternate tangential sections were stained for CO using the animals received injections of cholera toxin subunit B a cobalt and nickel enhancement method [9,15,26]. The conjugated to 7 nm colloidal gold (CTX–Au; List Bio- CO staining solution contained 20 mg diaminobenzidine, logical; 1% in 0.9% sterile saline). Two animals were 30 mg cytochrome C, 15 mg catalase and 2 g sucrose in 50 injected with wheat germ agglutinin–horseradish peroxi- ml 0.01 M phosphate buffer (pH 7.2) to which 5 ml of 1% dase (WGA–HRP; Sigma; 1% solution in 0.9% saline). nickel ammonium sulphate was added. One percent cobalt The animals were pre-anesthetized with a subcutaneous chloride was then added dropwise until the solution injection of glycopyrilate (0.05 mg / kg, Associated Vet- became cloudy. The tissue sections were incubated in the erinary Purchasing, Co. Ltd.), followed by an intramuscu- solution for 4–6 h.
lar injection of ketamine (20 mg / kg, Associated Veterinary The remaining tissue sections from these six cases were Purchasing, Co. Ltd.) and diazepam (2 mg / kg, Sabex Inc.). stained for retrograde labeling. For five cases, CTX–Au Animals were also given an intramuscular injection of was visualized by silver intensification. This was done by dexamethasone (0.5 mg / kg, Austin Laboratories) to pre- incubating the sections for 1–2 h in a silver enhancement vent brain edema. During surgery anesthesia was main- solution (Jannsen IntenSEM). The remaining tangential tained by inhalation of trifluourethane (halothane, M.T.C. case plus the one coronal case were reacted for WGA– Pharmaceuticals). Under sterile surgical conditions an HRP using the standard tetramethylbenzidine (TMB) incision was made along the midline of the head and a method [30]. This was followed by a stabilization in
long-lasting local anesthetic, 0.25% bupivacaine hydro- chilled ammonium heptamolybdate and cobalt–
chloride (Marcaine, Winthrop Laboratories), was injected diaminobenzidine [22]. Half of the coronal sections were into the incision. A craniotomy and duratomy were per- then processed for SMI-32 immunoreactivity using a formed at stereotaxic co-ordinates AP 27 to 12 and ML monoclonal antibody (Sternberger Monoclonals Inc.).
17 to 115 mm to reveal area 21a. SMI-32 immunoreactivity helped identify laminar
Tracer injections were made just medial to the genu boundaries seen in Fig. 2. along the posterior portion of the suprasylvian gyrus. Long
micropipettes, with tapered ends that had inner diameters 2.3. Data analysis of 16–20 mm, were used for injections. The pipettes were
dis-played. The cross sections of blood vessels were used as assessed by several means. Sulcal patterns were used to landmarks to align multiple sections. Figs. 4–6 consists of establish the border between areas 19 and 21a [21,54,55] data from multiple tissue sections that were collapsed onto and alternate tissue sections stained for CO were used to
a single plane. identify the border between areas 18 and 19, as CO
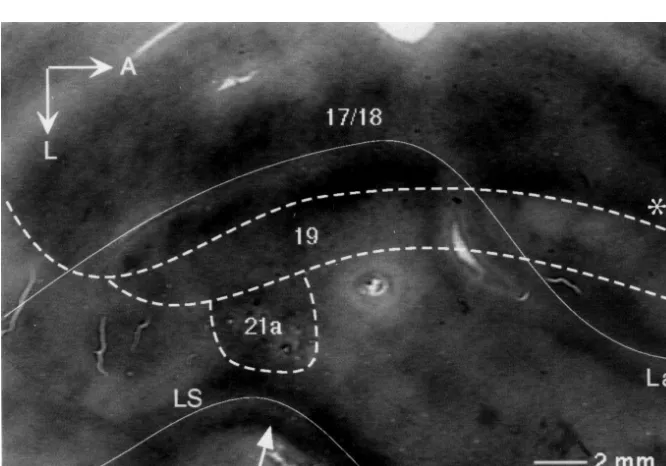
For every image, the position of each charted cell was staining in area 19 is lighter than that observed for areas 17 overlaid with a 2D Gaussian kernel with a radius of 0.25 and 18 (Fig. 1) [3]. The area 18 / 19 border established the mm. From the resulting image, transects were drawn location of area 19. Area 21a was identified by the fact it across the bands and labeling density of the bands was adjoins area 19 at the posterior crown of the suprasylvian calculated (Fig. 5). The peaks in the profile plots, gener- gyrus (Fig. 1) [55]. As corresponding visuotopic areas are ated from the transects perpendicular to the bands, were commonly connected [13,44], injections of retrograde measured to give an estimate of band periodicity (Fig. 5). tracer in area 21a, which has a representation limited to the The periodicity measurements were then averaged for an central 208of visual field [55], would be expected to label overall mean periodicity. For every band, five transects regions of central representation in other areas. Cell were also taken to measure band width (Fig. 6). Given labeling from 21a injections was confined to the region of some variability in band shape, the five measurements per central representation in areas 17 and 18. Also, within area band (which were averaged for each band) were deemed 19 labeling was found in the region of central representa-necessary to give a true estimate. The mean values for each tion, which is located in the posterior half of this area [54]. band was then averaged for an overall estimate of band Furthermore, an extension of the 21a injection into the width. Transects were also taken along the mediolateral neighboring lateral suprasylvian (LS) area would result in axis of the bands to measure changes in labeling density labeling of the peripheral representation in other areas, (Fig. 6). Measurements were not adjusted to take into since the LS region adjacent to 21a contains peripheral account shrinkage of tissue during fixation and processing representation [33,37,55]. However, there is no label found and are thus minimal estimates of width and periodicity of in the peripheral representation regions of areas 17, 18 and
the bands. 19, further confirming the injection was restricted to area
21a.
3. Results 3.2. Coronal organization
3.1. Injection placement From the coronal experiment, it is evident that the
neurons in area 19 that project to area 21a are located in Correct placement of injections into area 21a was columnar register (Fig. 2; large arrows) extending through
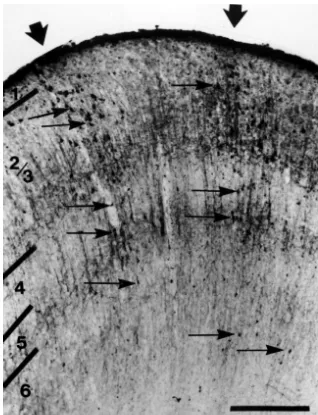
Fig. 2. A photograph of a coronal slice with retrogradely labeled cells in area 19 following an injection of WGA–HRP in area 21a. This section has been immunohistologically counterstained with SMI-32, which labels the nonphosphorylated forms of neurofilament protein. SMI-32 immunoreactivity labels somata and apical dendrites [2] and appears lighter than the dense TMB reaction product of WGA–HRP labeled cells. The WGA–HRP labeled cells in area 19 are organized in patchy columns, two of which are shown by the large arrows above the pial surface. The small arrows indicate examples of individual WGA–HRP labeled cells. While layers 2 / 3 contain the most labeled cells, layers 4 and 5 demonstrate modest labeling and layer 6 has very few labeled cells. Layer 1 does not contain any labeled cells. Scale bar5500mm.
layers 2 to 6 (Fig. 2; small arrows). The number of patches from area 19 to area 21a is organized into discrete, of labeled cells per tissue section range from 0 to 4 and irregular bands. In most cases, these bands are elongated have a centre-to-centre spacing ranging from 0.6 to 0.9 roughly in the mediolateral direction (Figs. 3, 4), but there mm. The majority of labeled cells within the columns are is some variation in the mediolateral orientation of the found in layers 2 / 3. Layer 4 and 5 contain moderate bands (Fig. 5A). The bands are found in the posterior half amounts of labeling while labeling in layer 6 is scarce. In of area 19 and range in number from 2 to 6 (Table 1). some sections, a sparse number of lightly labeled cells are Variation in band number may be due to differences in the found outside the columns in layers 2 / 3 and 5. size of the effective injection site in area 21a. It may also be a result of the complexity of some of the bands which form bridges (arrows in Fig. 6A). The bridges between the
3.3. Tangential organization bands may actually represent a separate patchy system
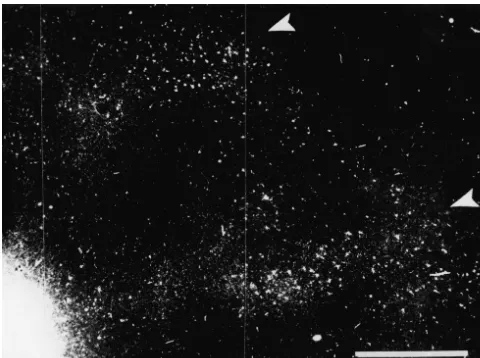
Fig. 3. A dark-field photograph of area 19 of WGA–HRP labeled cells after an injection into area 21a. The two elongated 21a efferent bands in area 19 are marked by white arrowheads. Scale bar50.5 mm.
the presence of labeling between regions of high density, creates a visibly discrete band.
3.4. Periodicity of tangential bands
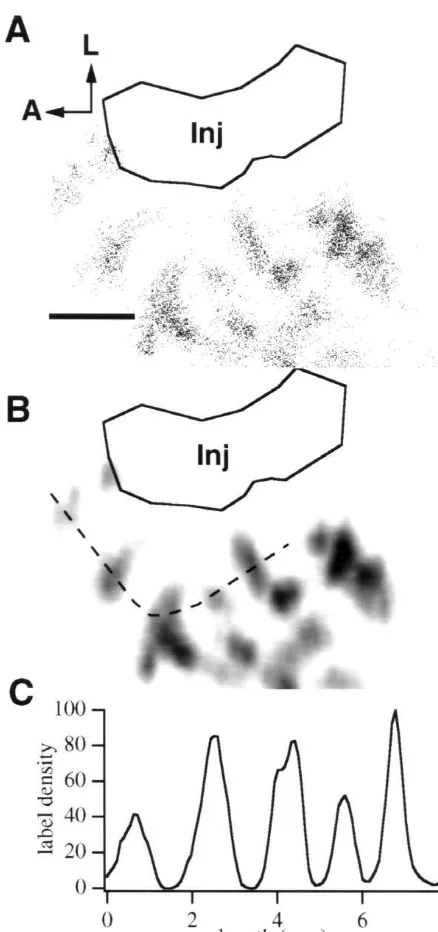
A measurement of the distance between density peaks, which was determined by density profiles taken from line transects, was used to calculate the mean periodicity (Fig. 5C). The mean periodicity of the area 19 tangential bands is 2.6 mm. The S.E. is relatively high at 0.24, indicating that considerable variation exists. Despite this irregularity in spacing, in no case do the separate bands merge to create uniform labeling across area 19. Area 19 clearly demonstrates fluctuations in labeling density in which areas of high density are separated by areas of diminutive density.
Fig. 4. A chart of labeled cells following an injection of CTX–Au in area 3.5. Width and mediolateral density of tangential bands 21a. Largely spaced bands of label are visible in area 19 whose borders
are shown by dashed lines. A thin solid line marks a tear in the tissue.
The width and mediolateral density of the bands are also
Note the clusters of labeled cells just medial to the area 18 / 19 border. A,
Table 1
The breakdown of measurements from separate cases of area 19 efferent
a
bands
Animal No. of No. of Mean Mean width Fig. number charted bands periodicity (mm) no.
The first column contains the tracking number of each animal. The second column represents the number of alternate sections that were stained for retrograde labeling and charted to create a single graphical image used for the analysis. The number of area 19 efferent bands found in each animal varies between two and six, as can be seen from column three. The next two columns represent the mean periodicity and width values for the bands found in each case. The figure number corresponding to each individual case is found in the last column.
after multiple sections are charted, aligned and collapsed onto one plane it is evident that there are patches of increased staining within the band, occurring on average at 0.9 mm intervals. This patchiness is visible in individual sections and may be related to the columns of cell clusters in the coronal plane (Fig. 2). However, clusters of dense areas within the bands are not segregated into individual units, as seen in many of coronal cases. Rather, within the bands there appears to be a low level of continuous labeling. This suggest the possibility of a periodic sub-band structure.
The density of the band along the width or anterior / posterior axis is very consistent. Fig. 6D shows typical transects through the width of the band. The relatively normal distribution of density along this axis is found in all animals. This consistency suggests that there is no sub-structure or clustering in the anteroposterior direction. The only changes in cell labeling density that is encountered in this direction is the area 19 bands which are distinct from each other.
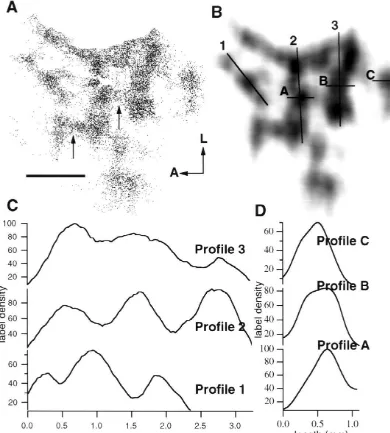
Fig. 5. An example of a cell chart used to measure periodicity of the area 19 efferent bands. (A) A cell chart confined to labeled cells in area 19 after an injection of CTX–Au in 21a. The clusters of labeled cells are approximately perpendicular to the area 18 / 19 border and are elongated
3.6. Tangential organization of area 18
along the mediolateral axis. Variation in the orientation of the bands is common between animals. (B) The same cell chart overlaid with a 2D
In the process of examining area 19 it was noticed that
Gaussian kernel. A transect (dashed line) has been taken through five
bands. (C) The periodicity of the bands was measured by measuring the area 18 also consistently demonstrated clusters of labeled distance between peaks in the transect. A, anterior; L, lateral. Scale neurons on the medial side of the posterior half of the area bar52 mm.
18 / 19 border. These clusters of cells are evident in all tangential cases. As seen in Fig. 4 these clusters are elongated mediolaterally and have an approximate spacing periodicity. Examples of the profile plots used to measure of 0.9 mm. The spacing of these area 18 clusters is similar the mediolateral density and width of each band are shown to the spacing of patches of labeling in area 17 (0.6–0.9 in Fig. 6C and D. The average band width is 0.9 mm mm) that appear after a retrograde tracer injection in area
(S.E.50.03). 21a. These patches of label in area 17 are known to
Fig. 6. An example of cell charts used to measure mediolateral density and width of the area 19 efferent bands. (A) A cell chart of the retrograde labeling in area 19 after injections in area 21a. Notice the branching of some of the bands (small arrows). (B) The same cell chart overlaid with a 2D Gaussian kernel. Three transects along the mediolateral axis of a band are illustrated (1, 2 and 3). Three transects along the width of the bands are illustrated (A, B and C). (C) The profile plots generated by transects 1, 2 and 3 in Fig. 6B. Note the uneven density along the transect. This was a common feature found in all cases. (D) The profile plots generated by transects A, B and C in Fig. 6B. The density of labeled cells along the transect peaks in a smooth Gaussian fashion. The consistency of density along the anterior posterior axis was found in all cases. A, anterior; L, lateral. Scale bar52 mm.
4. Discussion projecting bands roughly interdigitate with 21a projecting bands [47].
4.1. Tangential organization The 21a projecting band pattern in area 19 is more
complex than the patchy organization of efferent and
Efferent neurons in area 19 that project to area 21a are callosal neurons found in areas 17 and 18
tracer [8], indicating that the large aggregate injections [13] reports similar patches in layers 2 / 3, while our study used in this study are uniform and thus differences in found them through all layers except for layer 1. It is labeling density in area 19 are the result organizational possible that Dreher et al. missed labeling in layers 4 to 6 pattern of 21a inputs and not uneven distribution of tracer since labeled cells in these layers are more difficult to
at the injection site. detect as they are sparser than labeled cells in layers 2 / 3.
Another potential reason for the irregular structure of the Symonds and Rosenquist [50] also found patchy 21a bands may be retinotopy. This also seems unlikely as both efferent neurons in area 19 but they report heavier labeling 18 and 19 have similar retinotopy and magnification in layers 5 and 6. In the present study, the majority of factors [54], yet they demonstrate very different ana- labeled cells are found in layers 2 / 3 and 5 with less tomical structures (i.e. patches versus bands). The com- labeling in layers 4 and 6. Difference in findings could be plexity of the bands may be linked to the thalamocortical due to the use of different tracers; Symonds and Rosen-connections in area 19. Area 19 receives an input primarily quist use HRP and 3H-leucine while WGA–HRP is used from the W-cells of the LGN while areas 17 and 18 receive for the coronal case in this study. These tracers rely upon thalamocortical input from X-, Y- and W-cells [12,48]. different uptake and transport mechanisms [57] and thus Variations in the type (i.e. X, Y and / or W) of input may have resulted in variations in labeling. This difference between these areas may contribute to the differences in in laminar labeling may also be related to the smaller efferent organization. Furthermore, W- and Y-cell thalamic volume of tracer used by Symonds and Rosenquist com-inputs terminate in the CO blob columns in area 17 [5]. pared to this study.
Since CO blob columns also contain 21a efferent neurons The relative hierarchy of cortical areas can be de-it would be worthwhile to determine if area 19 also termined by the laminar location of efferent cells and / or receives direct W-cell thalamic input which is restricted to their axon terminals. For example, efferent cells found the efferent bands. Projections to area 19 from the C-layers primarily in the supragranular layers are indicative of an of the LGN terminate in patches in layers III and IV along ascending (feed-forward) pathway. In other words, the the coronal plane [25] and intraocular injections of WGA– receiving area is considered to be at a higher processing HRP result in patchy tangential label in area 19 with an level than the area containing the cells of origin. On the approximate spacing of 2.5 mm [1]. Therefore, it may be other hand, efferent cells located in the infragranular layers that termination sites of the LGN afferents are part of the are suggestive of a descending (feedback) pathway, with substructure of the area 19 efferent bands projecting to the area receiving the axon terminals being classed as a
area 21a. lower processing area than the area containing the efferent
Extrastriate regions in the cat can contain more complex cell bodies [16,40,51]. The hierarchy of an area, with a retinotopic maps, larger spacing of connections and more bilaminar distribution of efferent cells found in both variable patterns of label than the primary visual cortex supragranular and infragranular layers, is equivocal unless [43,45,54]. This increased variation in organization is the laminar distribution of the efferent cell terminals is also probably established during maturation of the extrastriate known in the areas they are projecting to [16]. In this areas. Corticocortical connections are frequently estab- study, retrogradely labeled efferent cells in area 19 are lished after eye opening, making the organization of these found in all layers, except layer 1, yet they are most projections more susceptible to individual visual ex- apparent in layers 2 / 3 and 5. This bilaminar-like dis-perience [7,10,29]. Also during development, activity may tribution makes it difficult to assign a hierarchical status to play a role in determining modular size and organization area 19 or area 21a, as the afferent distribution in area 21a [23,42] and this activity in extrastriate areas may differ is not examined. However, the area 19 to 21a projection is from primary visual cortex for two reasons. First, extras- classed as ascending by Felleman and Van Essen [16] who triate areas are more vulnerable to changes in organization based their findings on laminar data from Symonds and since input in these higher areas is altered by previous Rosenquist’s work [49,50]. Scanell et al. [41] collates visual processing in other visual areas. Secondly, the connectional data from numerous studies and also categor-correlation between incoming inputs decreases in extras- izes this projection as ascending based upon multiple triate regions [24]. Therefore, the increased variation and quantitative criteria.
complexity witnessed in the area 19 efferent bands may be Based upon the tangential findings it was expected that the result of an organization based upon individual ex- there would be coronal columns of densely labeled cells, perience and the type of input and processing occurring in which would represent the dense patches of label within
this area. the tangential bands, and in between the coronal columns
there would be sparser labeling, which would represent the
4.2. Coronal organization lighter labeled regions of the tangential bands. However,
stabili-zation procedure, some of the lighter stained cells may 1. Further studies examining the functional significance of have missed detection by fading as a consequence of these bands are necessary to establish what relationship, if dehydration or time (the tissue was processed several years any, the efferent bands in area 19 have with parallel prior to the present analysis). Another potential reason that processing streams in the cat.
labeled cells are not detected between the coronal columns is that the coronal plane is not the optimal plane for
detecting subtle patterns in labeling density in the tangen- Acknowledgements tial direction [5,45] and therefore, the area 19 band pattern,
seen in the tangential plane, may be underestimated in the We thank Virginia Booth and Eleanor To for surgical coronal plane. Nevertheless, there are a few coronal and technical assistance. We would also like to thank sections with faintly labeled cells between the cell columns Sarven Sabunciyan and Dawn Lam for their helpful as well as sections which do not have labeling and comments. This study was supported by MRC (Canada). probably correspond to the unlabeled regions between the
tangential bands.
References 4.3. Primate comparison
[1] P.A. Anderson, J. Olavarria, R.C. Van Sluyters, The overall pattern
Like the cat, extrastriate organization in the primate is of ocular dominance bands in cat visual cortex, J. Neurosci. 8 more complex than the organization in the primary visual (1988) 2183–2200.
cortex, with extrastriate areas demonstrating greater size [2] M.E. Bickford, W. Guido, D.W. Godwin, Neurofilament proteins in Y-cells of the cat lateral geniculate nucleus: normal expression and
and spacing in their periodic structures. For example, in V1
alteration with visual deprivation, J. Neurosci. 18 (1998) 6549–
there are punctate CO blobs which project to thin CO
6557.
stripes in V2. The interblob regions of V1 project to the
[3] J.D. Boyd, J.A. Matsubara, Tangential organization of callosal
interstripes in V2 and the thick stripes in V2 receive input connectivity in the cat’s visual cortex, J. Comp. Neurol. 347 (1994)
from layer 4B of V1 [27]. Even within V2 stripes, a 197–210.
[4] J.D. Boyd, J.A. Matsubara, Modular organization of corticocortical
substructure has been found. For example, V2 projections
inputs and outputs of area 19, Soc. Neurosci. Abstr. 20 (1994) 1742.
to V4 originate in submodular compartments within the
[5] J.D. Boyd, J.A. Matsubara, Laminar and columnar patterns of
thin CO stripes and interstripes [17]. Clusters of both MT
geniculocortical projections in the cat: relationship to cytochrome
projecting cells [46] and Cat-301 labeled cells [11,35] are oxidase, J. Comp. Neurol. 365 (1996) 659–682.
found in the thick CO stripes, also representing a sub- [6] J.D. Boyd, J.A. Matsubara, Projections from V1 to lateral
suprasyl-modular organization in these stripes. Furthermore, rather vian cortex: an efferent pathway in the cat’s visual cortex that originate preferentially from CO blob columns, Vis. Neurosci. 16
than being uniform, CO stripes in V2 consist of irregular
(1999) 1–12.
aggregates of dark CO patches [52]. The MT-projecting
[7] S. Clarke, G.M. Innocenti, Organization of immature
intra-hemis-cells within the CO stripes colocalize with patches of pheric connections, J. Comp. Neurol. 251 (1986) 1–22.
dense CO staining within the band, demarcating a sub- [8] B. Conway, J.D. Boyd, T.H. Stewart, J.A. Matsubara, The projection
modular organization [46]. Like area 19 of the cat, V2 has from V1 to extrastriate area 21a: a second patchy efferent pathway that colocalizes with the CO blob columns in cat visual cortex,
a band organization and within these bands there is a
Cerebr. Cortex 10 (2000) 149–159.
substructure. Despite some irregularity in the structure of
[9] D.P. Crockett, S. Maslany, S.L. Harris, M.D. Egger, Enhanced
these primate modules, the connections between modules cytochrome-oxidase staining of the cuneate nucleus in the rat reveals in different areas is an important anatomical component of a modifiable somatotopic map, Brain Res. 612 (1993) 41–55.
visual parallel processing in this species. This may also be [10] C. Dehay, H. Kennedy, J. Bullier, Characterization of transient cortical projections from auditory, somatosensory, and motor
cor-true in the cat with different periodic structures
represent-tices to visual areas 17, 18, and 19 in the kitten, J. Comp. Neurol.
ing different processing streams.
272 (1988) 68–89.
[11] E.A. DeYoe, S. Hockfield, H. Garren, D.C. VanEssen, Antibody labeling of functional subdivisions in visual cortex: CAT-301
5. Conclusions immunoreactivity in striate and extrastriate cortex of macaque monkey, Vis. Neurosci. 5 (1990) 67–81.
[12] B. Dreher, A.G. Leventhal, P.T. Hale, Geniculate input to cat visual
Area 19 efferent neurons projecting to area 21a are
cortex: a comparison of area 19 with areas 17 and 18, J.
Neuro-organized into a series of irregular, mediolaterally elon- physiol. 44 (1980) 804–826.
gated bands. The irregular structure and periodicity of the [13] B. Dreher, R.L. Djavadian, K.J. Turlejski, C. Wang, Areas PMLS
bands is consistent with the increased organizational and 21a of cat visual cortex are not only functionally but also hodologically distinct, Prog. Brain Res. 112 (1996) 251–276.
complexity witnessed in other visual extrastriate areas [38]
[14] B. Dreher, C. Wang, K.J. Turlejski, R.L. Djavadian, W. Burke, Areas
and may be related to the type of input and / or activity
PMLS and 21a of cat visual cortex: two functionally distinct areas,
processed by area 19. The bands also have a substructure, Cerebr. Cortex 6 (1996) 585–599.
most likely consisting of multiple columnar clusters of [15] R.H. Dyck, M.S. Cynader, An interdigitated columnar mosaic of
cat and monkey visual cortex, Proc. Natl. Acad. Sci. USA 90 (1993) [36] J. Olavarria, R.C. Van Sluyters, Unfolding and flattening the cortex
9066–9069. of gyrencephalic brains, J. Neurosci. Meth. 15 (1985) 91–102.
[16] D.J. Felleman, D.C. Van Essen, Distributed hierarchical processing [37] L.A. Palmer, A.C. Rosenquist, R.J. Tusa, The retinotopic organiza-in the primate cerebral cortex, Cerebr. Cortex 1 (1991) 1–47. tion of lateral suprasylvian visual areas in the cat, J. Comp. Neurol. [17] D.J. Felleman, Y. Xiao, E. McClendon, Modular organization of 177 (1978) 237–256.
occipito-temporal pathways: cortical connections between visual [38] B.R. Payne, Evidence for visual cortical area homologs in cat and area 4 and visual area 2 and posterior inferotemporal ventral area in macaque monkey, Cerebr. Cortex 3 (1993) 1–25.
macaque monkeys, J. Neurosci. 17 (1997) 3185–3200. [39] B.R. Payne, D.F. Siwek, Visual-field map in the callosal recipient [18] J.M. Ferrer, N. Kato, D.J. Price, Organization of association zone at the border between areas 17 and 18 in the cat, Vis. Neurosci.
projections from area 17 to areas 18 and 19 and to suprasylvian 7 (1991) 221–236.
areas in the cat’s visual cortex, J. Comp. Neurol. 316 (1992) [40] K.S. Rockland, D.N. Pandya, Laminar origins and terminations of
261–278. cortical connections of the occipital lobe in the rhesus monkey,
[19] R.A.W. Galuske, W. Singer, The origin and topography of long-range Brain Res. 179 (1979) 3–20.
intrinsic projections in cat visual cortex: a developmental study, [41] J.W. Scannell, C. Blakemore, M.P. Young, Analysis of connectivity Cerebr. Cortex 6 (1996) 417–430. in the cat cerebral cortex, J. Neurosci. 15 (1995) 1463–1483. [20] C.D. Gilbert, T.N. Wiesel, Clustered intrinsic connections in cat [42] C.J. Shatz, M.P. Stryker, Prenatal tetrodotoxin infusion blocks the
visual cortex, J. Neurosci. 3 (1989) 1116–1133. segregation of retinogeniculate afferents, Science 242 (1988) 87–89. [21] C.J. Heath, E.G. Jones, Connexions of area 19 and the lateral [43] H. Sherk, Location and connections of visual cortical areas in the
suprasylvian area of the visual cortex of the cat, Brain Res. 19 cat’s suprasylvian sulcus, J. Comp. Neurol. 247 (1986) 1–31. (1970) 302–305. [44] H. Sherk, Retinotopic order and functional organization in a region [22] A.K. Horn, K.-P. Hoffman, Combined GABA-immunocytochemistry of suprasylvian visual cortex, the Clare-Bishop area, Prog. Brain
and TMB–HRP histochemistry of pretectal nuclei projecting to the Res. 75 (1988) 237–244.
inferior olive in rats, cats and monkeys, Brain Res. 409 (1987) [45] S. Shipp, S. Grant, Organization of reciprocal connections between 133–138. area 17 and the lateral suprasylvian area of cat visual cortex, Vis. [23] J.C. Horton, D.R. Hocking, Timing of the critical period for Neurosci. 6 (1991) 339–355.
plasticity of ocular dominance columns in macaque striate cortex, J. [46] S. Shipp, S. Zeki, The organization of connections between areas V5 Neurosci. 17 (1997) 3684–3709. and V2 in macaque monkey visual cortex, Eur. J. Neurosci. 1 (1989) [24] J.H. Kaas, Topographic maps are fundamental to sensory process- 333–354.
ing, Brain Res. Bull. 44 (1997) 107–112. [47] T.H. Stewart, J.A. Matsubara, Characterization of extrastriate pro-[25] J. Kawano, Cortical projections of the parvocellular laminae C of jection modules in area 19, Soc. Neurosci. Abstr. 25 (1998) 2093. the dorsal lateral geniculate nucleus in the cat: an anterograde wheat [48] J. Stone, B. Dreher, Projections of X- and Y-cells of the cat’s lateral germ agglutinin conjugated to horseradish peroxidase study, J. geniculate nucleus to areas 17 and 18 of visual cortex, J. Neuro-Comp. Neurol. 392 (1998) 439–457. physiol. 36 (1973) 551–567.
[26] Y. Liu, Q. Gu, M.S. Cynader, An improved staining technique for [49] L.L. Symonds, A.C. Rosenquist, Corticocortical connections among cytochrome C oxidase, J. Neurosci. Meth. 49 (1993) 181–184. visual areas in the cat, J. Comp. Neurol. 229 (1984) 1–38. [27] M.S. Livingstone, D.H. Hubel, Segregation of form, color, move- [50] L.L. Symonds, A.C. Rosenquist, Laminar origins of visual cortical
ment and depth: anatomy, physiology, and perception, Science 240 connections in the cat, J. Comp. Neurol. 229 (1984) 39–47. (1988) 740–749. [51] J. Tigges, M. Tigges, S. Anschel, N. Cross, W.D. Letbetter, R.L. [28] H.J. Luhmann, L.M. Millan, W. Singer, Development of horizontal McBride, Areal and laminar distribution of neurons interconnecting intrinsic connections in cat striate cortex, Exp. Brain Res. 63 (1986) the central visual cortical areas 17, 18, 19, and MT in squirrel
443–448. monkey(Saimiri), J. Comp. Neurol. 202 (1981) 539–560.
[29] M.A. MacNeil, S.G. Lomber, B.R. Payne, Thalamic and cortical [52] R.B. Tootell, S.L. Hamilton, Functional anatomy of the second projections to middle suprasylvian cortex of cats: constancy and visual area (V2) in the macaque, J. Neurosci. 9 (1989) 2620–2644. variation, Exp. Brain Res. 114 (1997) 24–32. [53] K. Toyama, K. Mizobe, E. Akase, T. Kaihara, Neuronal responsive-[30] M.M. Mesulam, Tetramethylbenzidine for horseradish peroxidase ness in area 19 and 21a, and the posteromedial lateral suprasylvian
neurochemistry, J. Histochem. Cytochem. 26 (1978) 106–117. cortex of the cat, Exp. Brain Res. 99 (1994) 289–301.
[31] J.W. Morley, R.M. Vickery, Spatial and temporal frequency selectivi- [54] R.J. Tusa, A.C. Rosenquist, L.A. Palmer, Retinotopic organization ty of cells in area 21a of the cat, J. Physiol. 501 (1997) 405–413. of areas 18 and 19 in the cat, J. Comp. Neurol. 185 (1979) 657–678. [32] J.W. Morley, L. Yuan, R.M. Vickery, Corticocortical connections [55] R.J. Tusa, L.A. Palmer, Retinotopic organization of areas 20 and 21
between area 21a and primary visual cortex in the cat, NeuroReport in the cat, J. Comp. Neurol. 193 (1980) 147–164.
8 (1997) 1263–1266. [56] T. Voight, S. LeVay, M.A. Stamnes, Morphological and immuno-[33] K. Mulligan, H. Sherk, A comparison of magnification functions in cytochemical observations on the visual callosal projections in the
area 19 and the lateral suprasylvian visual area in the cat, Exp. Brain cat, J. Comp. Neurol. 272 (1988) 450–460.
Res. 97 (1993) 195–208. [57] L. Zaborszky, L. Heimer, Combination of tracer techniques, espe-[34] K.M. Murphy, D.G. Jones, R.C. Van Sluyters, Cytochrome-oxidase cially HRP and PHA-L, with transmitter identification for correlated blobs in cat primary visual cortex, J. Neurosci. 15 (1995) 4196– light and electron microscopic studies, in: L. Heimer, L. Zaborszky
4208. (Eds.), Neuroanatomical Tract-Tracing Methods 2, Plenum Press,
[35] J.F. Olavarria, D.C. Van Essen, The global pattern of cytochrome New York, 1989, pp. 49–96. oxidase stripes in visual area V2 of the macaque monkey, Cerebr.