ISBN (Indonesia): 978-602-73852-0-7 1309
INFLUENCE ON AWARENESS, PERCEIVED QUALITY, UNIQUENESS,
SOCIAL IMAGE, AND HOME COUNTRY ORIGIN TO PRICE PREMIUM
AND LOYALTY ON HÄAGEN DAZS PREMIUM PACKAGED ICE CREAM
IN SURABAYA
Sutrisno Hamdany Indarini Dudi Anandya
Management / Faculty of Business and Economics, University of Surabaya, Indonesia [email protected] ;[email protected]; [email protected]
Abstract
This research aims to analyze the influence of variables: Awareness, Quality, Uniqueness, Social Image, and Home Country Origin to Price Premium and Loyalty. This type of research is causal research. The research uses a quantitative approach. Source of data used is primary data that is by distributing questionnaires. The sample used in this study was 150 questionnaires that have been distributed in Surabaya. The sampling technique used is judgment sampling and the data will be processed using SPSS 18.0 for Windows and AMOS 18.
The results obtained indicate a significant effect on awareness, quality, social image, and the home country of origin to price premium, as well as the social image, home country of origin, and uniqueness to loyalty while the influence of uniqueness to price premium is not proven. Influence of awareness and quality to loyalty also not proven.
Keywords: brand image, awareness, quality, uniqueness, social image
JEL CLASSIFICATION: M30, M31
INTRODUCTION
In this present time, economic development leads to intense competition. The growing information technology, facilitates the acquisition of information, as well as the use of social media as a promotional tool making business competition in Indonesia tighter. Indonesia is one country where there are many companies that compete with similar
products that don’t have much difference from one another, so that it becomes a challenge
1310 ISBN (Vietnam): 978-604-73-4020-0
which tend to be cheaper than branded products usually give the advantage to the company in gaining market share. The retailers designed attractive packaging, which is not inferior to similar branded products design. The use of packaging materials that are similar to branded products, the installation of artistic photos, the layout of packaging are laid out well, selecting the right color and writing informative sentences related to the product successfully remove the impression of cheap of private label products and attract consumers. The challenges faced by these companies, which in turn requires an added value that can make a difference to any company engaged in various product categories, which is no exception to the category of products of the food industry sector. Therefore, this research is important to be done in order to facilitate the company to face such challenges.
RESEARCH METHODOLOGY
The approach used in this study is a quantitative approach because it uses data processing from primary data source which is processed to generate the data. The technique is to use a survey that contains questions directly through a questionnaire. Procedures carried out this study to collect data include: (1) Develop a questionnaire according to the topic under study; (2) Searching for the respondent in accordance with the characteristics of the target population has been determined; (3) Ask the willingness of respondents to fill out the questionnaire; (4) Distributing questionnaires to the respondent; (5) Explain the procedures for filling out the questionnaire to the respondent; (6) Collect the completed questionnaires by respondents; (7) Screening questionnaires (8) Creating a data tabulation.
In this study, the target population is the people who buy and consume products of premium ice cream brand Häagen Dazs in the last three months. Characteristics of the population that has been set is the one who has the education level of Senior High School (SMA / SMK) in order to fill out the questionnaire properly so as to facilitate in obtaining valid data, never feel or eating ice cream of other brands, and do not buy ice cream Häagen Dazs only when there is a promo. In this study, the sample is the people in Surabaya society who buy and consume products of premium ice cream brand Häagen Dazs in the last three months based on characteristics of the population.
ISBN (Indonesia): 978-602-73852-0-7 1311
This study uses the interval level, the level measurement that has the same distance and the difference is clear on the scale that has been set. Measurement scale used in this study is a numerical scale of 1 - 5. Before the data is processed using SEM method, first the validity and reliability have to be tested using SPSS. The measuring tools is said to have validity if the correlation between the total score with the score of each question is
significant, correlation was shown with significantly less than alpha (α) 0.05. The research questionnaire is considered reliable if the Cronbach alpha ≥ 0.5.
After the measurement is said to be valid and reliable, then test the fitness model. Ferdinand (2002: 55-61) provides some indexes that are used to test the suitability of the model is accepted or rejected, as follows:
1. CMIN/DF (Relative Chi-square)
According to Arbuckle (1997) on Ferdinand (2002: 58), CMIN / DF that relatively less than 2.0 or even less than 3.0 indicates the model can be accepted.
2. RMSEA (The Root Mean Square Error Approximation)
RMSEA is an index that can be used to compensate statistical Chi-Square in a large sample. The smaller the value of RMSEA, can be said good fit, that is if worth ≤ 0.08. If
RMSEA ≤ 0.05 is a close fit.
3. GFI (Goodness of Fit Index)
GFI value ranging from 0 (poor fit) to 1 (perfect fit). GFI is acceptable and called good fit
if GFI ≥ 0.90, while ≤ 0.8 GFI <0.9 is referred to as marginal fit.
4. TLI (Tucker Lewis Index)
TLI acceptable value is ≥ 0.95 and TLI value close to 1 indicates a good fit, while 0.8 ≤
TLI <0.9 is referred to as marginal fit (Hair et al., 2010: 670).
5. CFI (Comparative Fit Index)
CFI value is in the range of 0 to 1, which is getting close to 1, indicating the highest level
(very good fit). CFI value ≥ 0.9 is a good fit, while ≤ 0.8 CFI <0.9 is referred to as marginal fit. The recommended value is CFI ≥ 0.95 (Hair et al., 2010: 670).
After suitability test model (model fit), the next step is to conduct an assessment of the uni-dimensionality/validity and reliability (Hair et al., 2010: 697). Uni-dimensionality is an assumption used in calculating the reliability of the model suggests that a one-dimensional models and indicators used to have a good degree of conformity (Hair et al, 2010: 697).
1312 ISBN (Vietnam): 978-604-73-4020-0
Validity is the extent to which the indicator accurately measures should be measured. The approach used to measure uni-dimensionality and reliability is the composite reliability and variance extracted, which are described as follows:
1. Construct reliability
According Bagozzi and Yi (1988) in Cahyono (2010), restrictions to construct reliability
is ≥ 0.60. Construct reliability values can be obtained through the following formula:
...(1)
2. Variance extracted
Extracted variance value indicates the amount of variance of the extracted indicators by developed latent constructs. High variance extracted value indicates that the indicator has represented the developed latent constructs well. According Bagozzi and Yi (1988) in Cahyono (2010), Average Variance Extracted (AVE) is intended to measure the percentage of the variance of a set of indicators that can be extracted or explained by its
latent constructs. The value of acceptable variance extracted is ≥ 0.40. Extracted variance
can be obtained through the following formula:
...(2)
In the SEM hypothesis test is called the structural model. In the hypothesis test using α = 5% due to the questionnaire distributed by the authors themselves and so there is no possibility of bias in the questionnaire. Thus, the hypothesis could be accepted if the value
of CR ≥ 1.96.
RESULTS AND DISCUSSIONS
Validity in plain language is used to measure whether a questionnaire is valid or invalid to reveal something that will be measured. Validity testing is performed on each question in the questionnaire by looking at the Pearson correlation of the total score obtained by each statement. Validity test was conducted using a sample of 30 respondents were obtained through questionnaires that form the study variables; awareness, quality, uniqueness, social image, home country of origin, price premium, and loyalty. If the results of the Pearson correlation between the total score of each statement generate significant value
less than 0.05 (α = 5%), then the statement is declared as a valid item. Validity testing
performed using SPSS 18.0 for Windows.
ISBN (Indonesia): 978-602-73852-0-7 1313 Table 1. Validity of Test Results Awareness Variable Statement
No Statement Pearson
Correlation Sig. Description
1 You are aware of Häagen Dazs brand. .760** .000 Valid 2 You know what Häagen Dazs brand look like. .754** .000 Valid 3 You know what Häagen Dazs brand stands for. .785** .000 Valid
Source: The results of data processing SPSS 18.0 for Windows
Table 2. Validity of Test Results Quality Variable Statement
No Statement Pearson
Correlation Sig. Description
1 Products of Häagen Dazs are well made. .814** .000 Valid
2 Products of Häagen Dazs have a high standard of
quality. .722** .000 Valid
3 Products of Häagen Dazs have a consistent
quality. .599** .000 Valid
Source: The results of data processing SPSS 18.0 for Windows
Table 3. Validity of Test Results Home Country Origin Variable Statement
No Statement Pearson
Correlation Sig. Description
1 Häagen Dazs is definitely an American brand. .767** .000 Valid
2 Products of Häagen Dazs are manufactured in
America. .838** .000 Valid
3 Products of Häagen Dazs are made of American
ingredients. .813** .000 Valid
Source: The results of data processing SPSS 18.0 for Windows
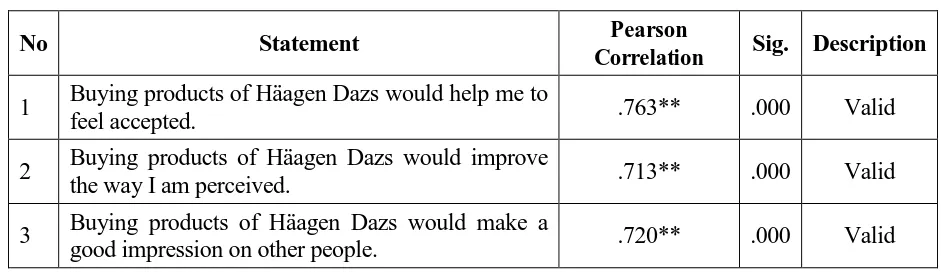
Table 4. Validity of Test Results Social Image Variable Statement
No Statement Pearson
Correlation Sig. Description
1 Buying products of Häagen Dazs would help me to
feel accepted. .763** .000 Valid
2 Buying products of Häagen Dazs would improve
the way I am perceived. .713** .000 Valid
3 Buying products of Häagen Dazs would make a
good impression on other people. .720** .000 Valid
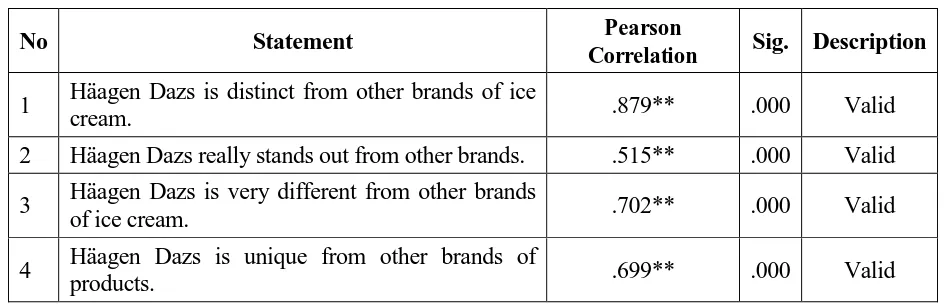
1314 ISBN (Vietnam): 978-604-73-4020-0 Table 5. Validity of Test Results Uniqueness Variable Statement
No Statement Pearson
Correlation Sig. Description
1 Häagen Dazs is distinct from other brands of ice
cream. .879** .000 Valid
2 Häagen Dazs really stands out from other brands. .515** .000 Valid
3 Häagen Dazs is very different from other brands
of ice cream. .702** .000 Valid
4 Häagen Dazs is unique from other brands of
products. .699** .000 Valid
Source: The results of data processing SPSS 18.0 for Windows
Table 6. Validity of Test Results Price Premium Variable Statement
No Statement Pearson
Correlation Sig. Description
1 You are willing to pay a higher price for products of
Häagen Dazs than for other brands. .820** .000 Valid
2 You are willing to pay a lot more for Häagen Dazs
than other brands in this category. .820** .000 Valid
Source: The results of data processing SPSS 18.0 for Windows
Table 7. Validity of Test Results Loyalty Variable Statement
No Statement Pearson
Correlation Sig. Description
1 You would recommend Häagen Dazs to someone
who seeks advice. .866** .000 Valid
2 Next time you purchase ice cream, you will buy
Häagen Dazs. .840** .000 Valid
3 You consider Häagen Dazs to be your first choice. .741** .000 Valid
Source: The results of data processing SPSS 18.0 for Windows
ISBN (Indonesia): 978-602-73852-0-7 1315
values below 0.6, then the statement has a poor reliability (Zikmund, 2009; p.306). Reliability measurements conducted on 30 respondents using SPSS 18.0 for Windows.
Table 8. Reliability Test Result
No Variable Nilai Cronbach Alpha Description
1 Awareness .638 Reliable
2 Quality .524 Reliable
3 Home Country Origin .730 Reliable
4 Social Image .561 Reliable
5 Uniqueness .645 Reliable
6 Price Premium .514 Reliable
7 Loyalty .740 Reliable
Source: The results of data processing SPSS 18.0 for Windows
According to Nunnally (1967) in Tjiptono et al. (2004, p.19), reliability (Alpha numeric) of 0.5 to 0.6 is sufficient and efforts to improve the reliability exceeded 0.8 could be wasting energy only. Based on table 8, it can be seen that all variables have a Cronbach alpha value greater than 0.5 so that it can be said all the variables are reliable and can be used for the next step.
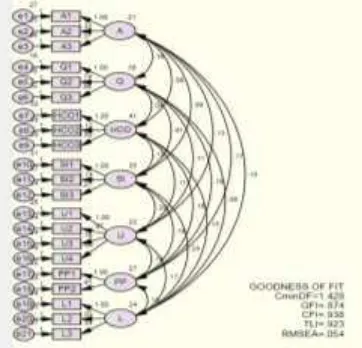
Measurement model
The following picture is the measurement model derived from data processing using the software AMOS 18. If there are indicators which have a standard loading <0.5, then the indicator will be removed from the measurement model.
Figure 1. Measurement Model AMOS 18 Running Result
1316 ISBN (Vietnam): 978-604-73-4020-0
The results of measurements model Figure 1 have standard loading > 0.5. So it can be seen that this model is suitable to be measurement model. The following table describes the suitability test results are processed via the AMOS.
Table 9. Hasil Uji Kecocokan Model Pengukuran
No Test match Results Description
1 CMIN/DF 1,428 Good fit
2 GFI 0,874 Marginal fit
3 CFI 0,938 Good fit
4 TLI 0,923 Good fit
5 RMSEA 0,054 Good fit
Source: Processing Results AMOS 18.
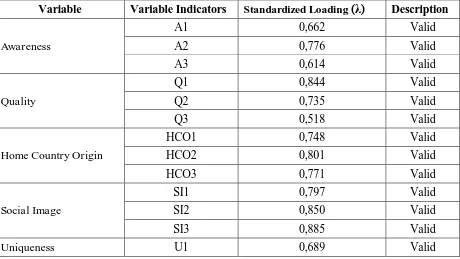
Reliability test in the measurement model
Reliability testing is used in order to know the internal consistency of indicators, namely the reliability of the measurement results is relatively consistent when measurements were performed twice or more. If the value is reliable, the value of consistency in measuring the latent variables will be higher as well. The approach used to measure the reliability is the construct reliability and variance extracted.
Table 10. Reliability Test in the Measurement Model
Variable Variable Indicators Standardized Loading(λ) Description
Awareness
A1 0,662 Valid
A2 0,776 Valid
A3 0,614 Valid
Quality
Q1 0,844 Valid
Q2 0,735 Valid
Q3 0,518 Valid
Home Country Origin
HCO1 0,748 Valid
HCO2 0,801 Valid
HCO3 0,771 Valid
Social Image
SI1 0,797 Valid
SI2 0,850 Valid
SI3 0,885 Valid
ISBN (Indonesia): 978-602-73852-0-7 1317
U2 0,574 Valid
U3 0,757 Valid
U4 0,551 Valid
Price Premium PP1 0,747 Valid
PP2 0,590 Valid
Loyalty
L1 0,682 Valid
L2 0,675 Valid
L3 0,737 Valid
Source: Processing Results AMOS 18.
Based on table 10, it is known that all items on the statement of the research variable have a value of Standardized Loading more than 0.5, and therefore all of the indicator variable is declared valid and can be used for further analysis.
Table 11. Construct Reliability
Variable (�std.loading)2 �error Construct Reliability
A 1,42 1,58 0,73
Q 1,52 1,48 0,75
HCO 1,79 1,20 0,82
SI 2,14 0,86 0,88
U 1,68 2,32 0,74
PP 0,90 1,09 0,62
L 1,46 1,53 0,74
Source: Excel 2007, processed.
According to Bagozzi and Yi (1988) in Cahyono (2010), restrictions to construct
reliability are ≥ 0.60. Standardized loading value for each indicator obtained from the AMOS 18 and the error value obtained by error = 1 - standardized loading2. Based on table 11, variables A, Q, HCO, SI, U, PP, and L have the construct reliability values > 0.60. So, all variables used are reliable.
Table 12. Variance Extracted
Variable (�std.loading) (�std.loading)2 �error Variance Extracted
A 2,052 1,42 1,58 0,47
Q 2,097 1,52 1,48 0,50
1318 ISBN (Vietnam): 978-604-73-4020-0
SI 2,532 2,14 0,86 0,71
U 2,571 1,68 2,32 0,42
PP 1,337 0,90 1,09 0,45
L 2,094 1,46 1,54 0,49
Source: Excel 2007, processed.
According to Bagozzi and Yi (1988) in Cahyono (2010), value of acceptable variance
extracted is ≥ 0.40. Standardized loading value for each indicator obtained from the
AMOS 18 and the error value obtained by error = 1 - standardized loading2. Based on
table 12, all the variables have a variance extracted values ≥ 0.40. So it can be interpreted
that the indicators have represented latent constructs are well developed.
Structural model
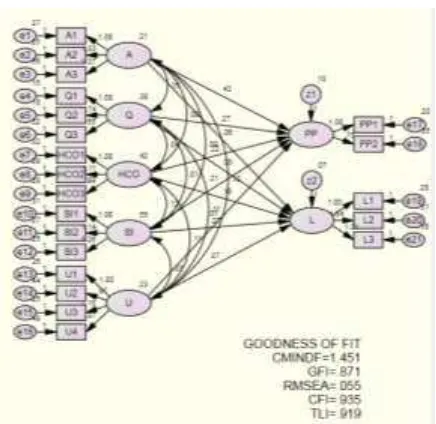
Figure 2. Structural Model AMOS 18 Results
Source: AMOS 18
Table 13. Structural Model Test Match Results
No Test Match Results Description
1 CMIN/DF 1.451 Good fit
2 GFI 0.871 Marginal fit
3 CFI 0.935 Good fit
4 TLI 0.919 Good fit
5 RMSEA 0.055 Good fit
ISBN (Indonesia): 978-602-73852-0-7 1319
CMIN/DF is the form of Chi-Square statistic divided by DF model (degree of freedom). Based on the table 13, the value of CMIN / DF obtained amounted to 1.451 ≤ 2. These results indicate that the model has met the required criteria.
GFI (Goodness of Fit Index) is a non-statistical measurement that has a value between 0 and 1. Based on table 13, the value of GFI obtained amounted to 0.871 which is below the 0.90 so called marginal fit.
CFI (Comparative Fit Index) is acceptable if it has a value between 0 and 1. According to the table 13, the value of CFI obtained amounted to 0.935> 0.90 so called good fit. These results indicate that the tested models already meet the required criteria.
TLI (Tucker Lewis Index) is an alternative incremental fit index which compares a model that is tested against a baseline. Based on table 13, TLI value obtained is equal to 0.919> 0.90 so called good fit and have met the required criteria.
RMSEA (Root Mean Square Error Approximation) is used to correct a tendency Chi-Square reject the model with a large number of samples. RMSEA can be called a good fit
if RMSEA ≤ 0.08. Based on the table 13, the RMSEA value obtained is equal to 0.055, which means when the model estimated error rate in the population is not too high.
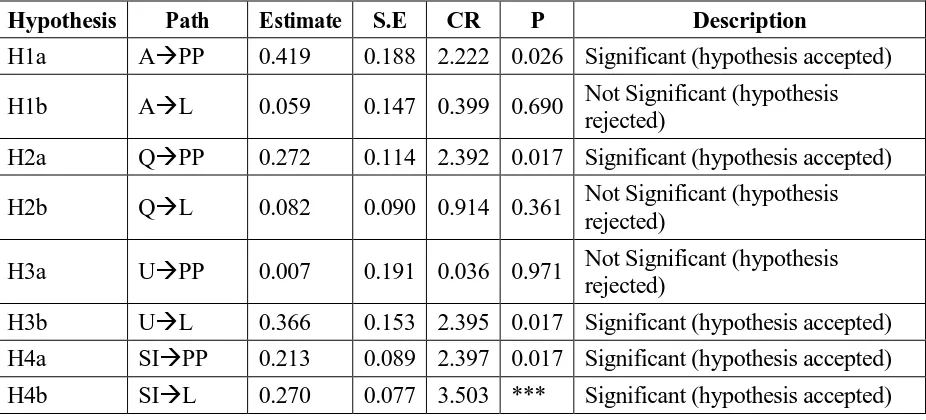
Hypothesis Testing
Hypothesis testing is done on the structural model to determine the results of influence between variables were significant and not significant. Hypothesis testing is done by
observing the value of CR (critical ratio) of every coefficient and is significant when t ≥ 1.96 (α = 5%).
Table 14. Evaluation of amount of Influence and Relation to Research Hypothesis
Hypothesis Path Estimate S.E CR P Description
H1a APP 0.419 0.188 2.222 0.026 Significant (hypothesis accepted)
H1b AL 0.059 0.147 0.399 0.690 Not Significant (hypothesis rejected)
H2a QPP 0.272 0.114 2.392 0.017 Significant (hypothesis accepted)
H2b QL 0.082 0.090 0.914 0.361 Not Significant (hypothesis rejected)
H3a UPP 0.007 0.191 0.036 0.971 Not Significant (hypothesis rejected)
1320 ISBN (Vietnam): 978-604-73-4020-0 H5a HCOPP 0.219 0.084 2.603 0.009 Significant (hypothesis accepted) H5b HCOL 0.180 0.069 2.624 0.009 Significant (hypothesis accepted)
Source: AMOS 18 processing results.
The amount of influence between variables can be observed on the value estimate at each track. The greater the value indicated, the greater the influence between one variable with another variable.
CONCLUSIONS AND SUGGESTIONS
Based on the results of research and statistical tests were carried out, the obtained conclusion that the ten hypotheses have been developed. The following is a specific explanation.
1. There is a significant influence on awareness to price premium of Häagen Dazs premium ice cream in Surabaya.
2. There is no significant influence on awareness to loyalty of Häagen Dazs premium ice cream in Surabaya.
3. There is a significant influence on quality to price premium of Häagen Dazs premium ice cream in Surabaya.
4. There is no significant influence on quality to loyalty of Häagen Dazs premium ice cream in Surabaya.
5. There is no significant influence on uniqueness to price premium of Häagen Dazs premium ice cream in Surabaya.
6. There is a significant influence on uniqueness to loyalty of Häagen Dazs premium ice cream in Surabaya.
7. There is a significant influence on social image to price premium of Häagen Dazs premium ice cream in Surabaya.
8. There is a significant influence on social image to loyalty of Häagen Dazs premium ice cream in Surabaya.
9. There is a significant influence on home country of origin to price premium of Häagen Dazs premium ice cream in Surabaya.
10.There is a significant influence on home country origin to loyalty of Häagen Dazs premium ice cream in Surabaya.
ISBN (Indonesia): 978-602-73852-0-7 1321
in the field as evidenced through the goodness of fit test results showing that the level of conformity of the model to the data can be said to be good.
Recommendations Häagen Dazs as premium ice cream company
Based on the results of this research is that in building a premium brand and brand loyalty require different ways. If Häagen Dazs intends to establish a premium brand so that should be improved are: awareness, for example by making more ad so that Häagen Dazs brand gained a place in the minds of consumers; quality, with more to convey what kind of ice cream quality in the community in order to strengthen the impression of the quality that already exist but not yet widely understood; social image, by improving the theme of luxury and facilities that are reliable in service; and home country of origin, provide more information related to the country of origin, place of production as well as the materials used, through social media has been used, like Facebook and Twitter. If Häagen Dazs intends to establish a brand loyalty then that should be improved is the uniqueness, such as presenting a new variant that is different from ice cream competitors, social image, and
home country of origin.
Häagen Dazs in Indonesian cities, including Surabaya in improving the brand image as a premium brand, need to keep customers loyal. Häagen Dazs currently provides more
promo in the form of discounts, which can degrade the image of a premium product. Keeping loyal customers will give an advantage in raising awareness because friends, coworkers, and family around the customers will realize the brand Häagen Dazs just by looking at the customers eating Häagen Dazs ice cream. Brand recall will increase, thus creating visibility and awareness, the better for Häagen Dazs brand without a lot of costs, thus increasing sales and profits. Häagen Dazs is also necessary to increase the uniqueness of ice cream with more different flavors because other competitors also have the same flavors. When Häagen Dazs doing so, Häagen Dazs can keep its image as a premium brand and at the same time, can have a loyal customer.
Recommendations for further research
This study still has some limitations. This limitation can still be improved so that open up opportunities for further research in the future.
The study was done by eliminating Corporations Social Responsibility (CSR) variable of the journal Anselmsson et al. (2014) because the object used in this study did not carry out CSR in Indonesia, resulting in further research can use CSR variable to obtain new information.
1322 ISBN (Vietnam): 978-604-73-4020-0
Future studies may use other brand or premium categories to obtain different information about the response of the respondents in the brand or premium different product categories.
Home country of origin in this study is only limited to one brand, so that in future studies are expected to not limit to just one brand only.
REFERENCES
1. Aaker, David A., 1991, Managing Brand Equity: Capitalizing on The Value of a Brand Name, The Free Press, New York.
2. Andrologi, Febrian., 2014, Analisis Pengaruh Brand Image dan Brand Awareness Terhadap Brand Loyalty dan Dampaknya Terhadap Brand Equity, Fakultas Ekonomika dan Bisnis Universitas Diponegoro, Semarang, Skripsi, tidak dipublikasikan.
3. Anselmsson, Johan., and Bondesson, Niklas Lars Anders., 2013, What Succesful Branding Looks Like: A Managerial Perspective, British Food Journal, Vol 115, Iss 11 pp 1612 – 1627.
4. Anselmsson, Johan., Johansson, Ulf., and Person, Niklas., 2007, Understanding Price Premium for Grocery Products: A Conceptual Model of Customer-Based Brand Equity, Journal of Product & Brand Management, Vol 16, Number 6 401 – 414.
5. Anselmsson, Johan., Vestman Bondeson, Niklas., and Johansson, Ulf., 2014, Brand Image and Customers’ Willingness to Pay a Price Premium for Food Brands, Journal of Product & Brand Management, Vol 23 Iss 2 pp 90 - 102.
6. Cahyono, Joko., 2010, Faktor-faktor yang Mempengaruhi Kerjasama Jangka Panjang untuk Meningkatkan Keunggulan Kompetitif Perusahaan, Aset, Vol 12, No 2, hal 135 – 164. 7. Dewi, Ngetshi Nirmala., Indarini., Anandya, Dudi., 2007, Perilaku Konsumen Dalam
Kategori Kelas Sosial: Pengambilan Keputusan Keluarga, Manajemen & Bisnis, Volume 6, Nomor 2, hal 168 – 189.
8. Tjiptono, Fandy., Chandra, Yanto., Diana, Anastasia., 2004, Marketing Scales, Penerbit Andi, Yogyakarta.
9. Ferdinand, A., 2002, Structural Equation Modeling Dalam Penelitian Manajemen Aplikasi Model-model Rumit Dalam Penelitian Untuk Tesis Magister dan Disertasi Doktor, Fakultas Ekonomi UNDIP, Semarang.
10. Hair, J.F., Black., W.C., Babin, B.J., dan Anderson, R.E., 2010, Multivariate Data Analysis, Seventh Edition, Pearson Education Inc., New Jersey.
ISBN (Indonesia): 978-602-73852-0-7 1323 12. Husin, Jamhur M., 2010, Pengaruh Brand Awareness, Brand Association, Perceived
Quality, dan Brand Image Terhadap Loyalitas Konsumen Sepeda Motor Honda, Jurusan Manajemen Pemasaran, Fakultas Ekonomi dan Bisnis, UIN Syarif Hidayatullah, Skripsi, Tidak dipublikasikan.
13. I.Erdog˘mus¸, I.B.Turan, 2012, The Role of Personality Congruence, Perceived Quality and
Prestige on Ready to Wear Brand Loyalty. Journal of Fashion Marketing and Management: An International Journal, Vol 16 Iss 4 pp. 399 – 417.
14. Keller, Kevin Lane., 2008, Strategic Brand Management: Building Measuring and Managing Brand Equity, Third Edition, Pearson Education Inc., Upper Saddle River, New Jersey.
15. Kotler, Philip., dan Armstrong, Gary., 2008, Prinsip – Prinsip Pemasaran, Edisi 12, Penerbit Erlangga, Jakarta.
16. Lassar, Walfried., Mittal, Banwari., and Sharma, Arun., 1995, Measuring Customer-Based Brand Equity, The Journal of Consumer Marketing, Vol 12, No 4 pp 11 – 19.
17. Lee, D. & Schaninger, C., 1996, Country of Production/Assembly As A New Country Image Construct: A Conceptual Application To Global Transplant Decision, Advances in International Marketing, Vol 7, 233-254.
18. Netmeyer, Richard G., Khrishnan, Balaji., Pullig, Chris., Wang, Guangping., Yagci, Mehmet., Dean, Dwane., Ricks, Joe., Wirth, Ferdinand., 2004, Developing and Validating Measures of Facets of Customer-Based Brand Equity, Journal of Business Research, Vol 57, 209-224.
19. Rangkuti, Freddy., 2004, The Power of Brands:Teknik Mengelola Brand Equity dan Strategi Pengembangan Mereka + Analisis Kasus dengan SPSS, Gramedia Pustaka Utama, Jakarta.
20. Subhani, Muhammad Imtiaz., and Osman, Ms. Amber., 2009, A Study On The Association Between Brand Awareness And Consumer/Brand Loyalty For The Packaged Milk Industry In Pakistan, Munich Personal RePEc Archive, No 21367.