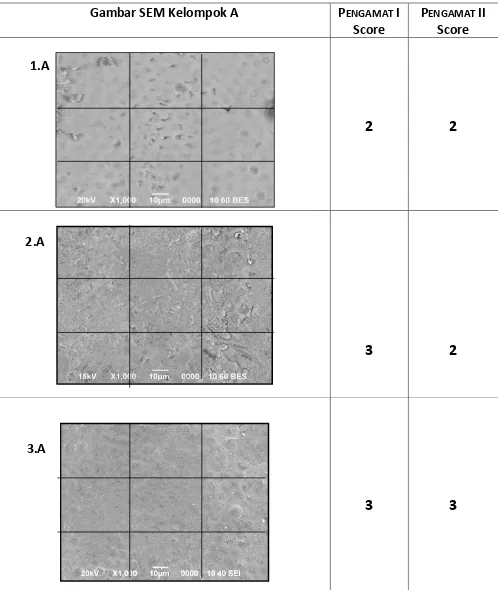
Gambar SEM Kelompok A
P
ENGAMAT
I
Score
P
ENGAMAT
II
Score
2
2
3
2
3
3
1.A
2.A
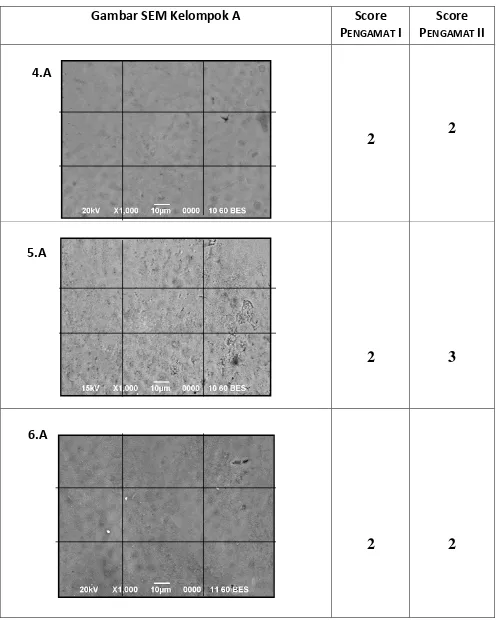
Gambar SEM Kelompok A
Score
P
ENGAMAT
I
Score
P
ENGAMAT
II
2
2
2
3
2
2
4.A
5.A
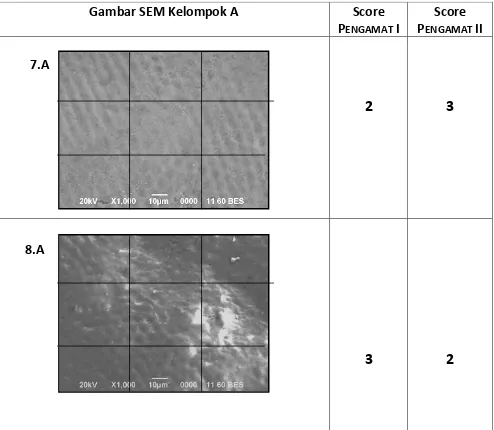
Gambar SEM Kelompok A
Score
P
ENGAMAT
I
Score
P
ENGAMAT
II
2
3
3
2
7.A
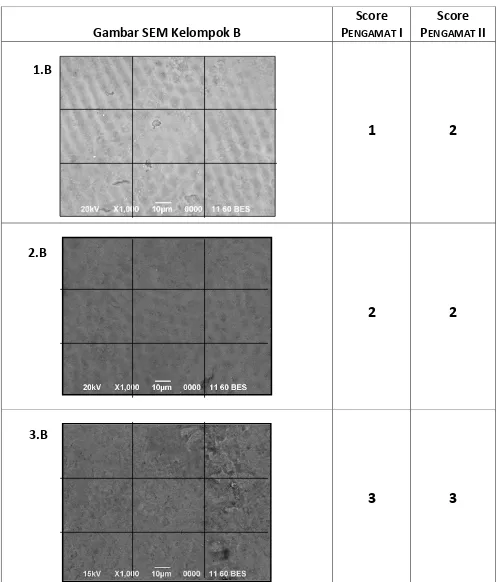
Gambar SEM Kelompok B
Score
P
ENGAMAT
I
Score
P
ENGAMAT
II
1
2
2
2
3
3
1.B
2.B
Gambar SEM Kelompok B
Score
P
ENGAMAT
I
Score
P
ENGAMAT
II
3
2
2
2
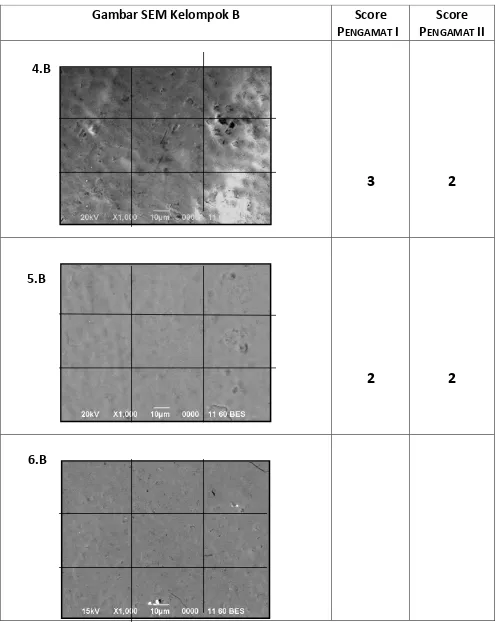
4.B
5.B
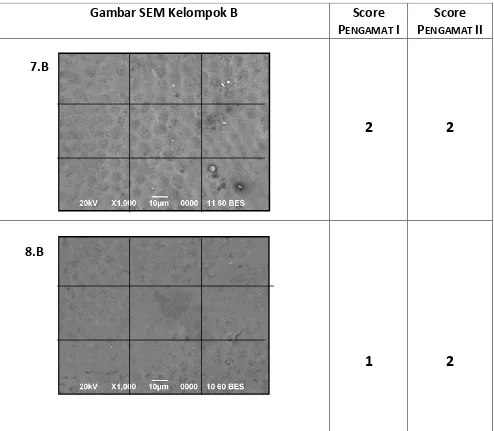
Gambar SEM Kelompok B
Score
P
ENGAMAT
I
Score
P
ENGAMAT
II
2
2
1
2
7.B
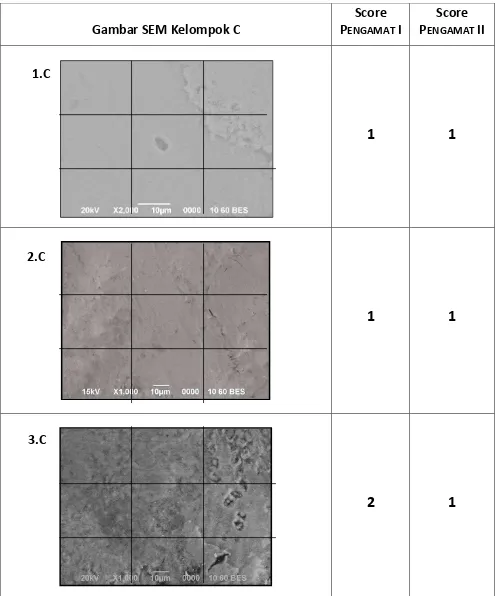
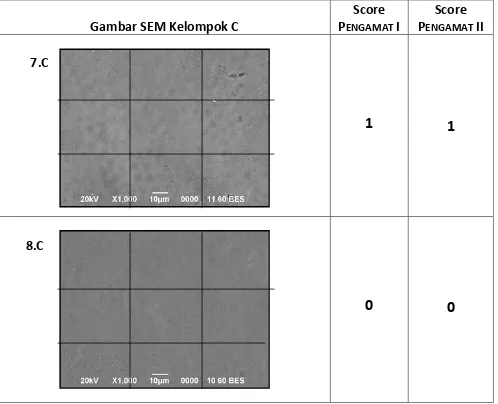
Gambar SEM Kelompok C
Score
P
ENGAMAT
I
Score
P
ENGAMAT
II
1
1
1
1
2
1
1.C
2.C
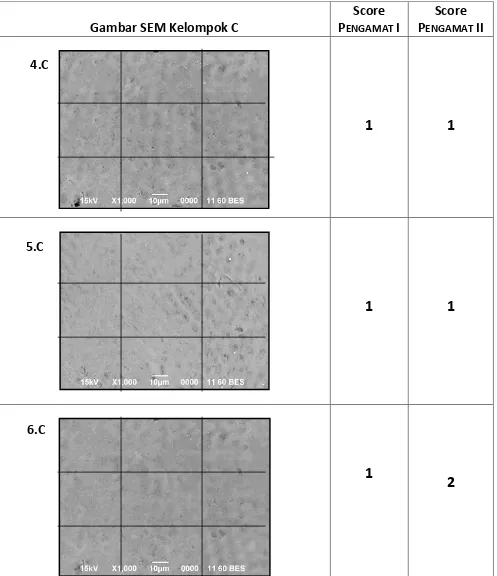
Gambar SEM Kelompok C
Score
P
ENGAMAT
I
Score
P
ENGAMAT
II
1
1
0
0
7.C
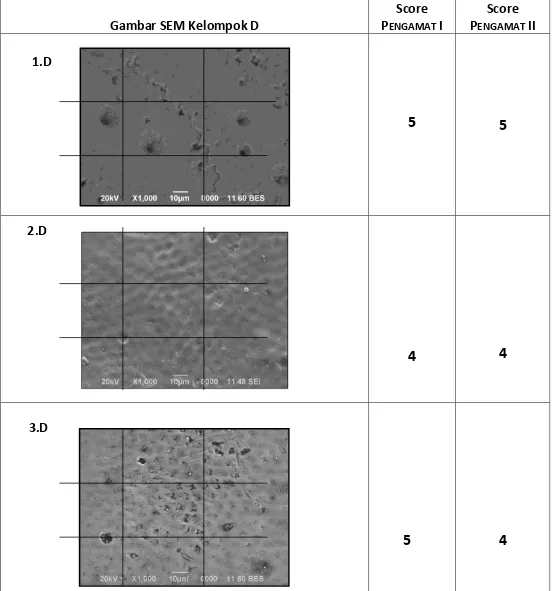
Gambar SEM Kelompok D
Score
P
ENGAMAT
I
Score
P
ENGAMAT
II
5
5
4
4
5
4
1.D
2.D
Gambar SEM Kelompok D
Score
P
ENGAMAT
I
Score
P
ENGAMAT
II
2
3
3
3
3
4
4.D
5.D
Gambar SEM Kelompok D
Score
P
ENGAMAT
I
Score
P
ENGAMAT
II
3
3
4
3
7.D
Lampiran V. Kandungan Unsur Ca, P Setiap Kelompok mengunakan alat uji
EDX
Kelompok I :
Aplikasi dengan gel ekstrak buah belimbing wuluh
Lampiran V ( lanjutan)
Kelompok II :
Aplikasi dengan gel CPP-ACP
Lampiran V (lanjutan)
Kelompok III : Aplikasi dengan
kombinasi gel CPP-ACP dan gel ekstrak buah belimbing wuluh
Lampiran V (lanjutan)
Kelompok IV :
Tanpa aplikasi
Post Hoc Tests
Mean Difference (I-J)
Std. Error Sig.
NPar Tests
Descriptives
pengamat Statistic Std. Error
nilai Pengamat 1 Mean 1.84 .111
95% Confidence Interval for Mean
Std. Deviation .628
Minimum 1
Maximum 3
Range 2
Interquartile Range 1
Skewness .118 .414
Kurtosis -.359 .809
Pengamat 2 Mean 1.84 .111
95% Confidence Interval for Mean
Std. Deviation .628
Minimum 1
Maximum 3
Range 2
Interquartile Range 1
Skewness .118 .414
Kurtosis -.359 .809
Mann-Whitney Test
Ranks
Ranks
pengamat N Mean Rank Sum of Ranks nilai Pengamat 1 32 32.50 1040.00
Pengamat 2 32 32.50 1040.00
Total 64
Test Statisticsa
nilai Mann-Whitney U 512.000
Wilcoxon W 1.040E3
Z .000
Asymp. Sig. (2-tailed) 1.000 a. Grouping Variable: pengamat
Descriptives
Kelompok Statistic Std. Error
Nilai I
Mean 2.38 .183
95% Confidence Interval for Mean
Std. Deviation .518
Minimum 2
Maximum 3
Range 1
Interquartile Range 1
Skewness .644 .752
Kurtosis -2.240 1.481
II
Mean 2.00 .267
95% Confidence Interval for Mean
Lower Bound 1.37 Upper Bound 2.63
Median 2.00
Variance .571
Std. Deviation .756
Minimum 1
Maximum 3
Range 2
Interquartile Range 2
Skewness .000 .752
Kurtosis -.700 1.481
III
Mean 1.00 .189
95% Confidence Interval for Mean
Std. Deviation .535
Minimum 0
Maximum 2
Range 2
Interquartile Range 0
Skewness .000 .752
Kurtosis 3.500 1.481
IV
Mean 3.62 .375
95% Confidence Interval for Mean
Lower Bound 2.74
Upper Bound 4.51
5% Trimmed Mean 3.64
Median 3.50
Variance 1.125
Std. Deviation 1.061
Minimum 2
Interquartile Range 2
Test Statisticsb
nilai
Mann-Whitney U .500
Wilcoxon W 36.500
Z -3.415
Asymp. Sig. (2-tailed) .001 Exact Sig. [2*(1-tailed Sig.)] .000a a. Not corrected for ties.
b. Grouping Variable: kelompok
NPar Tests
Mann-Whitney Test
Ranks
kelompo
nilai II 8 11.25 90.00
III 8 5.75 46.00
Total 16
Test Statisticsb
nilai
Mann-Whitney U 10.000
Wilcoxon W 46.000
Z -2.513
Asymp. Sig. (2-tailed) .012 Exact Sig. [2*(1-tailed Sig.)] .021a a. Not corrected for ties.
b. Grouping Variable: kelompok
NPar Tests
Test Statisticsb
nilai
Mann-Whitney U 7.000
Wilcoxon W 43.000
Z -2.713
Asymp. Sig. (2-tailed) .007 Exact Sig. [2*(1-tailed Sig.)] .007a a. Not corrected for ties.
Ranks
Test Statisticsb
nilai
Mann-Whitney U 23.000
Wilcoxon W 59.000
Z -1.062
Asymp. Sig. (2-tailed) .288 Exact Sig. [2*(1-tailed Sig.)] .382a a. Not corrected for ties.
b. Grouping Variable: kelompok
NPar Tests
Test Statisticsb
nilai
Mann-Whitney U 2.500
Wilcoxon W 38.500
Z -3.282
a. Not corrected for ties. b. Grouping Variable: kelompok
NPar Tests
Test Statisticsa,b
nilai Chi-Square 20.603
df 3
Asymp. Sig. .000 a. Kruskal Wallis Test
b. Grouping Variable: kelompok
Test Statisticsb
Z -2.443 Asymp. Sig. (2-tailed) .015 Exact Sig. [2*(1-tailed Sig.)] .021a a. Not corrected for ties.
b. Grouping Variable: kelompok
Tests of Normality
kelompok
Kolmogorov-Smirnova Shapiro-Wilk Statistic df Sig. Statistic df Sig.
a. Lilliefors Significance Correction
*. This is a lower bound of the true significance.
Data terdistribusi normal (Shapiro wilk) p>0,05
Oneway
95% Confidence Interval for Mean
Minimum Maximum Lower Bound Upper Bound
Posfor I 8 16.5650 1.97872 .69958 14.9108 18.2192 12.87 18.43 II 8 16.7038 1.96515 .69479 15.0608 18.3467 13.34 19.65 III 8 17.8700 1.21028 .42790 16.8582 18.8818 16.10 19.82 IV 8 14.9625 3.39248 1.19942 12.1263 17.7987 7.51 17.67 Total 32 16.5253 2.40649 .42541 15.6577 17.3929 7.51 19.82
Test of Homogeneity of Variances
Levene Statistic df1 df2 Sig. Calsium 2.772 3 28 .060
Posfor 1.363 3 28 .274
Data homogeny variansnya, artinya uji anova bisa dibaca hasilnya
ANOVA
Sum of Squares df Mean Square F Sig. Calsium Between Groups 608.443 3 202.814 3.816 .021
Within Groups 1488.168 28 53.149
Total 2096.611 31
Posfor Between Groups 34.272 3 11.424 2.202 .110
Within Groups 145.256 28 5.188 Total 179.528 31