63
Mediator in Mcd
onald’s
Fransisca Andreani, Tan Lucy Taniaji and Ruth Natalia Made Puspitasari
Faculty of Economics, Petra Christian University Jl. Siwalankerto 121−131 Surabaya 60236
Email: andrea@peter.petra.ac.id
Abstract
The objective of this paper is to examine the impact of McDonald’s brand image towards customer loyalty with customer satisfaction as a mediator by using descriptive and Partial Least Square (PLS) analyses. The results show that three hyphotheses are accepted which mean that there is a positive impact of strength of brand association towards customer loyalty, there is a positive impact of strength of brand association towards customer satisfaction, and there is a positive impact of customer satisfaction towards customer loyalty.
Keywords: Brand Image, Customer Loyalty, Customer Satisfaction
Abstrak
Tujuan dari penelitian ini adalah untuk menjelaskan dampak brand image dari perusahaan
McDonald’s terhadap loyalitas konsumen, dengan kepuasan konsumen sebagai variabel mediator yang dianalisa dengan menggunakan statistik deskriptif dan Partial Least Square (PLS). Hasil penelitian ini menunjukkan adanya dampak positif dari kekuatan brand association terhadap loyalitas konsumen, adanya dampak positif dari kekuatan brand association terhadap kepuasan konsumen, dan adanya dampak positif dari kepuasan konsumen terhadap loyalitas konsumen.
Kata Kunci: Brand Image, Loyalitas Konsumen, Kepuasan Konsumen
INTRODUCTION
McDonald’s is one of the biggest fast food
restaurants in the world. Its position as a fast food restaurant is very strong as there are a lot of McDonald’s outlets spread all over the world. In Indonesia,
Mc-Donald’s has been able to win the competition from
its rival, Burger King and made Burger King close its restaurants (Tangkudung, 2002).
The success of McDonald’s is also driven by its
strategy to maintain its brand image. According to Sari (2005), one strategy to use is by utilisizing its opera-tions, managing policies as well as human resources to support its long term goals. In addition to this, Jacob & Nicholas (2009) also stated that competitive strategy includes cost or price, quality, delivery speed, delivery reliability, copying with changing demand, flexibility and new product introduction speed and other product supports. There are a lot of ways to make customer satisfied and become loyal. One way is by building positive brand image (Randal, 2001). Creating strong and positive brand can make
cus-tomers feel and think that the product or service offered is better than its competitors. So restaurant owners always try to create positive brand image in their customers’ mind.
Sondoh et al. (2007) has studied about the effect of brand image on overall satisfaction and loyalty intention in the context of color cosmetic by distri-buting questionnaires to 97 female respondents in Malaysia. They used customer satisfaction as a mediat-ing variable. It is found that positive brand image could influence customer loyalty so that they would repurchase more product or service and recommend others to buy as much as 41.8%. This study also shows that there was positive relationship between brand image and customer loyalty as much as 35.8%. In addition, customer satisfaction could also lead to customer loyalty as much as 21.1%.
It shows that McDonald’s got the highest brand equity (17.78%), followed by KFC (16.8%), Burger King (16.16%), Lotteria (16.04%), Popeyes (15.07%), Jakob’s (13.03%) and finally Hardee’s (12.79%).
Furthermore, Wijaya (2005) studied about selecting fast food restaurants in Surabaya by distri-buting 12,000 questionnaires. The study revealed that the rank of the most visited restaurants were
Mc-Donald’s (50.3%), followed by KFC (26.5%), and
Pizza Hut (15.3%). Whereas the rest, like A&W,
Texas Fried Chicken, Wendy’s, and Popeye were
only visited by 2%.
We conducted a preliminary survey of 36 res-pondents regarding McDonald's brand image in Sura-baya. The results showed that McDonald's brand image was good. This is evident from the respondents who said very good as much as 64% and the percen-tage of respondents who said neutral to very bad as much as 36%. Based on the results above, we are interested in analyzing the influence of brand associa-tion as an element of a good brand image which
affects customer loyalty in McDonald’s Surabaya
with satisfaction as mediator.
LITERATURE REVIEW
According to Cannon et al. (2008), a brand name is a word, letter, or a group of words or letters. Branding is used to identify the product or service offered and differentiate it with its competitors. In addition, Hsieh and Lindridge stated that brand image is the perception of a brand through brand asso-ciation in the minds of customers (in Sondoh et al.,
2007). So, it can be concluded that brand image is a set of brand associations formed and attached to the minds of customers. Customers who are accustomed to using certain brands tend to have the consistency of brand image.
Brand image can be measured from the physical appearance of a product or service. This physical appearance can lead to the high-low perception in the
customers’ mind (Martinez, 2002). Furthermore,
Keller (2009) suggests Multi Dimensional Scalling
(MDS) approach to measure brand image. This includes the whole elements of brand image, such as favorability of brand association, strength of brand association, and uniqueness of brand association.
Grewal & Levy (2010) state that brand asso-ciations reflect the mental links that customers make between a brand and its key product attributes, such as a logo, slogan or famous personality. These brand
associations often result from a firm’s advertising and
promotional efforts. For instance, Toyota’s hybrid car, the Prius, is known for being economical, a good
value and stylishly good for the environment. BMW and Audi are associated with performance.
As mentioned earlier, factors of brand image in relation with brand association are the favourability of brand association, strength of brand association, and uniqueness of brand association. Important elements in the favourability of brand association are the ease of brand to say, the ability to keep the brand in the customers’ mind, as well as the fit between the brand impression in the customers’ mind with the desired corporate image of the brand. While important elements of strength include the physical appear-ance of products, functional facilities of products, product pricing, support facilities and appearance of products. The elements of uniqueness include varia-tion of service provided, the variavaria-tion of the price, as well as differentiation of the physical appearance of a product (Kotler, 2005).
In addition, Davies et al. (2003) say that the strong brand image will make customer satisfied. Brand image has something to do with product appearance so when customers are satisfied with it they will become loyal to the brand even though they have other optional brands (in Vinhas & Faridah, 2008).
Earls et al. (2004) also say that strong brand im-age can make customers loyal. But whenever
cus-tomers’ needs change and the brand cannot respond
these changing needs, according to Steel (2004), cus-tomers will tend to switch another brand (in Miller & Muir, 2004). Building a positive brand image can influence repeat purchase because a strong brand im-age can lead to customer loyalty. Furthermore, Schultz (2005) states that customers who are loyal to certain brand will recommend it to other people and not easily influenced by competitors to make pur-chases (in Sondoh et al., 2007).
Based on the framework above, there is a rela-tion between brand image with customer loyalty. Ac-cording to Earls et al. (1998), a strong brand image will make customer loyalty stronger (in Miller & Muir, 2004). Kotler (2005) and Keller (2003) also say that there are three factors forming brand image asso-ciated with brand association: favourability of brand association, strength of brand association, and unique-ness of brand association. Thus the hypotheses can be formed are as follows:
H1: There is an influence of favourability of brand association on customer loyalty.
H2: There is an influence of strength of brand associ-ation on customer loyalty.
Then according to Davies et al. (2003), the strong brand image will make customer satisfied. Brand image has something to do with product appea-rance so when customers are satisfied with it they will become loyal to the brand even though they have oth-er optional brands (in Vinhas & Faridah, 2008). Thus the next hypotheses are as follows:
H4: There is an influence of favorability of brand association on customer satisfaction.
H5: There is an influence of strength of brand associ-ation on customer satisfaction.
H6: There is an influence of uniqueness of brand association on customer satisfaction.
Furthermore, customer satisfaction positively affects customer loyalty (in Sondoh et al., 2007), thus the final hypothesis is as follows:
H7: There is an influence of customer satisfaction on customer loyalty.
RESEARCH METHODOLOGY
Type of Research, Population, and Sampling Design
This research is a causal quantitative to draw conclusions by using hypotheses testing. This research Conceptual Framework and Hypotheses
will explore among brand image impact towards cus-tomer loyalty with cuscus-tomer satisfaction as a mediator or mediating variable. The population in this research is all costumers who know and consume the product and service of McDonald’s aged 17 years to 53 years old considering their behavior and state of mind. A non-probability sampling is used due to infinite popu-lation.
Type and Source of data
The primary data in this research are data collected from questionnaires. The secondary data are taken from literature, journal, magazine, articles, and internet (Azwar, 2005).
Data Collecting Procedures and Method
1. Library Research
The collection of data is derived from a list of researchs in making the foundation of an existing theory.
2. Field Research
A preliminary survey was conducted on October 11, 2011 by providing open-ended questions to 36 respondents deployed through the Blackberry Messenger (BBM). We used a structured ques-tionnaire method, with a closed question type (structured) by using a Likert scale. Although the minimum number of samples should be 96, the writers distributed 110 questionnaires on October 27−31, 2011 on Thursday, Friday, Saturday, Sunday, and Monday. Only 100 questionnaires are valid.
Operational Definition of Variables
There are three kinds of operational variables used in this model, which are independent variables, a dependent variable, and a mediating variable. The independent variables are favourable of brand asso-ciation, strength of brand assoasso-ciation, and uniqueness of brand association. While the dependent variable is customer loyalty, and customer satisfaction is as an mediating variable.
Data Analysis Technique
1. Validity and Reliability Testing
Statistical Packet for Social Science (SPSS)
program is used to measure the questionnaires’ v
a-lidity and reliability. Vaa-lidity is to test whether the measurement suitable with what to measure.
Ac-cording to Hatane (2006), a measurement is said to be valid when the value of r > 0.30. Whereas, reliability test is the extent to which the results of testing is reliable.It is said to be reliable when the value of Cronbach Alpha is ≥ 0.6 (Sar-wono & Martodiredjo, 2008).
2. Descriptive Data Analysis
It is used to describe data characteristics in both texts and diagrams. The descriptive statistics can also be done to find the strength of the relation-ships among variables.
3. Top Two Boxes and Bottom Two Boxes Analysis The analyses of Top Two Boxes and Bottom Two Boxes are methods that combine the percentage of respondents in a Likert scale. It is used to deter-mine the ratio between the number of bottom option (score 1 and 2) – the scale of strongly dis-agree and disdis-agree with the top option (score of 4 and 5) – the scale of agree and strongly agree. 4. Partial Least Square (PLS)
According to Hatane (2011), PLS is a suitable approach to predict something, especially for a condition in which an indicator is formative or reflective. PLS can be applied on all data scales
and doesn’t need a lot of assumptions. In addition, the needed samples don’t have to be big. The data
analysis can be done using software Smart Partial Least Square (PLS).
RESULTS AND DISCUSSIONS
Respondent’s Profile Description
There are 100 respondents who participate in this research. Most of them are females (54 respon-dents), aged between 17−25 years old (69 respondents), students (66 respondents), coming at McDonlad’s usually accompanied with friends (51 respondents). Most of them spent less than Rp100.000,00 (77 respondents).
Validity and Reliability Testing
Research Description
Descriptive statistics are used to analyze statis-tical data to describe or illustrate how the data were collected. It is also to find strong relationships through a comparative analysis by using mean. So, it can be concluded that the majority of respondents consi-dering McDonald’s is more common to be called
“McD” (read: Mekdi). They disagree that the
pur-chase at McDonald’s is done just to buy a product because it has a various packaging.
This research used the two boxes approaches. The bottom two boxes approach accumulates two bottom answers in 5-point scale, they were strongly disagree = 1 and disagree = 2. On the contrary, top two boxes approach accumulates the two top answers in 5-point scale, they were agree = 4 and strongly agree = 5.
Tabel 1. Top Two Boxes of Customer Satisfaction
Indicators Top Two Boxes (%)
Neutral (%)
Bottom Two Boxes (%)
McDonald’s products match with its brand image
80 19 1
Customers are satisfied with McDonald’s brand
81 18 1
Customers are satisfied with McDonald’s service
78 20 2
Tabel 2. Top Two Boxes of Customer Loyalty
Indicators Top Two Boxes (%)
Neutral (%)
Bottom Two Boxes (%)
Repurchase 79 20 1
Recommend 58 35 7
Not easily influ-enced by another brand
39 39 22
The results of Top and Bottom Two Boxes ana-lyses show that the majority of the customers are
satisfied with brand image of McDonald’s (Table 1)
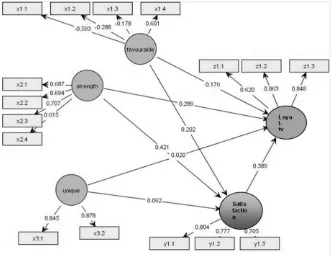
and those who are loyal with the brand will continue to purchase at McDonald’s (Table 2). The PLS model of the research and PLS coefficients are as follows (Figure 3)
Goodness of Fit Model PLS is measured using the Q square(Q2); Q Square for the structural model is to measure how well the observations generated by the model and to estimate its parameters. If the value of Q² > 0, it indicates that the model has predictive relevance; conversely, if the value of Q² < 0, it indi-cates that the model is lack of predictive relevance.
Q2 = 1 – ( 1 – R1²) ( 1 – R22 )
Q2 = 1 – ( 1 – 0.258) ( 1 – 0.439) Q2= 0.584.
observable to describe this effect. As a conclusion, the model can be used appropriately.
From Table 3 and 5, favourability of brand asso-ciation has no significant effect on customer loyalty. This means that the hypothesis of H1 is not accep-table. Eventhough customers are able to distinguish
McDonald’s brand with other brands by its ease to
say, acknowledging the logo and the like; it gives no influence for them to be loyal.
Compared to the previous factor, strength of brand association has more significant positive effect
on customer loyalty, so that hypothesis of H2 is accep-ted. Costumers are loyal because they are like
McDo-nald’s attractive product packaging, burger and ice cream variations, as well as its affordable prices. This is in line with Sondoh et al. (2007) which say that a positive brand image can influence on customer loyalty.
Uniqueness of brand association does not have a significant positive influence on customer loyalty, so that hypothesis of H3 is not acceptable. It suggests that McDonald's is able to communicate the uniqueness of Table 3. Path Coefficients of Partial Least Square (PLS)
Original Sample Estimate
Mean of Subsamples
Std.
Deviation TStatistic Pvalue Significance
Favourability Satisfaction 0.202 -0.030 0.262 0.772 0.44047915 Not Significant Strength Satisfaction 0.421 0.430 0.088 4.807 0.00000200 Significant
Uniqueness Satisfaction 0.062 0.048 0.138 0.450 0.65290547 Not Significant Favourability Loyalty 0.176 0.003 0.230 0.765 0.44463246 Not Significant Strength Loyalty 0.289 0.306 0.086 3.366 0.00082137 Significant
Uniqueness Loyalty 0.020 -0.007 0.125 0.159 0.87373308 Not Significant Satisfaction Loyalty 0.389 0.393 0.085 4.570 0.00000600 Significant
Table 4. R-Square
Variable R-square
Favourability of Brand Assoaciation - Strength of Brand Assoaciation - Uniqueness of Brand Assoaciation -
Satisfaction 0.258
Loyalty 0.439
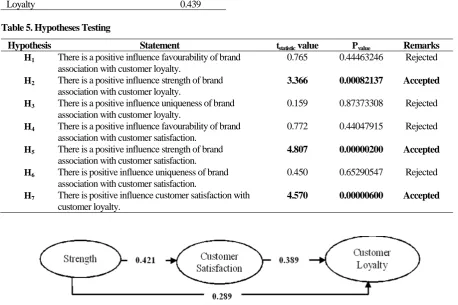
Table 5. Hypotheses Testing
Hypothesis Statement tstatistic value Pvalue Remarks
H1 There is a positive influence favourability of brand association with customer loyalty.
0.765 0.44463246 Rejected
H2 There is a positive influence strength of brand association with customer loyalty.
3.366 0.00082137 Accepted
H3 There is a positive influence uniqueness of brand association with customer loyalty.
0.159 0.87373308 Rejected
H4 There is a positive influence favourability of brand association with customer satisfaction.
0.772 0.44047915 Rejected
H5 There is a positive influence strength of brand association with customer satisfaction.
4.807 0.00000200 Accepted
H6 There is positive influence uniqueness of brand association with customer satisfaction.
0.450 0.65290547 Rejected
H7 There is positive influence customer satisfaction with customer loyalty.
4.570 0.00000600 Accepted
the brand to its customers properly by offering special breakfast menu and Big Mac burger. Nevertheless, the uniqueness of brand association has not been able to give an effect to customer loyalty.
Favorability of brand association appears to have no significant influence on customer satisfaction. Thus, hypothesis of H4 can not be accepted. As previously explained that customer perception of the-se elements has been very good, but they do not satisfy the customers.
The strength of brand association has a signifi-cant positive influence on customer satisfaction. Thus, hypothesis of H5 can be accepted. McDonald’s pro -duct appearance has been able to satisfy its customers, and this is in line with Davies et al. (2003) who says that there strong brand image will make customer satisfied (in Vinhas & Faridah, 2008).
Uniqueness of brand association has no signi-ficant influence on customer satisfaction as illustrated in the table 3. The indicators of uniqueness of brand association show no significant effect on customer loyalty, and also have no effect on customer satisfac-tion. Thus, hypothesis of H6 cannot be accepted.
McDonald’s special products like breakfast menu and
Big Mac haven’t been able to satisfy its customers.
As customer satisfaction has a positive effect on customer loyalty, the hypothesis of H7 can be accepted. McDonald’s customers who are loyal will tend to repurchase, recommend the product to others by words of mouth and loyal to its brand. This is consistent with Mittal & Kamakura (2001) which state that there is a positive relationship between customer satisfaction with customer loyalty (in Rita
et al., 2008).
From hypothesis testing, it can be
obtained the results as follows (Figure 4).
Table 3 shows that there is a positive significant influence from strength of brand association on cus-tomer loyalty by 0.00082137. In addition, there are indirect significant influence on the strength of brand association on customer satisfaction by 0.0000020, and customer satisfaction on customer loyalty by 0.000006. Thus, the influence of the total strength of brand association on customer loyalty can be
deter-With customer satisfaction as a mediating varia-ble between the strength of brand association and cus-tomer loyalty, it can been seen that the strength of brand association has a positive effect on customer loyalty by 0.164.
CONCLUSIONS AND RECOMMENDATIONS
Among seven hypotheses, only three of them are accepted. They are H2 (There is a positive influence strength of brand association with customer loyalty),
H5 (There is a positive influence strength of brand association with customer satisfaction.) and H7 (There is positive influence customer satisfaction with customer loyalty).
Whereas the other four are rejected, which are:
H1 (There is a positive influence favourability of brand association with customer loyalty), H3 (There is a positive influence uniqueness of brand association with customer loyalty), H4 (There is a positive influ-ence favourability of brand association with customer satisfaction), and H6 (There is positive influence uniqueness of brand association with customer satis-faction)
The impact of McDonald’s brand image to its
customer loyalty with customer satisfaction as a mediator is only 58.4%. The rest of 41.6% is influenced by other factors which are not studied in this research.
Recommendations
1. McDonald’s should pay more attention to
cus-tomers’ perceived value as they would like to get
affordable price, fast service for the product they
buy. To attract more customers, McDonald’s can
promote its new product by offering some gifts. 2. As the strength of brand association influence
more on customer satisfaction, it is recommended
for McDonald’s to offer more product packages at
affordable and economical prices.
3. From the research, the majority of customers are
young people aged 17−25 years. It is advisable to
add more product variations, like salads and healthy sandwich to attract older people who become aware of consuming healthy food. 4. For further research, it is recommended to be more
critical in selecting factors that might affect cus-tomer satisfaction and loyalty as the research could only contribute 58,4%. Different sampling techniques might be used to emphasize its
Davies, G., Chun, R., daSilva, R., & Roper, S. 2003.
Grewal, D. & Levy. M. 2010. Marketing. Second Edition. New York: McGraw-Hill.
Hatane, S. 2006. Respon Lingkungan Berbelanja Sebagai Stimulus Pembelian Tidak Terencana pada Toko Serba Ada (Toserba) (Studi Kasus Carefour Surabaya). Jurnal Manajemen dan Kewirausahaan,7(2): 152−170.
_________. 2011. Metode Analisis Kuantitatif Multi-variate Dengan PLS. Paper was presented at the meeting of Universitas Pelita Harapan, Su-rabaya.
Jacob, C. & Nicholas, J. 2009. Operation Manage-ment for Competitive Advantage. Tenth Edition. New York: MacGraw-Hill.
Keller, K. L. 2003. Strategic Brand Management: Building Measuring, and Imagine Brand Equity.
New Jersey: Upper Saddle River.
__________. 2009. Strategic Brand Management: Building, Measuring, and Managing Brand Equity. Third Edition. New Delhi: Pearson Edu-cation India.
Kim, G. & Kim, H. 2004. Measuring Customer Based Restaurant Brand Equity: Investigating The Relationship Between Brand Equity and
Firm’s Performance. Journal Cornell Hotel & Restaurant Administration Quarterly, 45(2):
115−131.
Kotler, P. 2005. Manajemen Pemasaran 1. Edisi Kesebelas. Jakarta: PT Prenhallindo.
Martinez, E. 2002. The Effect of Brand Extension
Strategies upon Brand Image. Zaragoza:
Fa-culted de Ciencias Economicas Empresariales The University of Zaragoza Press.
Miller, J. & Muir, D. 2004. The Business of Brands. West Sussex: Chichester.
Mittal, V. & Kamakura, W. A. 2001. Satisfaction, Repurchase Intent, and Repurchase Behavior:
Investigating the Moderating Effect of Customer Characteristics. Journal of Marketing Research, 38(February): 131–142.
Randal, G. 2001. The Art of Marketing (A Practical Guide To Planning Your Strategy). New Delhi: Crest Publishing House.
Rita, F., Kurt, M., & Fuller, J. 2008. The Impact of Satisfaction and Image on Loyalty: The Case of Alpine Ski Resorts. Journal Managing Service Quality, 18(2): 163−178.
Sari, E. T. 2005. Peranan Customer Value dalam Mempertahankan Keunggulan Bersaing pada Restoran Siap Saji. Jurnal Manajemen Perho-telan, 2( 2): 68−75.
Sarwono, J. & Martodiredjo, T. 2008. Riset Bisnis untuk Pengambilan Keputusan. Yogyakarta: Penerbit Andi.
Sondoh, S. L., Omar, M. W., Wahid, N. A., Ismail, I., & Haru, A. 2007. The Effect of Brand Image on Overall Satisfaction and Loyalty Intention in the Context of Color Cosmetic. Journal Asian Academy of Management, 12(1): 83−107.
Tangkudung, A. 2002. Berbagi Ilmu dengan Peda-gangTradisional, (http://www.sinarharapan.co. id/berita.html, retrieved Oktober 12, 2011). Vinhas, D. S. R. & Faridah, S. A. S. 2008. Online
Corporate Brand Image, Satisfaction, and Loyalty. Journal of Brand Management, 16
(3): 119−144.
Wijaya, S. 2005. Studi Eksploratif Perilaku Maha-siswa UK. PETRA dalam Memilih Fast Food Restaurant dan Non−fast Food Restaurant di Surabaya. Jurnal Manajemen Perhotelan, 1