Roto Roto
et al.* Corresponding author. Tel : +62-81578536263
Email address : [email protected] DOI: 10.22146/ijc.22695
Investigation on the Effect of Addition of Fe
3+Ion into the Colloidal AgNPs
in PVA Solution and Understanding Its Reaction Mechanism
Roto Roto
*, Marcelina, Nurul Hidayat Aprilita, Mudasir, Taufik Abdillah Natsir, and Bella Mellisani
Department of Chemistry, Faculty of Mathematics and Natural Sciences, Universitas Gadjah Mada, Sekip Utara, Yogyakarta 55281, Indonesia
Received March 2, 2017; Accepted August 23, 2017
ABSTRACT
Analysis of Fe3+ ion present in aqueous solutions is always of interests. Recently, this ion has been analyzed
by colorimetric methods using colloid of silver nanoparticles (AgNPs) in capping agents of polymers. The reaction
mechanism between AgNPs and Fe3+ is still subject to the further investigation. In this work, 1,10-phenanthroline
was used to probe the reaction mechanism between AgNPs and Fe3+ ion in the solution. The colloids of AgNPs were
prepared in the polyvinyl alcohol (PVA) solution and reacted with Fe3+. The colloid surface plasmon absorbance
decreases linearly along with the increase in Fe3+ concentration. The addition of 1,10-phenanthroline to mixture
changes the solution to red, indicating that the reaction produces Fe2+. It suggests that the reduction of the AgNPs
absorbance is the result of oxidation of the Ag nanoparticles along with the reduction of Fe3+.
Keywords: AgNPs; Fe3+ sensor; colorimetry; 1,10-phenanthroline; SPR absorbance
ABSTRAK
Analisis ion Fe3+ yang ada dalam larutan berair selalu diminati para peneliti. Baru-baru ini, ion tersebut telah
dianalisis dengan metode kolorimetri menggunakan koloid perak nanopartikel (AgNP) dalam agen penstabil polimer.
Namun, mekanisme reaksi antara AgNPs dan Fe3+ masih harus diselidiki lebih lanjut. Pada penelitian ini
1,10-fenantrolin digunakan untuk menyelidiki mekanisme reaksi antara ion AgNP dan Fe3+ dalam larutan. Koloid AgNP
disiapkan dalam larutan polivinil alkohol (PVA) dan direaksikan dengan Fe3+. Fluks koloid menurun secara linear
seiring dengan peningkatan konsentrasi Fe3+. Penambahan 1,10-fenantrolin ke campuran mengubah larutan
menjadi merah, menunjukkan bahwa reaksinya menghasilkan Fe3+. Hal ini menunjukkan bahwa penurunan
absorbansi AgNPs adalah hasil oksidasi nanopartikel Ag bersamaan dengan pengurangan Fe3+.
Kata Kunci: nanopartikel Ag; sensor Fe3+; kolorimetri; 1,10-fenantrolin; SPR
INTRODUCTION
Colorimetric chemical analysis based on localized surface plasmon resonance (LSPR) is of interests for many researchers. The optical LSPR phenomenon is generated when monochromatic light interacts with conductive nanoparticles that have size smaller than the incident wavelength [1]. This oscillation results in unusually strong scattering and absorption properties. The methods based on LSPR assisted by nanoparticles have been studied by many researchers mainly due to good sensitivity and selectivity. They offer sensitive detection of ions, organic compounds and volatile organic compounds. In the past few years, we saw works on the use of nanoparticles in chemical sensing either in solutions or in gaseous phases [2]. There is growing interest in applying the optical properties of AgNPs. AgNPs are capable of both absorbing and scattering the incident light.
In detection Hg2+, the decrease in the LSPR
absorbance is believed to be due to the redox reaction between AgNPs and Hg2+. Meanwhile, the addition of
calixarene to the Fe3+ solution will produce a complex
with Fe3+ leading to nanoparticle-based fluorometric
method of the cation. The N-acetyl-L-cysteine-stabilized silver nanoparticles have also been used for Fe3+ [3]. Starch-stabilized AgNPs were used for a
colorimetric method for detection of Hg2+ [4].
Pyridyl-appended calix-[4]-arene has been used to change AgNPs that show a high selectivity for sensing of Fe3+
[5]. Dithizone functionalized CdSe/CdS quantum dots can be used as turn-on fluorescent probe for ultrasensitive detection of Pb2+ ion [6]. The detection
limit for such methods is lower than that of the other common methods. The sensitivity and selectivity of this sensing method can also be tuned by using the co-stabilizing agent of organic compounds [7].
Roto Roto
et al.reaction mechanism that leads to the changes in its UV-Vis absorbance or fluorescence still needs further explanation. Henglein et al. suggest that adsorbed Cd2+
on AgNPs can be reduced Cd+ in the presence of
1-hydroxyethylmethyl radicals [8]. Fan et al. and Farhadi et al. have suggested that decrease in absorbance of the colloidal AgNPs is due to the reduction-oxidation of AgNPs and Hg2+ ions [4,9].
In this contribution, we report on the use to understand the reaction between Fe3+ ions and AgNPs
in the PVA solution that results in the decrease in the peak of UV-Vis spectra. The ligand reacts with the Fe2+,
the product of the reaction, to form red complex solution for lowering the colloidal UV-Vis absorbance in more details.
EXPERIMENTAL SECTION
Materials
Polyvinyl alcohol (PVA), silver nitrate, ascorbic acid, 1,10-phenanthroline, iron(III) nitrate, and other salts (with metal ions of Cd2+, Mn2+, Zn2+, Cr3+, Mg2+, Ni2+,
Ca2+, Pb2+, Cu2+, Co2+, and Fe3+ used in this work) were
supplied by Merck and used as received. Doubly distilled water was used as the main solvent.
Instrumentation
The UV-1700 Shimadzu UV-Vis spectrometer was used for UV-Vis spectra data acquisition. The TEM images of the samples were recorded on a JEOL JEM 1400 using accelerating voltage of 120 kV. The Rigaku Mini Flex-600 XRD was used for crystal structure determination of the AgNPs. All experiments were carried out at room temperature without humidity control.
Procedure
Synthesis and characterization colloid of AgNPs Synthesis of colloidal AgNPs in PVA media using ascorbic acid as reducing agent can be found elsewhere [10]. Typically in this work, a 200 mg/L AgNO3 solution in
doubly distilled water was made. A 1.0% PVA solution was prepared by dissolving the PVA powder in double distilled water. The PVA solution was stirred for 1 h while being heated at 80 °C. The AgNO3 solution in PVA was
made by mixing the same volume of the two solutions. The mixture was heated to 80 °C and added 1 h of stirring. The colloid of AgNPs in PVA was prepared by reacting with ascorbic acid solution. The molar ratio of ascorbic acid to silver ion was kept at 2:1. The ascorbic acid solution was added dropwise as the mixture was kept at 90 °C on a hot plate magnetic stirrer. The colloid was formed after 1 h of heating. The formed colloidal
AgNPs were characterized using UV-Vis spectrophotometer, XRD and TEM. A series of colloidal AgNPs with starting concentration from 50 to 200 mg/L were prepared. For the UV-Vis measurement, the AgNP concentration was adjusted to 5,000 µg/L (5 mg/L).
UV-Vis spectra of colloid of AgNPs in the presence of another cation
The colloid was diluted to meet the suitable range of the UV-Vis absorbance. First, the UV-Vis spectra of 5,000 µg/L colloids of AgNPs were recorded. Second, a series of colloids of AgNPs were made where certain cation was added with a concentration of 10,000 µg/L each. The spectra of the colloids were recorded and compared with the blank.
UV-Vis spectra colloid of AgNPs in the presence of Fe3+
The UV-Vis spectrum of a colloid of AgNPs before addition of Fe3+ was recorded. In a separate
experiment, the solution of Fe3+ was added to the
colloid to give its final concentration starting from 10 µg/L to 5,000 µg/L. The UV-Vis spectra were recorded and compared with the blank.
Effect of addition of 1,10-phenanthroline on the UV-Vis spectra of AgNPs and Fe3+ mixture
Colloids of AgNPs having the concentration of 5,000 µg/L were prepared in a series of 50 mL volumetric flasks. A solution of Fe3+ was added and
shook well to make final colloid of AgNPs concentration of 5,000 µg/L. The solution of 1,10-phenanthroline was added to the mixture at a concentration of 10,000 µg/L. The UV-Vis absorbance for the colloid was recorded before addition of Fe3+, after addition of Fe3+, and after
addition of Fe3+ and 1,10-phenanthroline.
RESULT AND DISCUSSION
Roto Roto
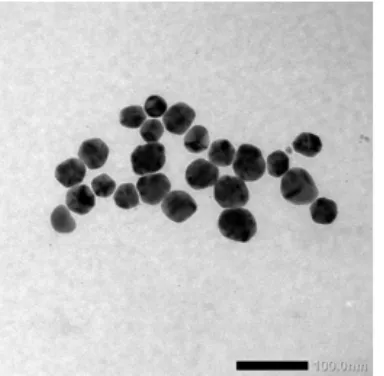
et al.Fig 1. TEM image of AgNPs produced by reduction of AgNO3 with ascorbic acid in PVA solution
Fig 2. XRD pattern of AgNPs obtained by reduction of AgNO3 with ascorbic acid in the PVA solution
Fig 3. Combined UV-Vis spectra of the colloidal AgNPs after addition of various ions; (a) initial, in the presence of (b) Cd2+,(c) Mn2+, (d) Zn2+, (e) Cr3+, (f) Mg2+, (g) Ni2+, (h) Ca2+, (i) Pb2+, (j) Cu2+, (k) Co2+, and (l) Fe3+. The photographs
of change in color of the colloids are also shown
Reduction by hydrogen gas in organic media gave the size of AgNPs as low as 14 nm [12].
Fig. 1 shows TEM image of the AgNPs produced in this work. The shape of the nanoparticles is almost spherical. The size, however, is not uniform. The estimated average diameter of the AgNPs is about 26-50 nm. The colloids of AgNPs with particle size around 30 nm have an SPR absorbance peak of about 420 nm.
This colloid of AgNPs has very similar UV-Vis spectra to the data reported earlier. It is known that the smaller size nanoparticles will have a spherical shape.
180 K d
FWHM cos
⋅ ⋅ λ =
Roto Roto
et al.Fig 4. Decrease in the UV-Vis peak absorbance at 421 nm of the colloidal AgNPs after addition of
predetermined ions at a concentration of 10,000 µg/L Fig 5. UV-Vis spectra of colloidal AgNPs after addition of Fe3+ with concentration from 10-5,000 µg/L
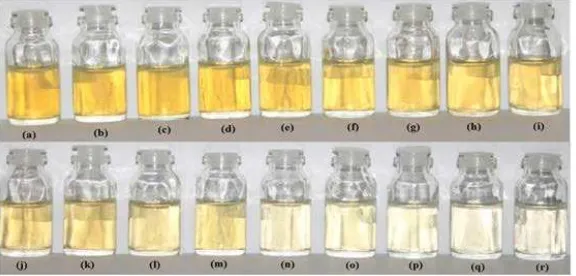
Fig 6. Images of the colloidal AgNPs, (a) initial, and after addition of the Fe3+ ion with concentration of (b) 10, (c) 30,
(d) 50, (e) 70, (f) 100, (g) 300, (h) 500, (i) 700, (j) 1,000, (k) 1,500, (l) 2,000, (m) 2,500, (n) 3,000, (o) 3,500, (p) 4,000, (q) 4,500, and (r) 5,000 µg/L
fcc crystal system commonly has the unit cell of 4.0860 Å. This is comparable with other reported works [15]. The XRD data were used to estimate the average particle size of the particles. The average particle size calculated using Debye-Scherrer equation (1) was found to be 23.25 nm. In the equation d = average particle size in nanometer, K is constant (0.9), l is the wavelength of X-ray in nanometer, FWHM is full width at half maxima (2θ) and θ is the Bragg angle in degree [14]. The calculated value is usually lower than the actual value obtained by electron microscopic imaging systems of either by SEM or TEM.
The collated LSPR UV-Vis spectra of 5,000 µg/L colloidal AgNPs upon addition of ions i.e. Cd2+, Mn2+,
Zn2+, Cr3+, Mg2+, Ni2+, Ca2+, Pb2+, Cu2+, Co2+, and Fe3+
are presented in Fig. 3. The addition of cations with similar concentration causes the absorbance to decrease. A large decrease in UV-Vis peak absorbance at 421 nm was observed when Fe3+ was added i.e., from
0.425 to 0.035. The drops in absorbance upon addition
of other cations were around 0.060 to 0.125, which is relatively small. Overall decreases in UV-Vis absorbance peak (ΔA) at 421 nm of the colloidal AgNPs are presented in Fig. 4. Drop in UV-Vis absorbance of AgNPs was also observed in the Fe3+ in
the presence of a capping agent of N-acetyl-L-cysteine [3].
The combined UV-Vis spectra of colloidal AgNPs after addition of the Fe3+ ions with various
concentrations (10-5,000 µg/L) are presented in Fig. 5. The peak absorbance at 421 nm continues to decrease along with the increase in concentrations. The UV-Vis peak absorbance shifted to lower wavelength when a high concentration of ions was added. Other work shows that the linear range for detection of Fe3+
Roto Roto
et al.Fig 7. Calibration curve of colorimetric Fe3+ analysis in
the concentration range of 10-5,000 µg/L
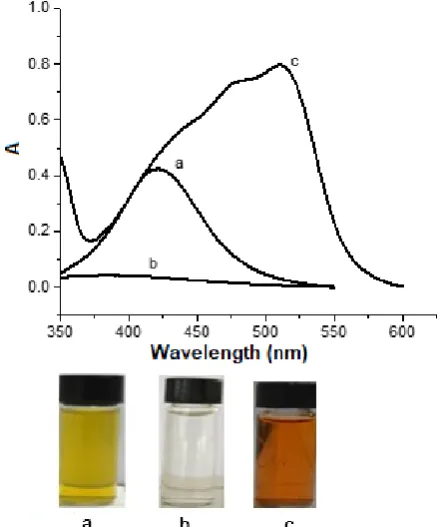
Fig 8. UV-Vis spectra of 5,000 µg/L colloidal AgNPs, (a) in the absence of Fe3+, (b) in the presence of 5 µg/L
Fe3+, (c) in the presence of 5 µg/L Fe3+ and 10,000 µg/L
of 1,10-phenanthroline. The progress of the solution color change is included
The calibration curve for Fe3+ detection using
AgNPs is presented in Fig. 7. The plot of Fe3+
concentration versus absorbance gives a linear line in the concentration range from 50 to 5,000 µg/L. The estimated limit of detection and limit of quantification for
Fe3+ obtained from the calibration curve are about 20
µg/L and 60 µg/L, respectively. The correlation coefficient for the plot is 0.9905.
Fig. 8 shows the UV-Vis spectra of 5,000 µg/L colloidal AgNPs before and after addition of Fe3+, after
addition 5,000 µg/L Fe3+ and 0.10 mM
1,10-phenanthroline. The peak at 510 nm corresponds to the tris(1,10-phenanthroline)iron(II) complex [16]. The absorbance of the colloidal Ag nanoparticle decreased when Fe3+ was added. Addition much higher
concentration of Fe3+ to the colloid causes a further
decrease in the peak absorbance at 421 nm. When 1,10-phenanthroline was added to the mixture, the peak absorbance of at about 510 nm was observed. The spectrum of tris(1,10-phenanthroline)iron(II) complex is very obvious to support the redox mechanism.
It was reported earlier that the colorimetric sensing of Hg2+ using AgNPs prepared by green
synthesis was due to the change in the surface plasmon absorbance of the colloidal AgNPs [9]. Similarly, the increase in the concentration of the analytes causes the absorbance of the Ag nanoparticle to decrease. The limit of detection (LOD) is usually further evaluated based on accepted standard methods [16]. The LOD for Hg2+ ion was 2.2 × 10⁻⁶ mol L−1,
which was considered good. Moreover, the linear reduction in the surface plasmon absorbance upon addition of Hg2+ ion was speculated to be due to the
redox reaction between AgNPs and the Hg2+ ions.
Studies have been performed to have a clear mechanism not only for this sensing method but also other similar methods. The limit of detection (LOD) and limit of quantification (LOQ) are estimated using equation (2) and (3).
In this work, we propose to rationale the mechanism of the lowering surface plasmon absorbance of the AgNPs upon addition of the ions. The decrease in the UV-Vis spectra is believed to be due to the redox reaction between AgNPs and Fe3+ ion.
The AgNPs react with Fe3+ ion to produce Ag+ and Fe2+
ions. In this case, the AgNPs are oxidized to Ag+ and
Fe3+ ions are reduced to Fe2+. The reaction mechanism
is obvious when phenanthroline is added. 1,10-phenanthroline reacts with Fe2+ to produce
tris(1,10-phenanthroline)iron(II) complex, which has red color. The reactions can be proposed by reaction (4) and (5). Ag(s) + Fe3+(aq) Ag+(aq) + Fe2+(aq) (4)
Fe2+(aq) + 3 phen(aq) (phen)3Fe(II)(aq) (5)
Roto Roto
et al.tested that the increase in the Fe3+ concentration caused
the peak absorbance at 510 nm to rise. In other words, the tris(1,10-phenanthroline) iron(II) UV-Vis peak absorbance is dependent on the concentration of Fe3+.
This further indicates that the reaction between AgNPs and Fe3+ is stoichiometric. Therefore, it is clear that
redox reaction between AgNPs and Fe3+ ions takes
place. The light extinction by AgNPs is dependent on the Fe3+concentration.
The Fe3+ ions are reduced to Fe2+, causing a linear
decrease in SPR absorbance, which is dependent on Fe3+ concentration [3]. We show in this work that the
redox reaction between AgNPs and Fe3+ can be
detected spectrophotometrically by using 1,10-phenanthroline as a ligand, which forms a complex ion with Fe2+. The color change is obvious from initially red
to colorless. Addition of 1,10-phenanthroline to the colloid causes the color to change to red (Fig. 8, bottom).
Gao et al. believe that the colorimetric detection of Fe3+ based on the sensitive plasmonic response of
n-acetyl-L-cysteine-stabilized silver nanoparticles (NALC– Ag NPs) is due to the redox reaction between AgNPs with the Fe3+ ions in the solution [3]. The intensity
decrease of the prepared NALC–Ag NPs can be attributed to the reduction of Ag NPs in the solution but not to the particle size change. When Fe3+ ions are
added into the colloidal NALC–Ag NPs, the Ag NPs can be oxidized by Fe3+ ions to produce Ag+.
CONCLUSION
Colloids of AgNPs in the stabilizing agent of PVA can detect Fe3+ ions. The limit of detection of Fe3+ ion
analysis using this colorimetric method is estimated to be 20 µg/L (equivalent to 0.36 µmol/L). The Fe3+ ions
react with AgNPs to yield Fe2+ and Ag+ ions. The
reaction mechanism was confirmed by addition of 1,10-phenanthroline, which formed a red complex ions of Fe(II)-1,10-phenanthroline. The color change of AgNPs is due to the redox reaction with Fe3+ ions. The reaction
mechanism of aqueous ions and colloids of nanoparticles may be of importance in the future analysis based on the colorimetric methods.
ACKNOWLEDGEMENT
We thank the Directorate General of Higher Education, Ministry of Research, Technology and Higher Education of Indonesia through 2015 and 2016
Penelitian Unggulan Perguruan Tinggi (PUPT) research
grants. We are also indebted to the Department of Chemistry Universitas Gadjah Mada for providing research facilities including XRD and TEM machines.
REFERENCES
[1] Petryayeva, E., and Krull, U.J., 2011, Localized surface plasmon resonance: Nanostructures, bioassays and biosensing-A review, Anal. Chim. Acta, 706 (1), 8–24.
[2] Tung, T.T., Castro, M., Kim, T.Y., Suh, K.S., and Feller, J.F., 2014, High stability silver nanoparticles–graphene/poly(ionic liquid)-based chemoresistive sensors for volatile organic compounds’ detection, Anal. Bioanal. Chem., 406 (16), 3995–4004.
[3] Gao, X., Lu, Y., He, S., Li, X., and Chen, W., 2015, Colorimetric detection of iron ions (III) based on the highly sensitive plasmonic response of the N-acetyl-l-cysteine-stabilized silver nanoparticles,
Anal. Chim. Acta, 879, 118–125.
[4] Fan, Y., Liu, Z., Wang, L., and Zhan, J., 2009, Synthesis of starch-stabilized Ag nanoparticles and Hg2+ recognition in aqueous media,
Nanoscale Res. Lett., 4 (10), 1230–1235.
[5] Zhan, J., Wen, L., Miao, F., Tian, D., Zhu, X., and Li, H., 2012, Synthesis of a pyridyl-appended calix[4]arene and its application to the modification of silver nanoparticles as an Fe3+ colorimetric
sensor, New J. Chem., 36, 656–661.
[6] Zhao, Q., Rong, X., Ma, H., and Tao, G., 2013, Dithizone functionalized CdSe/CdS quantum dots as turn-on fluorescent probe for ultrasensitive detection of lead ion, J. Hazard. Mater., 250-251, 45–52.
[7] Kumar, V.V., and Anthony, S.P., 2014, Silver nanoparticles based selective colorimetric sensor for Cd2+, Hg2+ and Pb2+ ions: Tuning sensitivity and
selectivity using co-stabilizing agents, Sens.
Actuators, B, 191, 31–36.
[8] Henglein, A., Mulvaney, P., Linnert, T., and Holzwarth, A., 1992, Surface chemistry of colloidal silver: Reduction of adsorbed Cd2+ ions and
accompanying optical effects, J. Phys. Chem., 96 (6), 2411–2414.
[9] Farhadi, K., Forough, M., Molaei, R., Hajizadeh, S., and Rafipour, A., 2012, Highly selective Hg2+
colorimetric sensor using green synthesized and unmodified silver nanoparticles, Sens. Actuators, B, 161 (1), 880–885.
[10] Balan, L., Malval, J.P., Schneider, R., and Burget, D., 2007, Silver nanoparticles: New synthesis, characterization and photophysical properties,
Mater. Chem. Phys., 104 (2-3), 417–421.
Roto Roto
et al.hydrogen peroxide, Colloids Surf., A, 382 (1-3), 203–210.
[12] Ramírez-Meneses, E., Montiel-Palma, V., Domínguez-Crespo, M.A., Izaguirre-López, M.G., Palacios-Gonzalez, E., and Dorantes-Rosales, H., 2015, Shape-and size-controlled Ag nanoparticles stabilized by in situ generated secondary amines, J.
Alloys Compd., 643 (Suppl. 1), S51–S61.
[13] Gong, J., Liu, H., Jiang, Y., Yang, S., Liao, X., Liu, Z., and Ringer, S., 2015, In-situ synthesis of Ag nanoparticles by electron beam irradiation, Mater. Charact., 110, 1–4.
[14] Emam, H.E., El-Zawahry, M.M., and Ahmed, H.B., 2017, One-pot fabrication of AgNPs, AuNPs and Ag-Au nano-alloy using cellulosic solid support for catalytic reduction application, Carbohydr. Polym., 166, 1–13.
[15] Mandal, H.K., Kundu, A., Balti, S., and Mahapatra, A., 2012, Kinetic investigation on the oxidation of tris(1,10-phenanthroline)iron(II) by oxone: The effect of BSA-SDS interaction, J. Colloid Interface Sci., 378 (1), 110–117.
[16] Uhrovčík, J., 2014, Strategy for determination of LOD and LOQ values - Some basic aspects,