INFORMATION EXTRACTION AND CHANGE ANALYSIS OF MAJOR LAKES IN
TIBETAN PLATEAU BASED ON LANDSAT REMOTE SENSING IMAGES
Y. J. Li, G. Qiao*
College of Surveying and Geo-informatics, Tongji University, 1239 Siping Road, Shanghai, 200092, China [email protected], [email protected]
Commission III, WG III/9
KEY WORDS: Remote sensing, Lake Extraction, Long Temporal Analysis, Tibetan Plateau, Landsat Images
ABSTRACT:
The water resources of Tibetan plateau, particularly the lakes, has been influenced by global climate change and also reacted to global change. It is important to study the lake changes in the Tibetan plateau. This paper aimed to analyse the changes detected from remote sensing images for the typical lakes in Tibetan Plateau, including Qinghai Lake, Nam Co and Selin Co, using different information extraction methods, such as the single-band threshold method, NDWI, MNDWI, MSCT, MLC, SVM and object-oriented classification method. Results show that object-object-oriented classification method is better at removing ice, snow, cloud and mountain shadow, while the NDWI and MNDWI generated the worst results for lake extraction. After that, the lake's long temporal changes for Qinghai Lake, Nam Co and Selin Co derived from 12 images in different periods have been analysed using GIS technology. Results show that between 1985 and 2015, Qinghai Lake has expanded after a steady expansion; Nam Co was in the state about stable to expansion to stable. The area increased by 70.03 km2, a growth rate of 2.33 km2 a-1 and had a small change in area; Selin Co expanded after a stable state, and the area is always growing, and Selin Co's growth rate is larger than Qinghai Lake and Nam Co at the same time.
* Corresponding author
1. INTRODUCTION
Lakes and rivers are part of the land water circle, one of the indispensable places for human survival, and the effects of climate change, environment change, and ecosystem stability are important. The response to global change is sensitive. The Tibetan Plateau which known as the third pole of the world, densely populated by many lakes, and it is the source of many rivers such as Yangtze River and the Yellow River. The lakes are one of the key components of the Qinghai-Tibet Plateau's water resources, driving further development of the region and the global biochemistry process. 53.2% of China's lakes are located in the Tibetan Plateau, so it is called the 'water tower' of the world. For regional response to the Qinghai-Tibet plateau, global climate change affects the water resources of the Tibetan Plateau, particularly the lakes, and vice verse. The study of lakes in the Tibetan Plateau is a very important task.
In the early days, lake investigates in Tibetan Plateau were primary based on field surveys, and later remote sensing technology became a powerful tool for lake monitoring since 1970s. Frazier and Page (2000) combines colour aerial photography with the use of TM 5 radio spectrum to extract the water. Xi et al. (2009) uses the radio spectrum of (CH2+ CH3) - (CH4+ CH5) > T1 (T1 is the threshold value) to determine the shadow between TM data. McFeeters (1996) extracted the water information from Normalized Difference Water Index (NDWI) in 1996, which inhibited the effects of background landscapes such as vegetation. Xu (2006) proposed Modified Normalized Difference Water Index (MNDWI) to extract water information, which further inhibited the interference of soil and other background objects. Kingsford and Wales (1997) used the maximum likelihood supervision system to extract the wetland
from Landsat MSS data. In recent years, there have been many studies of lakes in the Qinghai-Tibet Plateau. For example, Lu et al. (2016) proposed a new lake extraction method based on the MODIS data, provided the practical basis of 2000 to 2012, nearly 10 years of the Qinghai-Tibet Plateau lakes change data. Zhao et al. (2016) studied the changes of the lake in the parched valley in 1991 to 2014 based on the Landsat remote sensing image and high-altitude data ICESat/GLAS and Cryosat-2. Yan et al. (2016) studied the dynamic development of lakes in the Qinghai-Tibet Plateau nearly 40 years ago, and analysed the correlation between this change and climate based on the Landsat remote sensing image. Dong et al. (2014) used Landsat data, the lake of Qinghai-Tibet Plateau, which was more than 10 km2 between 1970 and 2010 were obtained, and they also analysed the trend and change characteristics of the plateau in the last 40 years. Li et al. (2011) used the Landsat data to capture a lake in the middle of the Qinghai-Tibet Plateau. In this case, the changes are analysed, and the resulting lake charts are suited well for a long-range lake migration monitoring.
This paper aims to test different lake extraction methods from remote sensing satellite images in Tibetan Plateau to support research on lake changes. Besides, the evolution of long-term sequences of major lakes in the Tibetan Plateau is also analysed, which is benefical for sustainable development of the water resources of China's southwest mountain regions.
2. RESEARCH AREA AND DATA PROCESSING
2.1 Research Area
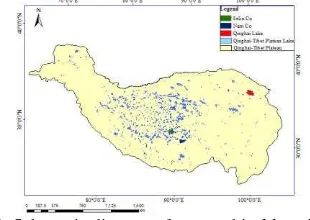
system spans 26 ° N~ 39 ° N and 73 ° E ~ 104 ° E, with an area of about 2500,000 km2, with a total area of 2400,000 km2 in China. The origins of many rivers in Asia can trace back to it. This article focuses on Qinghai Lake, Nam Co and Selin Co.
Figure 1. Schematic diagram of geographical location of the Qinghai-Tibet Plateau
2.1.1 Qinghai Lake: Qinghai lake is located in the Qinghai lake basin. The latitude and longitude span is 36 ° 32 'N ~ 37 ° 15'N, 99 ° 36 'E~ 100 ° 47'E, the area is 4456 km2, and the circumference is about 360 km, about 19 m average water depth, altitude 3260 m, it is the largest inland lake and salt water lake in China.
Figure 2. Geographical location of Qinghai lake
2.1.2 Nam Co: Nam Co's latitude and longitude span is 30°30′N ~ 30°35′N,90°16′E ~ 91°03′E, located in the middle of the Tibetan Plateau. The lake is high and its altitude is 4718 m. Nam Co is the third-largest inland salt lake in the Tibet, and the third-largest inland salt lake in the world.
Figure 3. Geographical location of Nam Co
2.1.3 Selin Co: Selin Co 's latitude and longitude span is 31 ° 34 ′ N~ 31 ° 57 ′ N,88 °33 ′ E~ 89 ° 21 ′ E, and the lake's altitude is about 4530 m. The area is about 2,391 km2. It is the second largest salt lake of China and the number one lake in Tibet.
Figure 4. Geographical location of Selin Co
2.2 Data
The remote sensing data used in this article are derived from the landsat-5 TM data, landsat-7 ETM+ data and landsat-8 OLI remote sensing data. In this study, we selected a series of data covering the study area and the years of 1985, 1995, 2005 and 2015, including TM, ETM + and OLI, total 12 images. The Cloud cover of the selected images are extremely rare and high in quality. According to the existing study, Remote sensing images used to select data from September to December, and the data is the best in October and November (Li Junli, 2011a).
2.3 Pre-treatment of Remote Sensing Image
Pre-processing the image can reduce or even eliminate the distortion caused by various errors. In this paper, the pre-treatment steps include radiation correction, band fusion, image cut, strip repair and image mosaic.
2.3.1 Radiation Correction: Radiation calibration is mainly include system radiation calibration and atmospheric calibration (Liu Xiaozhao, 2008a). After this treatment, the brightness of the image has improved, the image is much more visible, and the impact of the atmosphere is almost negligible, making it easier for subsequent lakes extraction processing operations.
2.3.2 Band Fusion: The band of this article combines the TM, ETM+ and OLI's 1, 2, 3, 4, 5, and 7. It reduces snow, ice, and mountain shadows, and can easily display colour composite images in the process of research.
2.3.3 Image Cut: The data after cut increases the speed of the data processing, and removes the effects of the redundant data. There is a clear impact on the accuracy and precision of subsequent lakes extraction.
2.3.4 Image Mosaic: In the study area of this article, Qinghai Lake, due to the remote sensing images obtained in 2005,1995 and 1986, it is located in the two rows include 133034 and 133035, so it needs to be pieced together into a complete Qinghai Lake. The complete Qinghai Lake shown in figure 5.
(a) (b) (c) Figure 5. Qinghai Lake image after Mosaic ((a) and (b) before
2.3.5 Strip Repair: In this article, the lack of strip band can be repair the data strips using the ENVI Landsat_Gapfill tool. The result shown in figure 6.
(a) (b)
Figure 6. Before and after the Strip repair ((a) before, (b) after)
3. STUDY ON INFORMATION EXTRACTION METHOD OF WATER BODY OF REMOTE SENSING
IMAGE
The single-band threshold method (ST), Normalized Difference Water Index method (NDWI), Modified NDWI method (MNDWI), multi-band spectral correlation threshold method (MSCT), maximum likelihood supervised classification method (MLC), support vector machine supervised classification method (SVM) and object-oriented classification method (OC) are used to extract lake information and evaluated the method's results based on the Nam Co's 2005 landsat-7 data.
The implementation of the OC method consists of two steps, the first step is to split the separation, and the second step is to create the perfect classification for the area, and ultimately to acquire the required location information. This method uses the method to extract lake as shown in figure 7.
Figure 7. OC process
The result of the above method shown in figure 8. The ST method lake extraction result shown in figure 8 (a), the results of NDWI and MNDWI shown in figure 8 (c) and (d), the result of MSCT shown in figure 8 (b), the results of MLC and SVM method shown in figure 8 (e) and (f), and the result of OC method shown in figure 8 (g). Figure 8 (h) is the result from visual interpretation, figure 8 (i) is the original remote sensing image.
(a) (b) (c)
(d) (e) (f)
(g) (h) (i) Figure 8. Results of lake extraction
3.1 Evaluation of Lake Information Extraction Method
This article is based on the ArcGIS software to extract the Nam Co, using the intersect tool to get access to the images of the lake in which it interacts with the result of visual interpretation. The lake extracted from visual interpretation (VI) are standard, lake areas are targets.Table 1 is the detail.
%
100
2 3
A
A
R
(1)
%
100
3 3
1
A
A
A
E
(2)
Where A1= total Area
A2 = the extracted area of visual interpretation A3= the intersect area
R = the lake extraction rate E = the error rate
Figure 9 illustrates the two forms of error. the red rectangle box in (a) represents the parts of the something that are not extracted because of the cloud shading, and the red rectangular frame in the (b), which represents the something of the ice, the mountain shadows, etc. . The R in table 2 reveals the errors caused by the omission, and E directly reveals the errors made in the wrong part of the table. In the process of processing the data, the two errors founded in each view and the impact are big, so can evaluated them as a measure of accuracy.
(a) (b) Figure 9. Two forms of error
and it shown in its image that it is better to avoid the shadows and the effects of ice and snow, so that the error rate was significantly reduced.
method
extract area (km2)
Intersect area (km2)
extract rate R (%)
Error area (km2)
Error rate E(%) ST 2010.01 1993.79 98.14 16.22 0.81 NDWI 2648.49 2028.76 99.86 619.73 30.55 MNDWI 2545.3 2027.16 99.78 518.14 25.56 MSCT 2576.6 2029.28 99.88 547.32 26.97 OC 2105.88 2028.29 99.84 77.59 3.83 SVM 1997.94 1988.34 97.87 9.60 0.48 MLC 1981.35 1972.94 97.11 8.41 0.43 VI 2031.64 2031.64 100.00 0.00 0.00 Table 1 Analysis of the extraction accuracy of different methods
As a result, combined the lake's extraction and shadow impact remove, we identifies the OC method as the ideal for the lake extraction. Thus, for better extraction of the Tibetan Plateau's main lakes and further analysis of the long-term sequence analysis, this article will use the OC method to extract other remote sensing image.
4. ANALYSIS OF LONG TIME SERIES OF MAJOR LAKES IN QINGHAI-TIBET PLATEAU
4.1 Information Extraction of Major Lakes in Qinghai-Tibet Plateau
In Qinghai Lake, the results of 1986, 1995, 2005 and 2015 were summarised in figure 10。
(a) 1986 (b) 1995
(c) 2005 (d) 2015 Figure 10. Extraction results of Qinghai Lake
In Nam Co, the results of 1987, 1995, 2005 and 2015 were summarised in figure 11.
(a) 1987 (b) 1995
(c) 2005 (d) 2015 Figure 11. Extraction results of Nam Co
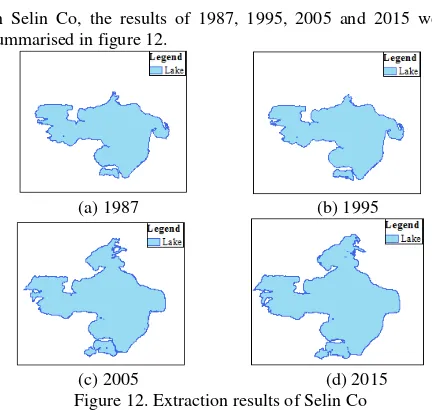
In Selin Co, the results of 1987, 1995, 2005 and 2015 were summarised in figure 12.
(a) 1987 (b) 1995
(c) 2005 (d) 2015 Figure 12. Extraction results of Selin Co
4.2 Long Time Series Analysis of Major Lakes in Tibetan Plateau
The Qinghai Lake, Nam Co and Selin Co, which were selected in this study, are three large lakes in the Qinghai-Tibet plateau, and their long sequence evolution has important research value. At the same time, using the ArcGIS statistical function to calculate the size of the lake in the landscape, the lake is used to quantify the changes in the lake. Meanwhile, the study has found that the lake is relatively stable when area change rate less than 2%, and it is likely that the lake will atrophy and shrink when the area change rate at a rate of more than 2% (Dong Siyang, 2014a).
4.2.1 Lake Range Change Analysis in Qinghai Lake: Based on the range of lakes extracted from Qinghai Lake, the change in Qinghai Lake in 1985-2015 shown in figure 13. The red frame represent the 1986 lake area, the yellow frame represent the 1995 lake area, and the green part represent the lake in 2005, the purple frame is the area of 2015 lake. The amount of lake area data shown in table 2. From 1986 to 1995, Qinghai Lake reduced by 21.45 km2. It reduced by 28.62 km2 in 2005 compared with 1995. In 2005 to 2015, the area expanded by 125.92 km2. It expanded by 87.54 km2 from 1995 to 2015. The growth rate is 4.38 km2a-1. The change in Qinghai Lake in 1995 to 2015 can divided into two stages:
(2) 2005 to 2015, the area of Qinghai Lake increased by 116.16
Table 2. Qinghai lake area changes from 1995 to 2015
Figure 13. Qinghai lake area changes from 1995 to 2015
4.2.2 Lake Range Change Analysis in Nam Co: Figure 14 shows the landscape of Nam Co in the nearly 30 years from 1985 to 2015. The red frame was extracted from the 1987 lake area, and the yellow frame was covered by the 1995 lake area, the green part of the lake represent area of 2005, and the purple part represent the lake in 2015. Area data shown in table 3. For nearly 30 years, Nam Co has been from stable to expansion to
Table 3. Nam Co area changes from 1995 to 2015
Figure 14. Nam Co area changes from 1995 to 2015
4.2.3 Lake Range Change AnalysisinSelin Co: As shown in figure 15, the red frame covered from the 1987 lake area, the yellow frame was extracted from 1995, and the green part of the lake was covered by the 2005 lake area, the purple part represent the lake area of 2015. The amount of lake area in the period shown in table 4. From 1986 to 1995, Selin Co increased 15.03 km2. From 1995 to 2005, it increased 492.3 km2. From 2005 to 2015, it increased 141.88 km2. Different from Qinghai Lake and Nam Co. From 1985 to 2015, the analysis found that Selin Co was in a stable state of expansion, with an increase in the area, and the trend was divided into three stages:
(1) From 1987 to 1995, there is a steady trend in Selin Co, but there is a slight increase in the area and a small growth rate. In 10 years, the area has increased 15.03 km2, with an growth rate of 1.50 km2a-1.
(2) Between 1995 and 2005, the total size of the lake was significantly higher, with the amount of 492.3 km2 of expansion in 10 years and the area change rate is 28.21%. The growth rate is 49.23 km2a-1. In contrast to 1986 to 1995, the rate of increase in the volume of the area was significantly higher, with significant expansion.
(3) Between 2005 and 2015, Selin Co's area of growth has declined, but is still expanding. During the 10 years, the area has increased 141.88 km2, with a change rate of 6.34% and the growth rate is 14.19 km2a-1.
Table 4. Selin Co area changes from 1995 to 2015
5. CONCLUSION
This article combines remote sensing data from the Landsat's high-altitude lake with data for the study, also combines ENVI and ArcGIS software. Based on the theoretical underpinning of the remote sensing technology and geo-information systems, it explores the different methods to extract lake, evaluating and analysing the methods used in the study. From this study, we can get the follow conclusions:
(1) It is ideal to extract the lake from the OC method, which can avoid the influence of the shadow and snow cover, thus the error rate is small. The ST method is limited in the ability to distinguish between water and shadow, and a large number of shadows presented in the results, which results in a high proportion of shadow error extraction. The error rate of MSCT is higher, and shadows have been extracted, thus the accuracy is low. The MLC method and the SVM method are extracted based on the spectral characteristics of the water body, the limitation of the actual process is large, so the lake extraction effect is not very well. NDWI and MNDWI covered the mountain shadows, snow and ice, it causes the extraction to be less desirable than the other methods.
(2) Between 1985 and 2015, Qinghai Lake has expanded after a steady expansion; Nam Co was in the state about stable to expansion to stable. The area increased by 70.03 km2, a growth rate of 2.33 km2 a-1 and had a small change in area; Selin Co expanded after a stable state, and the area is always growing, and Selin Co's growth rate is larger than Qinghai Lake and Nam Co at the same time.
(3) For lakes in a complex, remote area, the extraction method based on the remote sensing of satellite imagery has a big advantage. At the same time, the combination of RS and GIS allows for a greater ease in the development of the research and the evolution of the long-time sequence analysis of lakes.
ACKNOWLEDGEMENTS
This research was supported by the National Science Foundation of China (91547210, 41771471, 41201425), the National Key Research and Development Program of China (2017YFA0603102), and the Fundamental Research Funds for the Central Universities.
REFERENCES
Frazier P S, Page K J. 2000. Water body detection and delineation with Landsat TM data. Photogrammetric Engineering & Remote Sensing, pp. 1461-1467.
Xi X, Shen N, Li X. 2009. Study on the water extraction method of ETM+ images. Computer engineering and design, pp. 993-996.
Mc Feeters S. K. 1996.The use of the Normalized Difference Water Index (NDWI) in the delineation of open water features. International Journal of Remote Sensing, 17(7), pp. 1425-1432.
Xu H. 2006. Modification of normalized difference water index (NDWI) to enhance open water features in remotely sensed imagery. International Journal of Remote Sensing, 27(14), pp. 3025-3033.
Kingsford RT, Wales New South. 1997. GIS database for wetlands of the Murray-Darling Basin. Murray-Darling Basin Commission.
Lu S, Xiao G, Jia L, et al. 2016. 2000-2012 remote sensing extraction of spatial and temporal process data of lake surface in Qinghai-Tibet plateau. Homeland remote sensing, 28(3), pp. 181-187.
Zhao R, Ye Q, Zong J. 2016. The change of the lake in the southern Tibetan plateau and its response to the climate.
Dry area resources and environment, 30(2), pp. 147-152.
Yan L, Zheng M, Wei L. 2016. The change of the Tibetan plateau and its response to climate change in the past 40 years. Local Leading edge, 23(4), pp. 310-323.
Dong S, Xue X, You J, Peng F. 2014. Remote sensing analysis of the lake area of Qinghai-Tibet plateau in the last 40 years. Lake science, 26(4), pp. 535-544.
Li J, Sheng Y, Luo J, Shen Z. 2011. Remote sensing mapping of inland lake in Qinghai-Tibet plateau. Lake Science, (23), pp. 311-320.