CONSERVATISM AND THE COST OF EQUITY CAPITAL:
A MULTI-DIMENSIONAL MEASUREMENT APPROACH
Hendrik Gamaliel Universitas Sam Ratulangi ([email protected])
Slamet Sugiri Universitas Gadjah Mada
ABSTRACT
Conservatism is a permanent phenomenon and issue in the accounting practice. It has been developing in two forms, ex ante and ex post, measured in various ways—the accruals, valuation model, and book-to-market measures. Prior studies document inconclusive find-ings on the association between conservatism and the cost of equity capital. These inconsis-tent findings motivate us to examine whether the various measures of conservatism have dif-ferent effects on the relationship between conservatism and the cost of equity capital. We find that the accruals measure explains the relationship, while the valuation model and book-to-market measures do not. Our findings suggest that different measures of conserva-tism relate differently to different articulations. Researchers, therefore, should be cautious in interpreting the relationship between conservatism and the cost of equity capital.
Keywords: ex ante and ex post conservatism, cost of equity capital, various measures of
conservatism
INTRODUCTION1
As a phenomenon in accounting, conserva-tism has lasted for centuries. Its existence as well as its effect on accounting practice is still devel-oping and attracting researchers. Conservatism has been affecting accounting practice for more than 500 years and has become the most influ-ential valuation standard in accounting (Sterling, 1970; Basu, 1997). Some studies have examined the effect of conservatism on debt contracting, litigation, taxes, and accounting regulation.
Watts (2003a) conceptually states that con-servatism in accounting is something important and improves financial reporting. Nevertheless, in order to achieve neutrality, the FASB (2010)
We appreciate our colleagues in the Accounting Doctoral Program, the Faculty of Economics and Business, Universitas Gadjah Mada and some participants of the 13th Asian Academics Accounting Association Conference at Universitas Udayana for their insightful comments based on which we improved this manuscript. Any criticism should be sent to [email protected]
through the new SFAC No. 8 excludes conser-vatism, a principle it used before 2010. Such effort disregards the reasons of the practice of conservatism and might be fruitless or even cause unfavorable consequences. LaFond and Watts (2008) argue that conservative financial reporting is a mechanism of management to minimizes as well as to control the incentives for managers to overstate their financial perform-ance and to increase the expected cash flow and, in turn, the firm’s market value. Some of the consequences of conservatism prohibition are the change in managerial behavior and the prominent cost to the investors.
in-consistent results. Francis et al. (2004), using the asymmetric timeliness of earnings measure, find that conservatism positively associates with earnings quality, but it does not explain the cost of equity capital. On the contrary, Lara et al. (2011) find that conservatism negatively relates with the cost of equity capital. In addition, Lara et al. (2011) explain that conservatism reduces information risk and the information risk, in turn, affects the cost of equity capital. Lara et al. (2011), using the conservatism ratio (Callen et al, 2010), also argue that the measurement of conservatism might cause Francis et al. (2004) failed to demonstrate the relationship between conservatism and the cost of equity capital.
Francis et al. (2004) motivated Chan et al. (2009) to conduct similar study under different perspective, that is, accounting information. By differentiating the level of conservatism into the ex ante as well as ex post conservatism, Chan et al. (2009) empirically examine the effect of con-servatism on the cost of equity capital and found that different levels of conservatism show differ-ent effects. That is, the ex ante level of conser-vatism using the book to market ratio shows a positive effect on accounting information quality and a negative effect on the cost of equity capi-tal. The ex post level of conservatism using the asymmetric timeliness of earnings (Basu, 1997), on the contrary, indicates a negative effect on accounting information quality and a positive effect on the cost of equity capital. However, Chan et al. (2009) state that their study has some limitations in its proxy to measure conservatism, which may alter the results of their study.
It can be suggested by the studies mentioned above that various measures of conservatism are an important issue to study. Different results documented by previous studies might come from different measures of conservatism. We attempt to make some deeper insights into this matter. We address the following fundamental question: “Do different measures of conserva-tism result in different effects on the relationship between conservatism and the cost of equity capital?” We empirically examine this relation-ship, within the context of the ex ante and ex post conservatism dimensions, using a variety of
measures. We contribute to the extant theory on the association between conservatism and the cost of equity capital by demonstrating that vari-ous measures of conservatism produce different associations between the two constructs.
Our study is based on the following logical arguments. First, under decision theory, rational investors tend to avoid risks when making deci-sions where uncertainty exists. When making their decisions where uncertainty exists, if in-vestors are provided with some alternatives type of accounting information to select, the investors tend to choose the conservative one. The advan-tages of conservatism as a consistent and useful approach to value assets and earnings are the reason for the investor’s choice. Second, we follow Watts (2003b) who states that the meas-ures play a major role in explaining conserva-tism. The variety of measures added to other alternatives to explain the different results of association between conservatism and the cost of equity capital.
We find that conservatism applied by sam-ple companies exists only in the form of ex ante conservatism, not in the form of ex post conser-vatism. We also find that different measures of conservatism produce different associations between conservatism and the cost of equity capital. These findings support our proposed hypothesis.
We have organized the rest of this paper as follows. First, we will discuss the theoretical background and develop our hypothesis. Second, we will explain our research method and, then, research results. Third, we will discuss at length our findings. Finally, we will conclude the paper by presenting our conclusion and limitations.
THEORETICAL BACKGROUND AND HYPOTHESIS DEVELOPMENT
Conservatism Measurement
conservatism cause various measurements. Watts (2003b) states that previous researches use the variety of measurements to measure whether conservastism exist.
The definition of conservatism in our study refers to Basu (1997). Basus’s (1997) definition is adopted later by Watts (2003b) to summarize the types of conservatism measurement used in previous research. The definition by both re-searchers is the asymmetric verification required for gains and losses. It is interpreted as the level of conservatism; the greater the difference in verification level required for gains compared to losses, the higher the conservatism level (Watts, 2003a).
Based on the definition above, Watts (2003b) elaborates three basic measurements of conservatism. The first is net asset measures, emphasizing asset understatement in which assets are stated at below their market value. There are two models for these measures, valua-tion model measures and book-to-market meas-ures. The second is earnings/accruals measures, putting the emphasis on the estimation of earn-ings distribution, the change in earnearn-ings, and accruals. There are also two models for these measures, earnings measures and accruals meas-ures. The third is earnings/stock returns relation-ship measures, emphasizing that the relationrelation-ship between earnings and stock return is reflected differently during periods of gains and losses.
Such different measurements have been ap-plied both to investigate the existence of conser-vatism (Stober, 1996; Myers, 1999; Ahmed et al., 2000) and to examine the impact of conser-vatism to some elements, such as the quality of earnings reporting (Penman and Zhang, 2002; Ball and Shivakumar, 2005) and the cost of equity capital (Francis et al., 2004; Chan et al., 2009). Studies on these subjects demonstrate the existence, as well as the impact, of conservatism. Until recently, however, there was no single study that examines the consistency of the rela-tionship between conservatism and the cost of equity capital when all three basic measurements of conservatism were used. Our study addresses that question.
The Impact of Various Conservatism Meas-urements
The variety of conservatism measurements shows indirectly that conservatism is a concept which is observable under various aspects. Such a variation also gives a positive impact, that is, conservatism becomes a highly active subject for empirical research. Lots of studies regarding conservatism are available. On the other hand, the variation also causes some negative impacts, for instance, the result consistency among vari-ous measures, and the tendency to use favorable measures.
Wang et al. (2009) state each measurement of conservatism contains a number of problems, such as the uncertainty of the statistical validity of the conclusion. The widely used conservatism measures are the asymmetric timeliness measure of Basu (1997), the asymmetric cash flow to ac-crual measure of Ball and Shivakumar (2005), the market to book ratio measure by Watts (2003), the hidden reserves measure of Penman and Zhang (2002), and the negative accrual measure of Givoly and Hayn (2000). These measures according to Wang et al. (2009) show low validity. The four types of validity exami-nation on the above mentioned conservatism measures are convergent validity, concurrent validity, statistical conclusion validity, and in-ternal consistency. They show unsatisfactory results. Such low validity may lead to inconsis-tent results. Another impact is called mono-operation bias, due to frequent usage of one fa-vorable measure. When examining one con-struct, if one measure shows a positive direction then the other measures somehow show positive or negative directions. This bias causes negative correlation among the measures when examining the same construct. An example is the negative correlation between the asymmetric timeliness measure (Basu, 1997) and the market to book ratio measure(Watts, 2003).
comprehensively. Basu (1997) has set an exam-ple by explaining the negative correlation of the asymmetric timeliness and market to book ratio measures. Beaver and Ryan (2005) state that the negative correlation is not a contradiction with theoretical prediction, instead, it explains the levels of conservatism, conditional and uncondi-tional conservatism, which both measures tend to correlate negatively.
Regarding the negative impact, some solu-tions have been proposed (Wang et al., 2009). These solutions are first, classifying the real definition and properties of conservatism and the relation among available conservatism measures; second, controlling the confounding factors within empirical design; third, employing vari-ous measures within one study and designing a study with a combination of measures. Our study uses the third one by examining the relationship between conservatism and the cost of equity capital.
Ex Ante and Ex Post Conservatism
According to accounting literature, conser-vatism can be viewed from two dimensions, the ex ante (unconditional) and the ex post (condi-tional). Ex ante conservatism involves asset re-cording at lower than market value, eventhough the decrease in value of the assets has not actu-ally occurred. Therefore, assets are recorded lower than their book value. The methods of recording assets at lower than market value include immediately expending the cost of in-tangible assets and shortening the economic life of tangible assets so that the depreciation value is greater than economic depreciation. Ex post conservatism comprises of a book value that is recorded lower under unfavorable conditions, and higher under favorable conditions. Referring to the definition by Basu (1997), this dimension of conservatism is the asymmetric response of earnings against economic gains and losses, so that economic losses are recorded earlier than gains.
Beaver and Ryan (2005) state that literature reviews on both dimensions have different em-phasis. Ex ante conservatism reviews emphasize the difficulties of economic assets and liabilities
valuation and determining their impacts on fu-ture earnings. Meanwhile, ex post conservatism reviews put the emphasis on increasing ers’ contracting efficiency, based on the manag-ers’ tendency to report in an overstated way. Although both have a different emphasis, when reviewed more deeply, one review counteracts the other one. Beaver and Ryan (2005) state that ex ante conservatism prevents negative impacts of the ex post conservatism.
The comprehension about both dimensions of conservatism provides an illustration about the relationship between conservatism and ac-counting information. The application of both dimensions has different implications. Chan et al. (2009) argue that, under the ex ante and ex post conservatisms, the quality of accounting information about earnings is different. They state that the higher the level of ex ante conser-vatism, the higher the quality of earnings infor-mation and the higher the level of ex post con-servatism, the lower the quality of earnings information. Different results are shown when applied to the cost of equity capital. A higher level of ex ante conservatism leads to a lower cost of equity capital. On the contrary, a higher level of ex post conservatism causes a higher cost of equity capital.
Hypothesis Development
between management and investors(LaFond dan Watts, 2008).
Previous research provides inconsistent results, for instance, research by Francis et al. (2004), Lara et al. (2011), and Chan et al. (2009). The conjecture is that such inconsisten-cies originate from the different measurements of conservatism. This conjecture is based on Wang et al. (2009) that various measurements of conservatism and inconsistency among the measurements become the distinctive character-istics of research regarding conservatism. Wang et al. (2009) also state that some measurements of conservatism employed in theoretical and hy-pothetical examinations produce different results depending on the measurement used. This is be-cause the concepts of accounting conservatism have not been universally accepted and are not well articulated by researchers. In the meantime, the facts of observed conservatism do not have any independent reference, and depend solely on the measurement applied.
The phenomenon of various measurements that lead to different results does not only occur with regard to conservatism. Kothari and Zimmerman (1995) investigated stock price and return models frequently used in stock market research. Their research wss motivated by the controversy about the advantages of the applica-tion and results of both models. Their study shows that each model has its own advantages and disadvantages when applied with rational reasons, either economic or econometric. They do not advise the use of one model to another. The combination of both models might provide a more reliable conclusion.
Wang et al. (2009) and Kothari and Zimmerman (1995) indicate that different meas-urements of conservatism might produce conclu-sive results when examining the relationship between conservatism and accounting informa-tion. Using this analogy, we propose that the variation of conservatism measures leads to dif-ferent relationship between conservatism and the cost of equity capital. We, therefore, formally propose the following hypothesis (noted as H1).
H1: Different conservatism measures result in a different association between conservatism and the cost of equity capital.
RESEARCH METHODS Data and Sampling Methods
We employ the Osiris Database from the Faculty of Economics and Business, Universitas Gadjah Mada. Our observation period is 2005-2009. The population targets were the stock markets of IDX (Indonesia), KLSE (Malaysia), SSE (Singapore), TSE (Thailand), and PSEi (Philippines). Data collected consisted of earn-ings, the stock book value, assets, liabilities, ac-cruals in operating acac-cruals and accounting accruals, the stock market price, ROE, future expected earnings, and the cash flow from oper-ating activities.
We use the following criteria to select our sample: (1) manufacture companies, (2) compa-nies having gains (Eit >0), (3) companies having an increase in stock book value (NBi,t+1 > NBit), (4) companies releasing the expected data, (5) companies distributing a dividend, and (6) com-panies having stock actively traded. The compa-nies under the first criterion are expected to get more accruals reflected in conservatism. The second and third criteria aim to show the mag-nitude and level of conservatism in each com-pany. The fourth criterion is used to show earn-ings movement. The fifth criterion is used to manipulate the cost of equity capital. The sixth criterion is useful to measure the relationship between earnings and stock return.
Measurements of Conservatism and Cost Equity Capital
The measurements of conservatism are based on classification by Watts (2003b), name-ly, (1) Valuation Model Measures, (2) Book-To-Market Measures, and (3) Accrual Measures.
Valuation Model Measures
conservatism. The model is used to estimate the level of undervaluation of the company's net as-sets by including the parameters that reflect the level of understatement of operating assets fol-lowing the assumption that accounting deprecia-tion exceeds economic depreciadeprecia-tion. We esti-mate the conservatism by cross-sectionally re-gressing the firms’ market value with earnings, total assets, and investment. The proxy of the firms’ market value is the value of the firms’ goodwill. The value of goodwill is obtained by subtracting the firms’ market value with the book value of net assets per share. Our study uses random-walk earnings, that are the latest year’s earnings are considered as the representa-tives of current year’s earning. Total assets are adjusted by the change in total assets using lag (t-1). Investment is a total investment in operat-ing assets made by the company in year t. The estimation model used is as follows:
total assets subtracted by the account receivables and other fixed assets, and eit is the error term of company i in year t, which in this study shows abnormal earnings. Estimated conservatism in the model (1) is expressed as β2 value. Positive
values indicate that companies tend to apply the practice of conservatism. So the β2 value is
ex-pected to be significantly positive.
Book-To-Market (BTM) Measures
This measure wss developed by Beaver and Ryan (2000) and estimates the conservatism on the premise that, ceteris paribus, conservative accounting systems tend to suppress the firms’ book value in comparison with the firms’ eco-nomic value. A lower value of BTM indicates a higher level of accounting conservatism, and vice versa. The measurement of conservatism using BTM model follows the model of Feltham
and Ohlson (1995) which was used by Chan et al. (2009), by comparing the market value of operating assets with the net book value of oper-ating assets. It is stated as follows:
1 firms’ market value of operating assets of year t, Et is a notation of expected earnings generated from oat+τ and MVt+τ, and lim (∞) is a pa-rameter which controls both oat+τ and MVt+τ.The measurement of conservatism using the formula (2) is done by comparing the two elements for each company. If a company has a value below 1, then the company applies conservatism and if the value is more than 1 then there is no conser-vatism. In our study, the measure used to esti-mate conservatism is the ratio between the book value and the market value (opening B/M ratio) as used by previous studies (Chan et al., 2009; Ahmed and Duellman, 2007; Roychowdhury and Watts, 2006).
Accrual Measures
The accrual measure is used to determine the existence of conservatism by investigating the sign and the magnitude of accumulated accruals from time to time. The rationale of this measure usage is that accounting conservatism uses the accrual mechanism to defer recognition of eco-nomic gains and to accelerate recognition of economic losses. Through the postponement of gains recognition and the quickening of losses recognition, accumulated accrual company will gradually become more negative (Givoly and Hayn, 2000). Based on this argument, conserva-tism is therefore measured by looking at the trend of negative accruals increase. In our study, the firm’s conservatism is measured by ranking the discretionary accruals. The firm’s discretion-ary accrual is derived by using the modified Jones’ model as follows:
Where NDAit is the nondiscretionary accrual of company i in year t, Ait-1 is the total asset of gross balance of fixed assets of company i in year t. DAit is the discretionary accrual, obtained by TAit minus NDAit. The estimation of conser-vatism using the results of equation (3) is done by deciles-based discretionary accrual rank. Ranking results show that in the first deciles companies tend to apply the conservatism and vice versa.
Ex Post Conservatism
The measurement results of conservatism that are used in equation (1), (2), and (3) shows the level of ex ante conservatism. In accordance with the research objectives, our study also measures ex post conservatism based on the re-sults of ex ante measurement. The type of ex post conservatism measurement is based on the measurement model of Chan et al. (2009) with some development adjusted to the research ob-jectives. The measurement model used is as fol-lows:
Where Zijt is the conservatism measure of com-pany i in year t based on j (1-3), namely the ranking of the valuation model measures, the book-to-market (BTM) measures, and the ac-crual measures. α0 is a constant value. Dit is the dummy variable of company i in year t with value 1 if the value of specific stock return (Rit –
Rmt) is negative and value 0 otherwise, Ritis the stock return value of company i in year t, Rmt is the market return value, and uit is the residual
value. The estimation of conservatism in the model (4) is base on the β1 value. If this β1 value
is positive, then the investor reaction is not con-servative. In other words, in these conditions there is no ex post conservative and vice versa.
Cost of Equity Capital
The measurement of the cost of equity capi-tal in this study uses a model developed by Ohlson and Juettner (2005). The formulation is as follows.
(epsit) minus the earnings per share for company
i in previous year (epsit-1).
Hypothesis Examination
Furthermore, our study identifies the con-sistency of the t-value coefficient for conserva-tism measure, namely CON _ RANKit variables from valuation model measures, book-to-market (BTM) measures, and accrual measures. CON _ RANKitis also used in the deciles-based sample partition. Each CON _ RANKitcoefficient is used to define the influence of conservatism on the cost of equity capital. The coefficient, which is interpreted as an increase in the cost of equity capital, is positive for ex ante conservatism and negative for ex post conservatism. On top of that, the coefficient also shows the influence of conservatism on the cost of equity capital.
RESEARCH RESULT
Sample and Descriptive Statistics
The overall number of samples obtained from the Osiris database are 1,181 manufactur-ing companies. Total final sample used for the 2005-2009 observation period for all target populations is as many as 581 companies. This result is obtained as a consequence of the pre-determined sampling criteria and is related to the data completeness. Details of the final sample size in each of the target population is presented in Table 1.
Table 1. Detailed Sample
Country Overall
Sample Eliminated
Final Sample
Malaysia 455 195 260
Philippines 51 37 14
Singapore 300 165 135 Thailand 220 99 121
Total 1,181 600 581
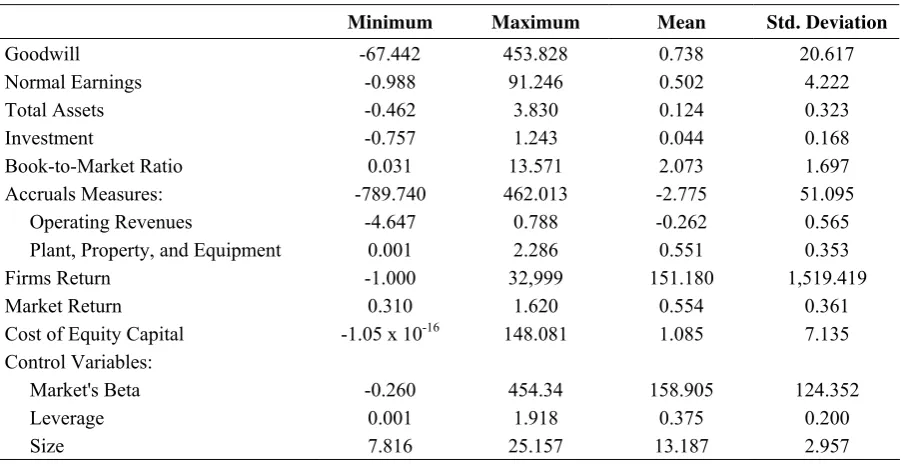
The results of descriptive statistics for the research key variables and conservatism meas-ures are presented in Table 2. The results indi-cate that goodwill shows a significant, positive value with a mean of 0.738. These results indi-cate that most of the sample firms tend to apply the practice of conservatism in their financial statements. It also can be seen in the positive value of the mean value of earnings, total assets, and investments. Likewise, the book to market value and accrual measures follow the trend of goodwill. The trend is expected to support the objectives of our study.
The mean value of the cost of equity capital is 1.085 with a standard deviation of 7.135. The relative magnitude of this standard deviation in comparison with its mean suggests that compa-nies tend to be optimistic even in the conserva-tive category. This is also shown by the pattern of beta descriptive statistics which are similar to
Table 2. Descriptive Statistics
Minimum Maximum Mean Std. Deviation
Goodwill -67.442 453.828 0.738 20.617
Normal Earnings -0.988 91.246 0.502 4.222
Total Assets -0.462 3.830 0.124 0.323
Investment -0.757 1.243 0.044 0.168
Book-to-Market Ratio 0.031 13.571 2.073 1.697
Accruals Measures: -789.740 462.013 -2.775 51.095
Operating Revenues -4.647 0.788 -0.262 0.565
Plant, Property, and Equipment 0.001 2.286 0.551 0.353
Firms Return -1.000 32,999 151.180 1,519.419
Market Return 0.310 1.620 0.554 0.361
Cost of Equity Capital -1.05 x 10⁻¹⁶ 148.081 1.085 7.135
Control Variables:
Market's Beta -0.260 454.34 158.905 124.352
Leverage 0.001 1.918 0.375 0.200
the cost of equity capital. Likewise, the tendency of the descriptive statistics of the two other con-trol variables, leverage and size, are similar.
Conservatism with Valuation Model Meas-ures
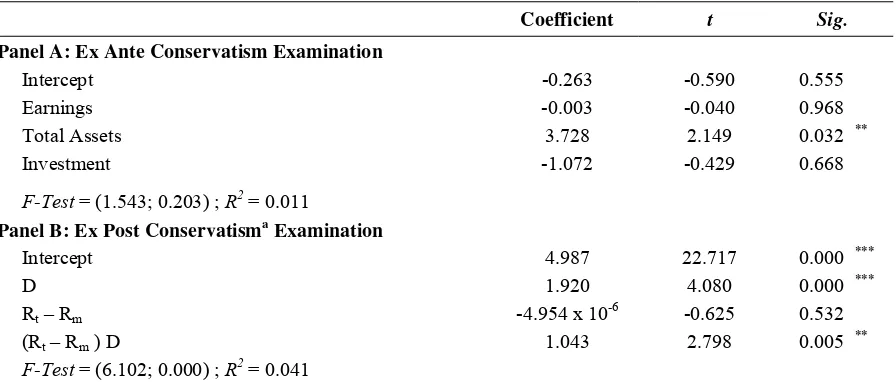
Ex ante conservatism with this measure uses the regression in equation (1). The test results are presented in Table 3 Panel A. The test results indicate that the coefficient of total assets is 3.728 and significant with the t-value (probabil-ity value) of 2.149 (0.032). The coefficient shows a significant, positive value as expected. Thus, our interpretation is that companies apply the practice of ex ante conservatism in their fi-nancial reports.
Furthermore, our study examines the exis-tence of ex post conservatism. The tests are car-ried out by using regression equation (4) using the ranked data obtained from equation (1). The test results are presented in Table 3 Panel B. The results show that the β1 coefficient, an indication
of ex post conservatism, is significantly positive. These results provide evidence that ex post conservatism does not exist, meaning that invest-tors do not respond to the conservatism applied by companies. However, these results do not impede the testing of the conservatism influence on the cost of equity capital using this measu-rement model.
Conservatism Examination using Book-To-Market Measures
The examination of ex ante conservatism using this measure is based on the ratio between the book value and market value (opening B/M ratio), which is then ranked to divide the types of companies which apply, and which do not apply the conservatism practice. Companies are ranked based on equation (2). The results reveal that of the 581 companies, only 131 companies can be included in the category that applies conserva-tism. Thus, our study concludes that only 131 companies use ex ante conservatism practices in their financial statements. These results are then used in equation (4) to determine the existence of ex post conservatism. Ex post conservatism examination results are presented in Table 4. Table 4 shows that the β1 coefficient is not
statis-tically positively significant. As with the valua-tion model measures, this examinavalua-tion result also provides evidence of the absence of ex post conservatism.
Conservatism Examination Using Accruals Measure
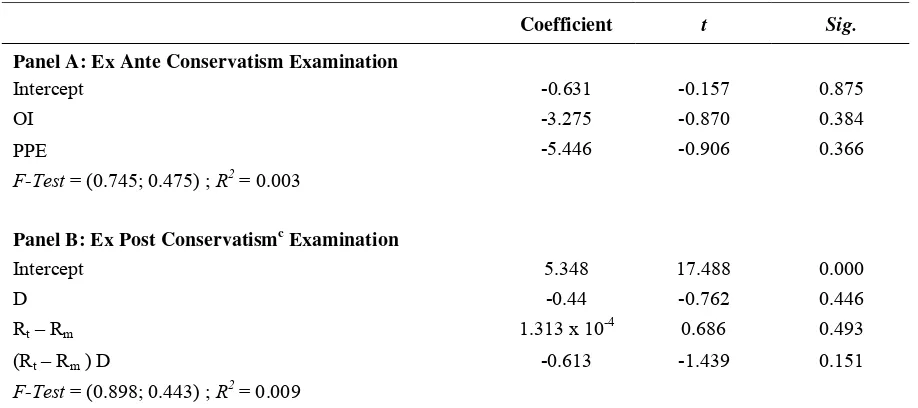
Examination of the ex ante conservatism is conducted by ranking the discretionary accruals obtained from equation (3). The results are pre-sented in Table 5 Panel A. Analysis of discre-tionary accrual rank shows the result that only 289 of 581 companies indicate the application of
Table 3. Ex Ante and Ex Post Conservatism Examination Using Valuation Measures
Coefficient t Sig.
Panel A: Ex Ante Conservatism Examination
Intercept -0.263 -0.590 0.555
Earnings -0.003 -0.040 0.968
Total Assets 3.728 2.149 0.032 **
Investment -1.072 -0.429 0.668
F-Test = (1.543; 0.203) ; R2 = 0.011
Panel B: Ex Post Conservatisma Examination
Intercept 4.987 22.717 0.000 ***
D 1.920 4.080 0.000 ***
Rt – Rm -4.954 x 10⁻⁶ -0.625 0.532
(Rt – Rm ) D 1.043 2.798 0.005 **
F-Test = (6.102; 0.000) ; R2 = 0.041
***
ex ante conservatism. The 289 companies are then used in equation (4) to identify the exis-tence of ex post conservatism.
The results of ex post conservatism exami-nation using this measure are presented in Table 5 Panel B. The results show that the coefficients of D, Rt - Rm, and (Rt - Rm)D, each is not
statisti-cally significant. We, therefore, document that there is no ex post conservatism using the accru-als measure.
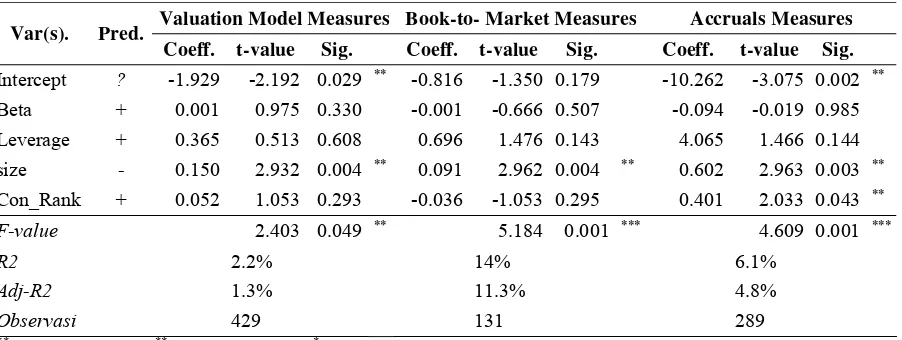
Conservatism and the Cost of Equity Capital The association of conservatism and the cost of equity capital examination results are pre-sented in Table 6. The examination employs regression equation (6). The first column in Table 6 shows the results using valuation model measures. The results show that the CON_RANK variable is not significant with a coefficient value of 0.052 and a t-value
(probability value) of 1.053 (0.293). This means that the association between conservatism and the cost of equity capital is not confirmed. Apart from the CON_RANK coefficient that is not statistically significant, the coefficient of size variable shows statistically significant result. While other variables, beta and leverage, do not show statistically significant results.
The second column of Table 6 presents the results of association of conservatism and the cost of equity capital conservatism using the book-to-market measure. The results show that only size variable is statistically significant with a coefficient value of 0.091 and with a t-value (probability value) of 2.962 (0.004). While other variables such as beta, size, and CON_RANK do not show statistically significant results. The results do not provide evidence that conserva-tism and the cost of equity capital are related. Table 4. Examination of Ex Post Conservatismb Using Book-To-Market Measures
Coefficient t Sig.
Intercept 5.209 15.933 0.000
D 0.971 1.047 0.297
Rt – Rm -1.441 x 10⁻³ -1.786 0.076 *
(Rt – Rm ) D 0.004 0.005 0.996
F-Test = (2.611; 0.054) ; R2 = 0.058
***
significant at 1%, **significant at 5%, *significant at 10%, b Sample used in analysis is 131 companies.
Table 5. Examination of Ex Post Conservatism Using Accruals Measures
Coefficient t Sig.
Panel A: Ex Ante Conservatism Examination
Intercept -0.631 -0.157 0.875
OI -3.275 -0.870 0.384
PPE -5.446 -0.906 0.366
F-Test = (0.745; 0.475) ; R2 = 0.003
Panel B: Ex Post Conservatismc Examination
Intercept 5.348 17.488 0.000
D -0.44 -0.762 0.446
Rt – Rm 1.313 x 10⁻⁴ 0.686 0.493
(Rt – Rm ) D -0.613 -1.439 0.151
F-Test = (0.898; 0.443) ; R2 = 0.009
***
The third column of Table 6 presents the results of the association of conservatism and the cost of equity capital examination using the accruals measure. The examination using accru-als measure yields two variables which are sta-tistically significant, namely size, with a coeffi-cient value of 0.602 and the t-value (probability value) of 2.962 (0.003) and Con_Rank with a coefficient value of 0.401 and a t-value (prob-ability value) of 2.033 (0.043). Meanwhile, the other variables, namely beta and leverage, are not statistically significant. We also, therefore, show the absence of the association between conservatism and the cost of equity capital.
The examination of association between conservatism and the cost of equity capital using all three measures produces a CON_RANK with different directions of association and signifi-cance levels. A coefficient value (probability value) for 0.052 (0.293) for the valuation model measure. This indicates that, using the valuation model measure, we do not find the association between conservatism and the cost of equity capital. A coefficient value (probability value) of -0.036 (0.295) for the book-to-market measure. This also shows that, using this book-to-market measure, we do not find the association between conservatism and the cost of equity. On the con-trary, to the two types of measures mentioned above, the accrual measure shows a significant positive association between conservatism and the cost of equity capital. This is indicated by a coefficient value (probability value) of 0.401
(0.043) for the accruals measure. Therefore, this study concludes that using different measures causes different associations between conserva-tism and the cost of equity capital. In other words, we find empirical evidence that supports our proposed hypothesis that different measures of conservatism result in different associations between conservatism and the cost of equity capital.
DISCUSSION
The examination of the association between conservatism and the cost of equity capital using three types of conservatism measures, namely valuation model measures, book-to-market measures, and accrual measures, show some research findings. First, the examination results provide empirical evidence that the differentia-tion of conservatism level, namely ex ante and ex post, gives different interpretion of the exis-tence of conservatism in accounting practices. The different results about the existence of con-servatism practices at the ex ante and ex post level is evidence that the presence of ex ante conservatism is not always followed by the ex post conservatism. This means that the applica-tion of conservatism by management, as re-flected in their companies’ financial statements (ex ante), is not always treated by investors as a manifestation of conservatism in the market (ex post), and vice versa. This is probably closely related to the ability of investors to capture the intention and objectives of management when Table 6. Examination of Conservatism and Cost of Equity Capital
Valuation Model Measures Book-to- Market Measures Accruals Measures
Var(s). Pred.
Coeff. t-value Sig. Coeff. t-value Sig. Coeff. t-value Sig.
Intercept ? -1.929 -2.192 0.029 ** -0.816 -1.350 0.179 -10.262 -3.075 0.002 **
Beta + 0.001 0.975 0.330 -0.001 -0.666 0.507 -0.094 -0.019 0.985
Leverage + 0.365 0.513 0.608 0.696 1.476 0.143 4.065 1.466 0.144
size - 0.150 2.932 0.004 ** 0.091 2.962 0.004 ** 0.602 2.963 0.003 **
Con_Rank + 0.052 1.053 0.293 -0.036 -1.053 0.295 0.401 2.033 0.043 **
F-value 2.403 0.049 ** 5.184 0.001 *** 4.609 0.001 ***
R2 2.2% 14% 6.1%
Adj-R2 1.3% 11.3% 4.8%
Observasi 429 131 289
***
applying conservatism. This condition leads to different perceptions between management and investors in interpreting the existence of conser-vatism. Additionally, the risk-adverse attitude of investors may be the underlying factor when explaining the phenomenon.
Second, the examinations using the three different types of conservatism measures, i.e. the valuation model measure, the book-to-market measure, and the accrual measure results in dif-ferent company classification that applies con-servatism. This is indicated by different number of companies in conservatism rank. This means that a company might be considered conserva-tive when measured by one measure, but might be considered not conservative when measured by other measures.
Third, the use of different measures to esti-mate conservatism has different implications in determining the association between conserva-tism and the cost of equity capital. This is indi-cated by the difference in statistical significance of the association between conservatism and the cost of equity capital amongst the various types of measurements used. Our study, therefore, an-swers the addressed question why there is an inconsistency in the association between the construct conservatism and the construct cost of equity capital.
Fourth, our study finds that of the three types of conservatism measures, the most ade-quate measurement is modified Jones model (Givoly and Hayn, 2000). These results suggest that conservatism identified by accrual measures indicates that investors are more likely to pay intention toward accounting earnings rather than operating cash flows. Under valuation measure by Feltham and Ohlson (1995) and Ahmed et al. (2007), our study finds that investors do not re-spond to conservatism conducted by manage-ment. Thus, this suggests that investors merely digest book value of stockholders’ equity whether or not it actually reflects the firm value. It also means that they fully concern with the share’s premium value dominantly influenced by accruals.
Fifth, the results of the three types of meas-urements suggest that conservatism lies in ex
ante conservatism only, not in ex post conserva-tism. The reason is that conservatism is indeed implemented by management referring to the conservatism in generally accepted accounting principles (GAAP), as the SFAC No. 1 asserts that conservatism is intended for investors’ pro-tection by presenting neutral accounting infor-mation. Meanwhile, ex post conservatism is still an academics concept and not contained in the accounting standards. It is, therefore, reasonabe to argue that ex post conservatism’s association with the cost of equity capital cannot be demon-strated in empirical studies.
CONCLUSIONS AND LIMITATIONS This study provides some empirical evi-dences about the impact of using different con-servatism measures against the association be-tween conservatism and cost of equity capital. The results of this study provide evidence that there are different associations of conservatism and cost of equity capital in all three measures, namely valuation model measures, book-to-mar-ket measures, and accrual measures. This means that the dependency on the measures becomes an important factor in determining the relationship of conservatism and cost of equity capital.
This study concludes that (1) conservatism levels lead to different consequences when in-terpreting the existence of conservatism in ac-counting practices, (2) the criteria for determin-ing the companies that apply conservatism should vary according to the measures used, (3) the use of different measures in estimating con-servatism has different implications in deter-mining the association between conservatism and the cost of equity capital, (4) the most ap-propriate conservatism measures –identified in this study– to examine the association between conservatism and the cost of equity capital is the accrual measures, (5) actual conservatism in ac-counting practices lies more in ex ante conser-vatism, while ex post conservatism is still an academic concepts.
ur-gent. The discrepancy results obtained by the researchers should be enough reason that univer-sal agreement on the definition of conservatism in accounting practices is long overdue.
This study has several limitations. First, this study used the capital markets of Southeast Asia countries which are likely weak efficiently form, so that stock return was not fully able reflect to the cost of equity capital. Second, the cost of equity capital is more likely to be higher in de-veloping countries compared to developed countries. The high cost of equity capital is needed to sustain a high fixed interest rate. Third, this study is not fully comprehensive be-cause it only uses three conservatism measures, namely the valuation model measures, the book-to-market measures, and the accrual measures. Meanwhile, there are two other kinds of conser-vatism measures, namely earnings measures and earnings/stock return relationship measures, which cannot be employed in this study because of data limitation.
REFERENCES
Ahmed, A.S., R.M. Morton, and T.F. Schaefer, 2000. “Accounting Conservatism and The Valuation of Accounting Numbers: Evi-dence Of The Feltham-Ohlson (1996) Model". Journal of Accounting, Auditing & Finance, 15 (3), 271-291.
Ahmed, Anwer S., and Scott Duellman, 2007. “Accounting Conservatism and Board of Director Characteristics: An Empirical Analysis”. Journal of Accounting and Eco-nomics, 43 (2-3), 411–437.
Ball, R., and L. Shivakumar, 2005. “Earnings Quality in UK Private Firms: Comparative Loss Recognition Timeliness”. Journal of Accounting and Economics, 39 (1), 83-128.
Basu, S., 1997. “The Conservatism Principle and The Asymmetric Timeliness of Earnings”.
Journal of Accounting and Economics, 24 (1), 3-37.
Beaver, W., and Ryan, S., 2000. “Biases and Lags in Book Value and Their Effects on The Ability of The Book-To-Market Ratio
to Predict Book Return On Equity”.Journal of Accounting Research, 38 (1), 127-148.
Callen, J. L., D. Segal, and O. K. Hope., 2010. “The Pricing of Conservative Accounting and The Measurement of Conservatism at The Firm-Year Level”. Review of Accounting Studies, 15 (1), 145-178.
Chan, Ann L.C., Stephen W.J. Lin, and Norman Strong, 2009. “Accounting Conservatism and The Cost of Equity Capital: UK Evidence”. Managerial Finance, 35 (4), 325-345.
Cooper, Donald. R., and Pamela S. Schindler, 2008. Business Research Methods. 10th ed. McGraw Hill International.
Feltham, G., and J.A. Ohlson, 1995. “Valuation and Clean Surplus Accounting for Operating and Financial Activities”. Contemporary Accounting Research, 11 (Spring), 689-731.
Feltham, G., and J.A. Ohlson, 1996. “Uncertainty Resolution and The Theory of Depreciation Measurement”. Journal of Accounting Research, 34 (Autumn), 209-234.
Francis, J., R. LaFond, P. Olsson, and K. Schipper, 2004. “Costs of Equity and Earn-ings Attributes”. The Accounting Review, 79 (4), 967-1010.
Givoly, D., and C. Hayn, 2000. “The Changing Time-Series Properties of Earnings, Cash Flows and Accruals: Has Financial Report-ing Become More Conservative?”. Journal of Accounting and Economics, 29 (3), 287-320.
Kothari, S.P., and Jerold L. Zimmerman, 1995. “Price and Return Models”. Journal of Ac-counting and Economics, 20 (2), 155-192.
LaFond, R., and R. L. Watts, 2008. “The Infor-mation Role of Conservatism”. The Ac-counting Review, 83 (2), 447-478.
Lara, Juan M. G., Beatriz García Osma, and Fernando Penalva, 2011. “Conditonal Con-servatism and Cost of Capital”. Review of Accounting Studies, 16 (2), 247-271.
Dynam-ics”. The Accounting Review 74 (January): 1-28.
Ohlson, J., and B. Juettner-Nauroth, 2005. “Ex-pected EPS and EPS Growth as Determi-nants of Value”. Review of Accounting Stud-ies, 10 (2-3), 349-365.
Penman, S.H., and X. Zhang, 1992. “Accounting Conservatism, The Quality of Earnings and Stock Returns”. The Accounting Review, 77 (2), 237-264
Roychowdhury, Sugata and R.L. Watts, 2007. “Asymmetric Timeliness of Earnings, Market-To-Book and Conservatism in Fi-nancial Reporting”. Journal of Accounting and Economics, 44 (1-2), 2-31.
Sterling, R.R., eds., 1970. The Theory of the Measurement of Enterprise Income. Law-rence, KS: University of Kansas Press.
Stober, T., 1996. Do Prices Behave as if Ac-counting Book Values Are Conservative?
Crosssectional Tests of The Feltham-Ohlson (1995) Valuation Paper, Working paper, University of Notre Dame.
Wang, Richard Z., Ciarán Ó hÓgartaigh, and Tony van Zijl, 2009. “Measures of Account-ing Conservatism: A Construct Validity Per-spective”. Journal of Accounting Literature,
28, 165-203.
Watts, R.L., 2003a. “Conservatism in Accounting Part I: Explanations and Implications”. Accounting Horizons, 17 (3), 207-221.
Watts, R.L., 2003b. “Conservatism in Accounting Part II: Evidence and Research Opportunities”. Accounting Horizons, 17 (4), 287-301.