Gadjah Mada International Journal of Business Vol. 18, No. 1 (January-April, 2016): 21-53
* Corresponding author’s e-mail: [email protected]
Investigating the Effects of Consumer Innovativeness,
Service Quality and Service Switching Costs on Service
Loyalty in the Mobile Phone Service Context
Farzana Quoquab,
1Nor Liza Abdullah,
2and
Jihad Mohammad
1*1 International Business School, Universiti Teknologi Malaysia. 2 Faculty of Economics and Management, Universiti Kebangsaan Malaysia.
Abstract: The objective of this study is to examine the effects of consumer innovativeness, service quality, service switching costs and service satisfaction on service loyalty among mobile phone service users. A cross sectional survey was employed which yielded 535 responses. Structural equation modelling using the AMOS version 2.0 was utilized to test study the hypotheses. Test results reveal that service satisfaction, ser vice switching costs and service quality are the three antecedents that directly influence ser vice loyalty. How ever, consumer innovativeness does not have any direct effect on service loyalty. Moreover, service satisfaction is found to be a partial mediator between ‘service quality’ and ‘service loyalty’. Findings from this study will develop insights to enable policy-makers, managers and marketers to better strategize and effectively implement loyalty programs and prevent their customers from switch-ing. This will enhance value creation for both their users and for the industry.
Abstrak: Tujuan penelitian ini adalah untuk menguji efek keinovatifan konsumen, kualitas layanan, biaya peralihan layanan dan kepuasan layanan pada loyalitas layanan di kalangan pengguna layanan telepon seluler. Survei cross sectional yang dilakukan mendapatkan 535 tanggapan. Pemodelan persamaan struktural menggunakan AMOS versi 2.0 digunakan untuk menguji hipotesis. Hasil pengujian mengungkapkan bahwa kepuasan layanan, biaya peralihan layanan dan kualitas layanan adalah tiga anteseden yang secara langsung mempengaruhi loyalitas layanan. Namun, keinovatifan konsumen tidak memiliki efek langsung pada loyalitas layanan. Lebih lanjut, kepuasan layanan ditemukan sebagai pemediasi parsial antara ‘kualitas layanan’ dan ‘loyalitas layanan’. Temuan studi ini akan mengembangkan pilihan yang memungkinkan para pembuat kebijakan, manajer dan pemasar untuk merancang strategi yang lebih baik dan secara efektif meng-implementasikan program loyalitas dan mencegah pelanggan mereka beralih. Hal ini akan meningkatkan penciptaan nilai bagi para pengguna dan bagi industri.
Keywords: consumer innovativeness; mobile phone service users; service quality; service satisfaction; service switching cost; service loyalty
Introduction
Achieving the loyalty of their customers has become the main concern for service in-dustry managers, since it contributes signifi-cantly to their firms’ profitability (Reichheld 2002; Reichheld and Sasser 1990; Rust and Zahorik 1993), sur vival and growth (Reichheld 1996), and for providing new re-ferrals for their firms through positive word of mouth endorsements (Ganesh et al. 2000; Gremler and Brown 1996). However, retain-ing current customers and precludretain-ing them from switching is a very difficult task, due to the availability of alternative service provid-ers (Habib et al. 2011; Quoquab et al. 2014; Tuu and Olsen 2013). This is more crucial for the telecoms’ service industry (Adham and Said 2010; Said and Adham 2010; Narayana 2011). When consumers switch from their existing service provider, many established relationships with that service provider are likely to deteriorate and dissolve (Al-kwifi et al. 2014; Annala et al. 2013; Gustafsson et al. 2005). As a consequence, dissatisfied switchers can generate negative word of mouth reviews that can damage a firm’s reputation and brand image (Lopez et al. 2006). In addition, the firm needs to spend money to attract new consumers through ad-vertising and offering promotional or initial discounts (Lopez et al. 2006). In fact, some business analysts have indicated that the costs of gaining new consumers are five times more expensive than those of maintaining the current consumers (Keiningham et al. 2005; Mittal and Lasser 1998). Hence, the effort to retain current consumers is much more worthwhile than searching for new ones (Liu et al. 2014). Due to these serious problems, researchers and practitioners are very con-cerned about understanding the issues that relate to keeping consumers loyal and reduc-ing the switchreduc-ing rate in their industries.
Past research has studied ‘consumer innovativeness’ in relation to variables such as: (i) perceived risk (Hirunyawipad and Paswan 2006), (ii) product interest (Robertson 1968), (iii) self-congruence (Cowart et al. 2008), (iv)
consumers personality traits (Donnelly and Ivancevich 1974), (v) product involvement
(Wang et al. 2006), and (vi) purchase and con-sumption characteristics (Taylor 1977). However, none of these studies examined the influence of consumer innovativeness on loyalty or switching behaviour. For the present study consumer innovativeness is considered as the user’s intrinsic motivation to explore another service provider’s network and/or to switch to an upgraded package (such as a SMART phone), even if it is offered by the same ser-vice provider, for example Maxis customers switching to its I-phone service offering, and/or switching to another new package. As such, consumer innovativeness can be stimu-lated not only by the network services but also by other embedded products and service offerings. Hence, innovativeness in the mo-bile phone service context and its link to ser-vice loyalty are issues worthy of research.
After introducing the ‘Mobile Number Portability’ (MNP) regulation in Malaysia on the 15th of October 2008, competition among
veri-fying the service switching costs effect on loyalty.
Considering this, the present study at-tempts to examine the effect of consumer innovativeness, ser vice quality, ser vice switching costs and service satisfaction on service loyalty among the mobile phone ser-vice users. The rest of the paper is four fold. In the next section a literature review and the hypotheses development is discussed. The following section discusses the methodology adopted in this study, followed by our find-ings and discussion. The last section draws conclusions and elaborates further on any implications and future research directions.
Theoretical Underpinning
Theory plays a great role in utilizing the hypothetic-deductive technique (Greenwald and Pratkins 1988). In this type of research, hypotheses are formulated on the basis of theoretical assumptions, and then the derived hypotheses are tested empirically (Kuhn 1962). As the present study has adopted the hypothetico-deductive method to achieve its research purpose, the Expectancy-Discon-firmation Theory (EDT) (Oliver 1980), as well as exploratory buyer behaviour theory (Baumgartner and Steenkamp 1996; Raju 1980) have been considered to support the proposed relationships among the study con-structs.
The EDT suggests that consumer sat-isfaction is the consumers’ overall evaluation of a product or service which derives from the comparison between the consumers’ pre-purchase expectations and the perceived ser-vice quality (Oliver 1980, 1997). According to Oliver (1997: 13), “Satisfaction is the consumer’s fulfilment response”. This ful-filled state is the function of the consumers’ judgement of the overall service quality
(Anderson and Sullivan 2003; Zeithaml and Bitner 1996). Under this theory, consumers modify and update their overall attitude to-wards the service quality based on their sat-isfaction of this instance of use, and this con-sequently leads to an intention to continue (or discontinue) the services (Oliver 1981; Yen and Lu 2008). Hence, service quality and satisfaction became the centre of research interest as the determinants of loyalty (see Khatabi et al. 2002; Mittal and Lassar 1998). Moreover, this theory gives rise to the idea that the repurchase intention occurred as a post satisfaction outcome (Oliver 1997). Hence, the present study considers service quality (performance) as an antecedent of service satisfaction and service satisfaction as an antecedent of service loyalty/switch-ing.
desire to fulfill one’s curiosity, also lead the individual to explore new and/or different products and services (Berlyne 1978). One of the major applications of this theory is to justify consumers’ innovativeness in product adoption (Mittelstaedt et al. 1976) and vari-ety seeking in product purchasing behaviour (McAlister and Pessimier 1982). Although consumer innovativeness has received con-siderable research attention in the field of consumer goods, comparatively less empiri-cal studies have been conducted on the topic in services. The present study assumes that due to the influence of the exploratory com-ponent, consumer innovativeness can reduce the magnitude of service satisfaction as well as ser vice loyalty. Thus, consumer innovativeness is considered as another in-fluential antecedent of service satisfaction and loyalty in mobile phone service usage.
Theoretical Framework and
Hypotheses Development
Conceptual Framework
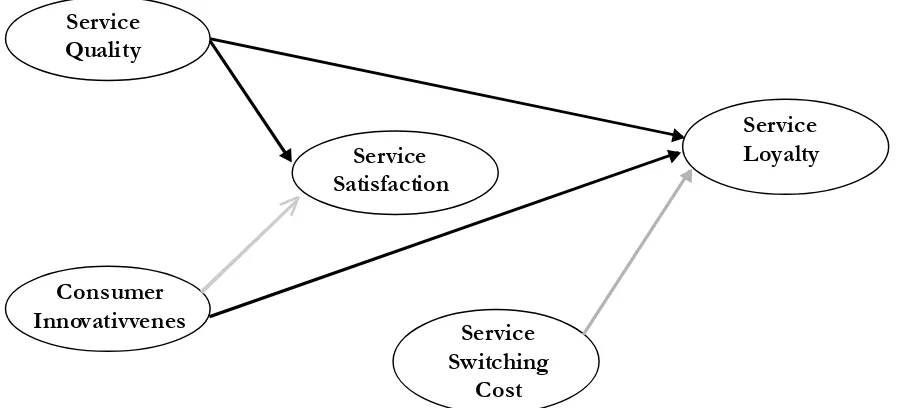
In this study it is proposed that service quality, ser vice satisfaction, and ser vice switching costs positively affect service loy-alty, whereas, consumer innovativeness nega-tively affects service loyalty. Furthermore, service satisfaction mediates the relationship between service quality and service loyalty.
Service Loyalty
Since its inception in the 1940s (see Guest 1942, 1944), the term ‘loyalty’ has re-ceived a considerable amount of research attention due to its various monetary and non-monetary benefits accruing to firms’ growth. Gaining competitive advantage (Bharadwaj et al. 1993), profitability, survival, success and growth,
(Reichheld 2002; Schultz 2005), and positive
word of mouth (Woratschek and Horbel 2003; Zeithaml et al. 1996) are only the tip of the iceberg. Therefore, customer retention has become the holy grail in industries from air-lines to wireless technologies (Bristow and Sebastian 2001; Coyles and Gokey 2005; Heskett 2002; Salegna and Goodwin 2005). Guest (1944) and Churchill (1942) be-gan to explore this phenomenon in the 1940s. Since then researchers have been trying to identify its nature, dimensions, antecedents, and consequences. Nowadays, many re-searchers perceive service loyalty as a multi-dimensional construct due to the importance and contribution of measuring service loy-alty to greater depths. It is argued that the attitudinal-cognitive-conative-affective loy-alty could strongly impact current and, more importantly, future consumer behaviour, which may be impossible to understand and difficult to predict without knowledge of these elements (Salegna and Goodwin 2005). Therefore, for the present study, service loy-alty is conceptualized as a multidimensional constr uct guided by the definitions of Gremler and Brown (1996) and Oliver (1997).
and maintenance services), Parasuraman et al. (1988) considered three months worth of experience in using these services as the quali-fying criteria for the respondents.
Consumer Innovativeness
As stated by Hirschman (1980, p. 283), “Few concepts in the behavioral sciences have as much immediate relevance to consumer behavior as consumer innovativeness”. It changes consumers’ routinized buying ten-dencies into a more dynamic behavior (Hirschman 1980, 1984). Although consumer innovativeness has been studied in different contexts, such as wine consumption (Gold-smith et al. 1998), high-tech durable prod-ucts (Kim et al. 2001), home entertainment equipment (Cowart et al. 2008), clothing pur-chases (Fowler and Bridges 2010), and the like, the literature has mainly addressed it for new products’ adoption and diffusion pro-cesses (see Cowart et al., 2008; Greenhalgh et al. 2005; Hirunyawipada and Paswan 2006; Hoffmann and Soyez 2010) and there
is not much discussion in the service litera-ture.
It is important to note that ‘service/ product innovativeness’ and ‘consumer innovativeness’ are two totally different as-pects of innovativeness. Another term for ser-vice/product innovativeness is the ‘posses-sion of newness’ which takes a product per-spective and refers to the goods/services ac-quiring some degree of ‘newness’ (Daneels and Kleinsmith 2001). On the other hand, consumer innovativeness or the ‘consump-tion of newness’ takes a consumer’s perspec-tive which implies a consumer’s propensity to purchase new products or services fre-quently and rapidly (Midgley and Dowling 1978). The present study considers inno-vativeness exclusively from the consumers’ perspective and defines it as the users’ intrin-sic motivation to explore different service offerings either from different service provid-ers or even when offered by the same service provider.
Consumer
Innovativvenes Service
Switching Cost Service
Quality
Service Satisfaction
Service Loyalty
>
Service Switching Cost
The service switching cost is the pen-alty that consumers have to pay for changing service providers (Aydin et al. 2005). This phenomenon has been discussed in several fields such as economics, psychology, em-ployee relations and marketing(Lin and Chou 2004; Zhu et al. 2011). Theoretically as well as empirically it is proven that switching costs contribute to repeat choice behavior (Weiss and Heide 1993), help to attain com-petitive advantage (Dubé et al. 2009; Klemperer 1995;Porter 1985), and enhance customers’ levels of price-tolerance and de-creases consumers’ sensitivity to the short-run fluctuations in customer satisfaction (Fornell 1992). Moreover, the switching cost is associated with higher profits (Beggs and Klempere 1992) and creates barriers to mar-ket entry (Karakaya and Stahl 1989). How-ever, Fornell (1992) mentioned one poten-tial disadvantage of the switching cost, that is the greater difficulty of capturing new cus-tomers when they are aware of the existence of barriers to them switching. Nonetheless, given its benefits, it seems that service firms need to manage their consumers’ perception towards switching costs, and must utilize marketing activities to benefit from this switching penalty (Burnham et al. 2003).
Service Satisfaction
Consumer satisfaction has been the sub-ject of many studies since the early 1970s (see LaTour and Peat 1979; Leavitt 1976). However, it is still the centre of attention for research into the field of marketing (Amin et al. 2013; Kursunluoglu 2014). Giese and Cote (2000) stated that consumer satisfaction is an emotive and/or cognitive response per-taining to a particular focus (expectations, product performance) which occurs after
purchase, choice or product experience has occurred.
Satisfaction can be either cumulative (overall) or transaction-specific (Bodet 2008; Jones and Suh 2000). Transaction-specific satisfaction indicates consumers’ satisfac-tion/dissatisfaction judgements of a single purchase experience or a particular service encounter (Anderson et al. 1994; Boulding et al. 1993). On the other hand, cumulative satisfaction/dissatisfaction is viewed as an overall evaluation of the total purchase ex-perience, or all previous service encounters with a particular product or service (Jones and Suh 2000). According to many researchers (e.g., Anderson et al. 1994; Bitner and Hubbert 1994; Olsen 2007), as overall satis-faction represents the consumers’ aggregate state of their level of satisfaction/dissatis-faction, rather than a specific transaction evaluation, overall satisfaction outweighs transaction specific satisfaction. In this way, it serves as a more appropriate and useful measure of a firm’s past, present and future performance evaluation criterion (Johnson et al. 2001; Oliver 1997). Following this con-vention, this study also considers service sat-isfaction as a cumulative process.
Service Quality
complicated to evaluate since service qual-ity is often linked with the service delivery process and its output (Cody and Hope 1999).
Service quality is a form of attitude which can be measured by assessing consum-ers’ quality perceptions of service firms’ ef-forts in fulfilling the service quality gaps. In addition, Gronroos (1984) defined service quality as what consumers receive (i.e., tech-nical quality) and how they get the techtech-nical outcomes, i.e., functional quality. The nature of service quality differs in different service contexts, particularly, in the telecommunica-tions service industry.
The term ‘quality’ began to receive wide attention from researchers in the 1980’s (see Gronroos 1984; Parasuraman et al. 1985, 1988; Zeithaml 1988; Zeithaml et al. 1988) as it serves as a differentiating strategy for the service providers and helps in gaining and creating a competitive advantage (Leisen and Vance 2001). Ensuring a ‘quality’ service is equally important for telecommunications service providers, as well as for other service providers, to establish and to maintain loyal consumers (Izogo and Ogba 2015; Zeithaml 2000). It is more crucial for the technology-based services (Ahn et al. 2006; Habib et al. 2011; Kumar and Lim 2008; Lai et al. 2009) due to the fact that in the absence of a stan-dard service quality, to sell the service is al-most impossible (Seo et al. 2008). Moreover, in the telecommunications industry, service quality is considered as an essential perfor-mance measurement indicator (Shin and Kim 2008). Additionally, in this industry, the ser-vice delivery system has the ability to enable the service providers to get actual customer feedback, and to understand their levels of satisfaction with the delivered ser vices (Johnson and Sirikit 2002). However, as ser-vice quality is abstract in nature (Parasuraman
et al. 1985; Zeithaml and Bitner 2000), it is a great challenge for the telecommunications service providers to deliver high standard services in a consistent manner (Haque et al. 2007).
Although the direct link between ser-vice quality and loyalty has been investigated in the telecommunications industry (Aydin and Ozer 2005; Eshghi et al. 2008; Lai et al. 2009) and in other service contexts (Ehigie 2006; Dean 2002; Kondasani and Panda 2015), these studies yielded mixed results, especially in the telecommunications indus-try. For example, Abod Ali et al. (2002) with the Digital (leased) line II service offered by Telekom Malaysia Berhad (TMB), Eshghi et al. (2008) with the Indian telecommunications service, and Aydin and Ozer (2005) with the Turkish GSM mobile phone service, found support for this relationship, whereas Lai et al. (2009) and Mohd Rafi et al. (2010) ob-tained insignificant results. Perhaps cultural idiosyncratic characteristics generated such variations in patterns and strengths of rela-tionships across cultures (Clark 1990; Lai et al. 2009). Hence, the present research exam-ines this relationship for post-paid users in the Malaysian mobile phone service context. Moreover, as most studies have found posi-tive links between these two constructs, the present study also assumes that high service quality will result in high mobile phone ser-vice loyalty.
service quality using the SERVQUAL dimen-sion, ignoring the technical aspects of qual-ity. It is argued that the structure of service quality measures varies depending on the nature and type of the different service in-dustries (e.g., Babakus and Boller 1992; Cronin and Taylor 1992). Hence, taking a multi-dimensional perspective for service quality, based on the functional and techni-cal aspects of quality, the present study hy-pothesized:
H1: The higher the (a) technical quality, (b) func-tional quality and (c) customer relationship com-petencies perceived by the mobile phone service users are, the more likely it is that they will be loyal to a particular service provider.
Service Quality (Functional,
Technical, Customer Relationship
Competencies) and Service
Satisfaction
In the field of consumer behavior, the expectancy-disconfirmation paradigm has contributed significantly in modelling cus-tomer satisfaction at the individual level, as well as on a national basis in Sweden (Fornell 1992), Canada (Turel and Serenko, 2006), USA (Fornell et al. 1996), and Turkey (Aydin and Ozer 2005). These models advocate con-sidering service quality as an antecedent of ser vice satisfaction. Using the EDT, Patterson (1993), Patterson et al. (1997), and Spreng et al. (1996), also support the use of performance perceptions (service quality) to measure satisfaction. Furthermore, on the basis of Chenet et al. (1999), Ennew and Binks (1999) and Woodruff’s (1997) work, Lai et al. (2009, p. 981) suggested that “the more cognitively-oriented service quality and value appraisals may lead to emotive satis-faction.”
Prior studies examined the link between service quality and service satisfaction and found support for this relationship across dif-ferent cultures (see Brady and Robertson 2001; Chen et al. 2012; Davis-Sramek et al. 2009; Ehigie 2006; Ueltschy et al. 2007 Yuen and Thai 2015). However, past research did also yield mixed results when examining this relationship. For example, in studying the Greek banking sector, Athanassopoulos (1997) contended that perceived service qual-ity results in service provider perceptions about customer satisfaction. Again, a study of a low-contact service context, which was servicing cars, Mittal and Lassar (1998) re-vealed that the service quality positively in-fluenced customers’ satisfaction. Similarly, Shin and Kim (2008) and Turkyilmaz and Ozkan (2007) found a significant direct as-sociation between service quality and cus-tomer satisfaction in the telecommunications industry. On the contrary, Harris and Goode (2004) found partial support, while Lai et al. (2009) and deRuyter et al. (1998) did not find any support for this relationship. Hence, to verify this relationship for mobile phone ser-vice usage, the present study hypothesized that:
H2: The higher the (a) technical quality, (b) func-tional quality and (c) customer relationship com-petencies perceived by mobile phone service us-ers are, the more likely it is that they will be satisfied with a particular service provider.
Service Satisfaction and Service
Loyalty
Cronin and Taylor 1992; Wang and Lo 2002). Although the positive relationship between satisfaction and loyalty has been proven to be true (Izogo and Ogba 2015; Kursunluoglu 2014; Mavri and Ioannou 2008; Quoquab et al. 2014; Yang and Peterson 2004), Mittal and Lassar (1998) raised an issue where a dissat-isfied customer might still continue his/her patronage if there is no better product/ser-vice from alternative sellers, and satisfied customers might be willing to switch to com-petitors in the hope of gaining even more satisfying results. However, for the present study, considering the positive relationship between these two constructs it is hypoth-esized that:
H3: Hypothesis 3: The higher the service satisfac-tion is, the more likely it is that the mobile phone service users will be loyal to a particular service provider.
Service Quality (Functional,
Technical, and Customer
Relationship Competencies),
Service Satisfaction and Service
Loyalty
According to Zeithaml and Bitner (1996), customers’ overall evaluation of ser-vice excellence is the major antecedent of customers’ satisfaction. On the other hand, satisfaction is proven to be a significant pre-dictor in explaining customers’ loyalty (e.g., Fornell et al. 1996; Kondasani and Panda 2015; Yang and Peterson 2004). As such, satisfaction exhibits a mediating influence between service quality and service loyalty. The EDT also supports this notion (see Oliver 1980, 1997). Under this theory, con-sumers modify and update their overall atti-tude towards service quality based on their satisfaction of its use, and consequently this
leads to an intention to continue using the service (Oliver 1981; Yen and Lu 2008).
A mediator variable helps in explaining
how or why a relationship persists between the predictor and outcome variable (Holmbeck 1997; Kim et al. 2001; Peyrot 1996). There-fore, it is more interesting to study a media-tor variable, rather than studying the predic-tor variable alone (Bennett 2000). Hence, considering service satisfaction as a media-tor between service quality and service loy-alty, will generate a deeper understanding of the relationship by providing the answer to why or how this relationship exists.
The mediation effect of satisfaction between service quality and loyalty in the telecommunications industry (Turel and Seranko 2006) as well as in other studies (Caruana 2002; Cronin and Taylor 1992; Ishak et al. 2006) has already been examined. Moreover, the view of the mediating relation-ship of satisfaction between service quality and service loyalty is embedded in the Cus-tomer Satisfaction Index (CSI) models under-lying the national satisfaction indices in sev-eral advanced countries (Aydin and Ozer 2005; Fornell et al. 1996; Turkyýlmaz and Ozkan 2007;Turel and Serenko 2006). How-ever, it is not yet conclusive whether the mediating effect of satisfaction is also appli-cable in the Malaysian mobile phone service context. Moreover, most of these studies considered loyalty as a uni-dimensional con-struct and used SERVQUAL as a basis for measuring service quality. Therefore, consid-ering loyalty as a multi-dimensional construct and combining technical, functional and cus-tomer relationship competency dimensions together, this study hypothesized that:
Service Switching Cost and
Service Loyalty
Switching costs are the economic, psy-chological, and social agents that pose barri-ers when considering switching service pro-viders (Aydin and Ozer 2005; Matzler et al. 2015; Park et al. 2014). Such costs are incor-porated in both the product and service sec-tors. They have significant influence on whether one should continue or stop patron-izing the current service provider (Chea and Luo 2005; Lin and Chou 2004). Different economic cost models into consumer behav-ior support this view (Hauser and Wernerfelt 1990; Payne 1982). Moreover, switching costs have been empirically proven as the antecedent of loyalty in different service con-texts (Dagger and David 2012; Yang and Peterson 2004, Yen 2010), as well as in tele-communications literature (Aydin and Ozer 2005; Ayding et al. 2005; Matzler et al. 2015). However, further studies need to be carried out to examine this relationship in the set-ting of different service industries and dif-ferent countries. Furthermore, as the use of mobile phone services is voluntary, requires a long term relationship, and physical prox-imity is less necessary, it is necessary to ex-amine the effect of service switching costs on service loyalty, in order to understand how it varies from other services such as car in-surance (obligatory use), health, education or law services (where physical proximity is a must).
Even though MNP makes it easier to switch service providers (Lee et al. 2006; Shin and Kim 2008), there is evidence of other kinds of service switching costs in the telecommunications market (Lee et al. 2006; Shin and Kim 2008). Therefore, after the implementation of the MNP regulation in Malaysia in the middle ofOctober 2008, it is
necessary to examine the effect of service switching costs on consumers’ loyalty pat-terns. The following is thus hypothesized:
H5: The higher the service switching costs are, the more likely it is that the mobile phone service users will be loyal to a particular service pro-vider.
Consumer Innovativeness and
Service Loyalty
Based on the exploratory buyer behav-ior theory (Berlyne 1963), this research pro-poses that, ‘consumer innovativeness’ may have a negative influence on loyalty towards the service provider. It has been argued that innovative consumers are disposed to obtain more information and ideas about new prod-ucts and services than others (Midgley and Dowling 1978). Not surprisingly, this type of consumer exhibits higher levels of aspiration for innovative and unique products and ser-vices and thus, they are likely to try new brands (Xie 2008). Cowart et al. (2008) also supported this view and stated that consumer innovativeness affects behavioral intentions for new products. Therefore, it is logical to assume that consumers who have a greater propensity to search for new ideas, informa-tion or ‘newness’ will become switchers, whereas those who have less or no propen-sity to search for ‘newness’ tend to be more loyal towards their brand or services. How-ever, there is a dearth of research that exam-ines the effect of consumer innovativeness on loyalty. Therefore, in an attempt to fill this gap, the following hypothesis is developed to verify its applicability in the context of mo-bile phone services:
Consumer Innovativeness and
Service Satisfaction
According to Midgley (1977), innova-tive-ness is an innate expression of a person’s psychological or sociological characteristic. It is argued that, consumer innovativeness is the degree to which an individual makes in-novative decisions independently of the com-municated experience of others (Midgley and Dowling, 1978). As such, consumer inno-vativeness can be treated as a psychological characteristic that has a considerable effect on consumers’ evaluation processes as well as their product/service choices.
The theory of exploratory buyer behav-ior suggests that the desire for exploration is one of the most useful motivating factors that influence buying behavior (Baumgartner and Steenkamp 1996; Raju 1980). Again, EDT advocates that expectations play a crucial role in the formation of a satisfaction judge-ment (Oliver 1980). In this process, discon-firmation occurs when there is a significant difference between an individual’s initial ex-pectations and the actual performance of the product/service (Jayanti and Jackson, 1991). Based on this argument, it can be assumed that individuals’ whose innovativeness lev-els are high, are likely to explore more and expect more, and thus it is difficult to make them contented. Therefore, the following hypothesis is suggested:
H7: The higher the consumer innovativeness is, the less likely it is that the mobile phone service users will be satisfied with a particular service provider.
Methods
As the objective of this study is to ex-amine the service loyalty and switching be-havior of mobile phone service users, indeed
the population consisted of individuals. The results of a survey conducted by the Malay-sian Communications and Multimedia Com-mission (MCMC) (2005, 2006, and 2009) generated the idea that a major portion of the mobile phone users fall in two major cat-egories: employed users (about 53%) and stu-dents (almost 25%). Hence, this study tried to capture both categories of users, that is, students and employed individuals as the sub-jects for this study; more specifically, aca-demic and non-acaaca-demic staff (including ad-ministrative, managerial, clerical and techni-cal staff) and postgraduate students.
This study employed the drop-off method (self-administered) to administer the questionnaire. 1,050 questionnaires were dis-tributed in seven high ranked universities lo-cated in the Klang Valley area, which yielded 535 valid usable completed responses. All scales to measure the study’s constructs were borrowed from past literature using a 5 point Likert scale, where 1= ‘strongly disagree’ and 5= ‘strongly agree.’
philosophical position (Little et al. 2002). This technique has received research inter-est due to its numerous benefits, such as (1) it may provide a useful approximation to con-tinuous scales, (2) it provides a more stable result than is often obtained with item-based analyses, and (3) it creates indicators with greater reliability and more definitive rota-tional results (Cattell and Burdsal 1975)
In the present study, the item parcelling method was used for the service loyalty and ser-vice switching constructs due to three reasons: (1) to simplify the complex research model while maintaining the large number of items for the service loyalty construct (Garver and Mentzer 1999; Hair et al. 2006), (2) to avoid the distortion by idiosyncratic characteristics of individual items (Little et al. 2002), and (3) to make the data conform to the assump-tion of normality as required in an SEM esti-mation (Little et al. 2002). In essence, the main focus was to achieve a more parsimoni-ous estimation by using this process.
In the present study, the parcelling pro-cedure was carried out based on content simi-larity, rational grounds, observing the inter-nal consistency, and factor loadings and the model’s fit of the construct’s measurement model. More clearly, once the content simi-larity and theoretical rational have been es-tablished, the internal consistency was proven to meet the required expectations ( > 0.7), and the CFA results of the construct showed a good factor loading and overall model fit, the items were parcelled.
Researchers should be aware that par-celling requires items within each set to be uni-dimensional, which means that they are known to measure a single constr uct (Bandalos and Finney 2001). This knowledge may come from familiarity with the item do-main (Hair et al. 2006; Kline 2005) or as the
result of prior statistical analysis that indi-cates uni-dimensional measurements (Kline 2005). In this study, uni-dimensionality was assured from the cursory review of past lit-erature. Moreover, as recommended by Hair et al. (2006), prior to our parcel, CFA was performed on the individual factors to check for uni-dimensionality, to see (1) whether the constructs were reflected by all the individual items related to the other constructs and (2) was a construct reflected by a smaller num-ber of parcels. During this process, items with a low loading and cross-loading into the other variables were deleted to assure uni-dimen-sionality. After it was found that items were highly loaded (mostly 0.8 and above), item parcelling was performed.
The scale to measure technical quality and functionality was borrowed from Kim et al. (2004), whereas, the customer relationship competencies scale was borrowed from Lai et al. (2007). Lai et al.’s (2007) customer re-lationship competencies scale was developed based on Parasuraman et al.’s (1988) scale. Since Kim et al.’s (2004) scale does not cover all aspects of functional quality, Lai et al.’s (2007) scale was also incorporated, in order to address the greater number of service quality features. Additionally, the service switching costs and service satisfaction scales were adapted from Aydin and Ozer (2005). Lastly, the consumer innovativeness scale was borrowed from Raju (1980). All items to measure the study’s constructs are shown in Table 1.
Table 1. Items to Measure the Study Constructs
Constructs Items
Service Loyalty Behavioural loyalty
I use only this SP.If XYZ SP were to raise the price by 10 percent,
I would likely remain.
I do not mind using more than one SP’s services. (R)*
Attitudinal loyalty
I will encourage friends and relatives to do business with XYZ SP.
I will recommend XYZ SP to someone who asks my advice. I say positive things about XYZ SP to other people.
Cognitive loyalty
I believe that the range of services of my SP is very suited to what I like. I believe that XYZ SP has the best offers at the moment.
To me, this SP would rank first among the other SPs. XYZ SP provides superior service in every way.
I believe that the overall quality of XYZ SP’s service is of a very high standard.
Affective loyalty
I prefer XYZ SP to other SPs in this category.
I have a positive attitude toward this SP.
I like the performance and services of the SP. I like this SP’s terms and conditions.
The SP I use reflects a lot about who I am.
Conative loyalty
I consider myself to be highly loyal to XYZ SP.
I will remain a customer of the SP I have chosen.
Service Quality Technical quality
I get a variety of value added services from my SP.
The offered value added services are easy to use. The offered value added services are up-to-date.
Functional quality
Staff are friendly when subscribing to this SP. I get adequate customer support from my SP.
The speed of complaint processing is satisfactory. It is easy to report my complaint to my SP.
Customer Relationship Competencies
The service provided by the company is prompt (low waiting time and quick response).
Employees are efficient and competent, knowledgeable and skilful. Employees are courteous, polite and respectful.
(AMOS) Version 5.0 (Arbuckle 1994-2003) with Maximum Likelihood Estimation (MLE) was utilized to perform Confirmatory Factor Analysis (CFA) and covariance structure analysis or SEM.
Findings and Discussion
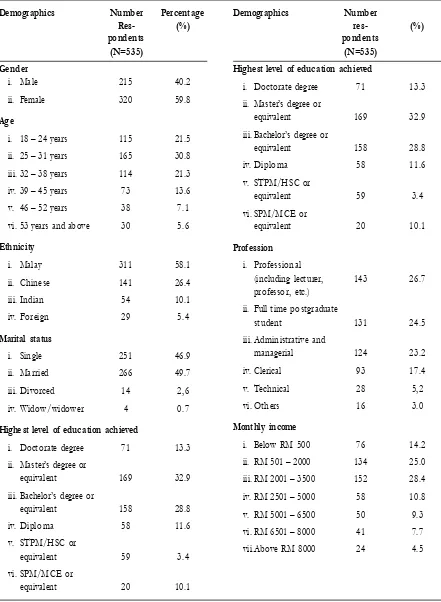
Profile of the Respondents
The study sample comprised respon-dents who varied in gender, age, marital sta-tus, profession, income, ethnicity, and level of education. More than 50 percent of the respondents were female (59.8%). Most of the respondents ages (51%) were between 18 and 31 years. The majority of the participants were Malays (58.1%) and married (49.7%). With respect to their educational background,
the bulk of the respondents have a master’s degree (32.9%). And the results of the de-scriptive analysis show that 28 percent of the participants have a income ranging between RM 2001 and RM 3500 per month.
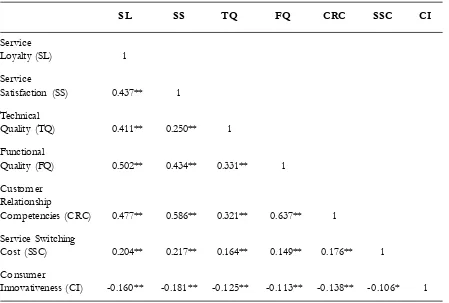
Correlation Analysis
In this study, correlation was used to assess the degree of association among the variables, and to detect bivariate multico-llinearity. According Tabachnick and Fidell (1989), association values that exceed 0.9 indicate multicollinearity. Table 3 exhibits the bivariate correlation with a two-tailed test of significance p<0.01 and p<0.05 for all the variables involved in this study. The correla-tion results between variables show positive and negative significant associations at (p<0.01). Moreover, none of these values Table 1. Continued
Constructs Items
Service Satisfaction I am fully satisfied with XYZ SP.
When I have experienced unforeseen or critical situations, XYZ SP has managed these
in a satisfactory manner.
This SP meets my pre-purchase expectations.
I am happy with the efforts this SP is making towards regular consumers like me.
Service Switching Costs If I switch to a new SP, I would lose loyalty points, bonus Ringgits etc. that I have
gained with my current SP.
If I switch to a new SP, with a technology upgrade, I could not use some services until I
learn to use the new phone and services effectively.
If I switch to a new SMART phone offer, I could not use some services until I learn to
use the new phone and services effectively.
Comparing information regarding all SP’s offerings with one another takes a lot of
energy, time and effort.
Consumer Innovativeness I would get tired of using my SP for a long time because the SP does not have any good
offers compared to other competitors’ offers.
I like to switch my SP to try something different.
When I see that new features/options provided by other SPs are somewhat different
from the usual, I intend to try it.
Table 2. Profile of the Respondents
Demographics Number Percentage
Res- (%)
pondents (N=535) Gender
i. Male 215 40.2 ii. Female 320 59.8
Age
i. 18 – 24 years 115 21.5 ii. 25 – 31 years 165 30.8 iii. 32 – 38 years 114 21.3 iv. 39 – 45 years 73 13.6 v. 46 – 52 years 38 7.1 vi. 53 years and above 30 5.6
Ethnicity
i. Malay 311 58.1 ii. Chinese 141 26.4 iii. Indian 54 10.1 iv. Foreign 29 5.4
Marital status
i. Single 251 46.9 ii. Married 266 49.7 iii. Divorced 14 2,6 iv. Widow/widower 4 0.7
Highest level of education achieved
i. Doctorate degree 71 13.3 ii. Master’s degree or
equivalent 169 32.9 iii. Bachelor’s degree or
equivalent 158 28.8 iv. Diploma 58 11.6 v. STPM/HSC or
equivalent 59 3.4 vi. SPM/MCE or
equivalent 20 10.1
Demographics Number
res- (%)
pondents (N=535) Highest level of education achieved
i. Doctorate degree 71 13.3 ii. Master’s degree or
equivalent 169 32.9 iii. Bachelor’s degree or
equivalent 158 28.8 iv. Diploma 58 11.6 v. STPM/HSC or
equivalent 59 3.4 vi. SPM/MCE or
equivalent 20 10.1
Profession
i. Professional
(including lecturer, 143 26.7 professor, etc.)
ii. Full time postgraduate
student 131 24.5 iii. Administrative and
managerial 124 23.2 iv. Clerical 93 17.4 v. Technical 28 5,2 vi. Others 16 3.0
Monthly income
exceed 0.90 which means multicollinearity was not a problem in this study.
Measurement Model
Analysis of the full measurement model was done by correlating all variables involved in the structural model. Every variable is as-sumed to be correlated with each other. Modi-fication indices and the standardized residual were examined to see whether there was any misspecification in the model to fulfill the requirement for the uni-dimensionality of the constr ucts (Byrne 2010). The result of the goodness of fit measures indicates a well-fit-ting model with / df = 2.689; GFI = 0.882; AGFI = 0.856; TLI = 0.924; CFI = 0.934; NFI = 0.901; IFI = 0.934; and RMSEA = 0.056.
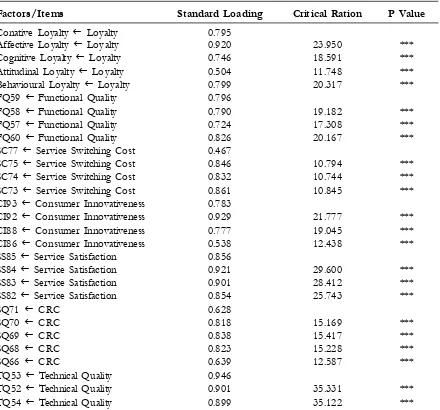
Convergent Validity
From the inspection of the standardized regression weight, it was found that all the items were significantly loaded into their in-tended factors with standard loadings rang-ing from 0.467 to 0.946 (see Table 4) (Churchill 1979), which assures convergent validity. In CFA, the critical ratio for factor loadings is often used to assess convergent validity. Table 4 also indicates that the Criti-cal Ration (CR) for all estimated parameters exceeded the ±1.96 benchmark (Arbuckle and Wothke 1999), which were also found to be statistically significant.
The results of the AVE calculation shown in Table 5 reveals that variance ex-tracted for all the constructs ranged from
SL SS TQ FQ CRC SSC CI
Service
Loyalty (SL) 1 Service
Satisfaction (SS) 0.437** 1 Technical
Quality (TQ) 0.411** 0.250** 1 Functional
Quality (FQ) 0.502** 0.434** 0.331** 1 Customer
Relationship
Competencies (CRC) 0.477** 0.586** 0.321** 0.637** 1 Service Switching
Cost (SSC) 0.204** 0.217** 0.164** 0.149** 0.176** 1 Consumer
Innovativeness (CI) -0.160** -0.181** -0.125** -0.113** -0.138** -0.106* 1
*P<0.05, **p<0.01
Factors/Items Standard Loading Critical Ration P Value
Conative Loyalty Loyalty 0.795
Affective Loyalty Loyalty 0.920 23.950 *** Cognitive Loyalty Loyalty 0.746 18.591 *** Attitudinal Loyalty Loyalty 0.504 11.748 *** Behavioural Loyalty Loyalty 0.799 20.317 *** FQ59 Functional Quality 0.796
FQ58 Functional Quality 0.790 19.182 *** FQ57 Functional Quality 0.724 17.308 *** FQ60 Functional Quality 0.826 20.167 *** SC77 Service Switching Cost 0.467
SC75 Service Switching Cost 0.846 10.794 *** SC74 Service Switching Cost 0.832 10.744 *** SC73 Service Switching Cost 0.861 10.845 *** CI93 Consumer Innovativeness 0.783
CI92 Consumer Innovativeness 0.929 21.777 *** CI88 Consumer Innovativeness 0.777 19.045 *** CI86 Consumer Innovativeness 0.538 12.438 *** SS85 Service Satisfaction 0.856
SS84 Service Satisfaction 0.921 29.600 *** SS83 Service Satisfaction 0.901 28.412 *** SS82 Service Satisfaction 0.854 25.743 ***
SQ71 CRC 0.628
SQ70 CRC 0.818 15.169 ***
SQ69 CRC 0.838 15.417 ***
SQ68 CRC 0.823 15.228 ***
SQ66 CRC 0.639 12.587 ***
TQ53 Technical Quality 0.946
TQ52 Technical Quality 0.901 35.331 *** TQ54 Technical Quality 0.899 35.122 ***
Table 4. Testing Convergent Validity on the Basis of Factor Loadings
Table 5. Variance Extracted of Indicators
Constructs Variance extracted
Benchmark Value Threshold level 0.5
Behavioural loyalty 0.841 Attitudinal loyalty 0.652 Cognitive loyalty 0.566 Affective loyalty 0.568 Conative loyalty 0.723 Service satisfaction 0.763
Constructs Variance extracted
Benchmark Value Threshold level 0.5
Technical quality 0.838 Functional quality 0.616 Customer relationship 0.570 competencies
0.558 to 0.841 which exceeded the recom-mended threshold level of 0.5 (Hair et al. 2006) These results show that variance due to measurement error was smaller than vari-ance captured by the constructs and thus falls within the acceptable range of the validity of the constructs.
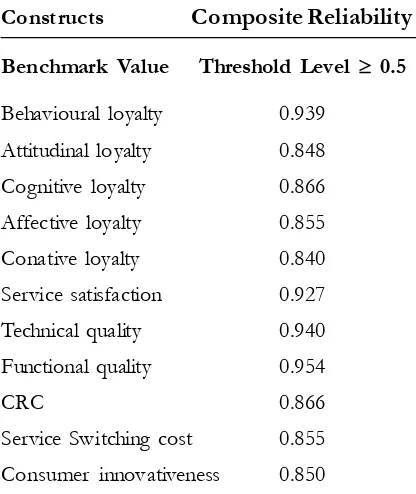
In assessing the reliability of the latent variables, utilizing the composite reliability is a better option than using only Cronbach’s coefficient alpha, as it is argued that Cronbach’s coefficient alpha ignores the unique contribution of each indicator vari-able and assumes the equal error variance for all the indicators of a construct (Cortina 1993). Therefore, in this study the results of the constructs’ reliability (composite reliabil-ity), which is often used in conjunction with SEM models (Hair et al. 2006) are presented in Table 6, in order to prove that convergent validity exist for the constructs of the study.
Here, standardized loadings can be ob-tained from the AMOS output, and j is the measurement error for each indicator. The measurement error is calculated as 1.0 minus the reliability of the indicator (the square of the indicator’s standardized loading). The re-sults given in Table 6 suggest that all com-posite reliability values were above the thresh-old level of 0.7. Hence, convergent validity and construct reliability were assured.
Discriminant Validity
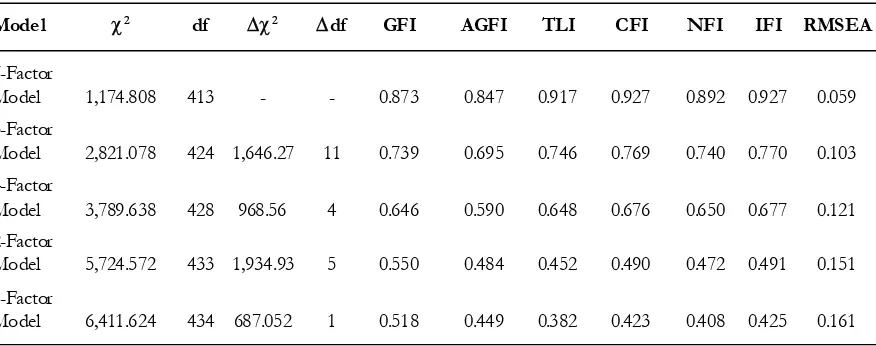
Discriminant validity exists when uni-dimensionality is confirmed among the vari-ables. In this regard, the results of the indi-vidual CFA and full measurement model in-dicate that all the items were significantly loaded into their intended factors with a stan-dard loading. Moreover, following the sugges-tion of Jöreskog (1971) and Bagozzi and Phillips (1982), the chi-square difference tests were employed for an eight-factor model (the measurement model) which was compared against seven-factor, five-factor, four-factor, two-factor, and one-factor models. The re-sults shown in Table 7 indicate the signifi-cant chi-square differences. The critical value ( > 3.84, df = 1) is exceeded in all cases and hence assures the presence of discrimi-nant validity.
The measurement model was treated as a seven-factor model. Again, in the five-fac-tor model, all three service quality dimensions were loaded into one factor, while in the four-factor model, service satisfaction was loaded with service loyalty and service switching. Furthermore, in the two-factor model, ser-vice quality, serser-vice switching costs and con-sumer innovativeness were loaded together. Lastly, in the one-factor model, all the items were loaded into a single factor.
Table 6. Construct Reliability
Constructs Composite Reliability
Benchmark Value Threshold Level 0.5
Behavioural loyalty 0.939 Attitudinal loyalty 0.848 Cognitive loyalty 0.866 Affective loyalty 0.855 Conative loyalty 0.840 Service satisfaction 0.927 Technical quality 0.940 Functional quality 0.954
CRC 0.866
Structural Model
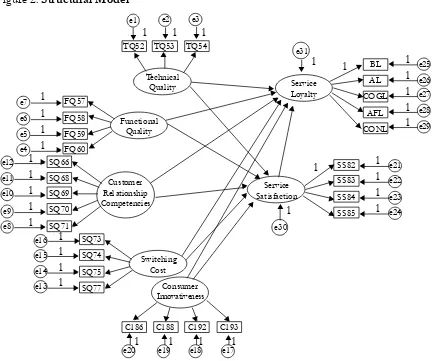
The structural model was tested after getting adequate information to allow us to proceed from the previous series of analy-ses, such as assessing the SEM requirement, examining the measurement models’ fit, reli-ability tests, convergence and discriminant analysis, and mediation effect analyses. The hypothesized relationships of the structural model were tested based on the goodness of fit indices. The result indicates that the hy-pothesized model has an acceptable fit with
/df = 2.491; GFI = 0.90; AGFI = 0.866; CFI = 0.942; TLI = 0.933; NFI = 0.907; IFI = 0.942; and RMSEA = 0.053. The struc-tural model is shown in Figure 2.
A summary of the standardized path coefficients for the structural model is pre-sented in In Table 1, the hypothesized rela-tionships under examination for the present study, the standard errors of estimates, and the critical ratios for estimates that are asso-ciated with the p-values are presented. Fol-lowing the common practices in the previous literature, to accept the hypotheses, p-values < 0.001 (considering 99.9% confidence in-terval and denoted as ***), p < 0.01 (consid-ering 99% confidence interval and denoted
as **), p < 0.05 (considering 95% confidence interval and denoted as *), and p < 0.1 (con-sidering 90% confidence interval and denoted as †) are considered (see Ahn et al. 2006; Bagozzi and Yi 1988;Shin and Kim 2008).
Mediation Effect Test
The first three mediation tests were con-ducted to examine the relationship among functional quality service satisfaction
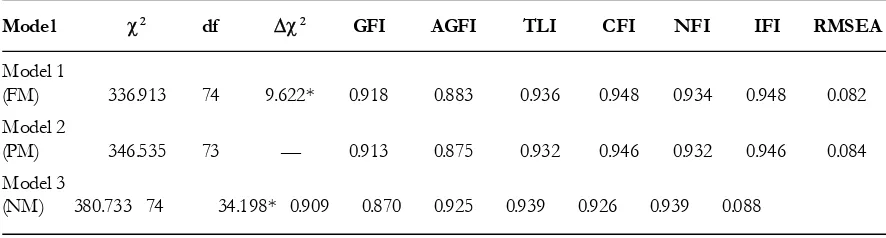
service loyalty, and technical quality ser-vice satisfaction service loyalty and CRC service satisfaction service loyalty. In short, service satisfaction was treated as the mediator in the relationship between the three dimensions of service quality and service loyalty. The results in Tables 8, 9 and 10 show the mediation test results among the stated relationships. For all three tests, the results indicate a significant improvement of fit from the partially mediated model to fully medi-ated model ( = 42.716, = 71.595,
= 9.622 respectively) and also a signifi-cant improvement between the partially-me-diated model and the non-mepartially-me-diated model ( = 66.786; = 28.716; = 34.198 respectively). Since all comparisons showed a significant improvement, an examination of Table 7. Test for Discriminant Validity - CFA Comparison of the Measurement Models
Model df df GFI AGFI TLI CFI NFI IFI RMSEA
7-Factor
Model 1,174.808 413 - - 0.873 0.847 0.917 0.927 0.892 0.927 0.059
5-Factor
Model 2,821.078 424 1,646.27 11 0.739 0.695 0.746 0.769 0.740 0.770 0.103
4-Factor
Model 3,789.638 428 968.56 4 0.646 0.590 0.648 0.676 0.650 0.677 0.121
2-Factor
Model 5,724.572 433 1,934.93 5 0.550 0.484 0.452 0.490 0.472 0.491 0.151
1-Factor
/df = 2.491; GFI = 0.9; AGFI = 0.866; CFI = 0.942; TLI = 0.933; NFI = 0.907; IFI = 0.942; RMSEA = 0.053 Note: *** significant at p<0.001, ** significant at p<0.01, * significant at p<0.05,
† significant at p<0.1.
ns: not significant, e: error term, and res: residual.
e1 e2 e3
Figure 2. Structural Model
Table 8. Technical Quality Service Satisfaction Service Loyalty
Model df GFI AGFI TLI CFI NFI IFI RMSEA
Model 1
(FM) 293.286 50 42.716* 0.915 0.867 0.937 0.952 0.943 0.952 0.095
Model 2
(PM) 250.570 49 — 0.928 0.885 0.947 0.960 0.951 0.961 0.088
Model 3
the goodness of fit of the nested model needed to be done to identify the best model. Based on an examination of the result of the goodness of fit indices, it is ascertained that service satisfaction partially mediates the
re-lationship between technical quality and ser-vice loyalty, and also between functional quality and service loyalty, whereas it fully mediates the relationship between CRC and service loyalty.
Table 9. Functional Quality Service Satisfaction Service Loyalty
Model df GFI AGFI TLI CFI NFI IFI RMSEA
Model 1
(FM) 316.238 62 71.595* 0.917 0.878 0.932 0.946 0.934 0.946 0.088
Model 2
(PM) 244.643 61 — 0.933 0.901 0.950 0.961 0.949 0.961 0.075
Model 3
(NM) 273.359 62 28.716* 0.929 0.896 0.943 0.955 0.943 0.955 0.080
Table 10. CRC Service Satisfaction Service Loyalty
Model df GFI AGFI TLI CFI NFI IFI RMSEA
Model 1
(FM) 336.913 74 9.622* 0.918 0.883 0.936 0.948 0.934 0.948 0.082
Model 2
(PM) 346.535 73 — 0.913 0.875 0.932 0.946 0.932 0.946 0.084
Model 3
(NM) 380.733 74 34.198* 0.909 0.870 0.925 0.939 0.926 0.939 0.088
Table 8. Technical Quality Service Satisfaction Service Loyalty
Model df GFI AGFI TLI CFI NFI IFI RMSEA
Model 1
(FM) 293.286 50 42.716* 0.915 0.867 0.937 0.952 0.943 0.952 0.095
Model 2
(PM) 250.570 49 — 0.928 0.885 0.947 0.960 0.951 0.961 0.088
Model 3
Discussion
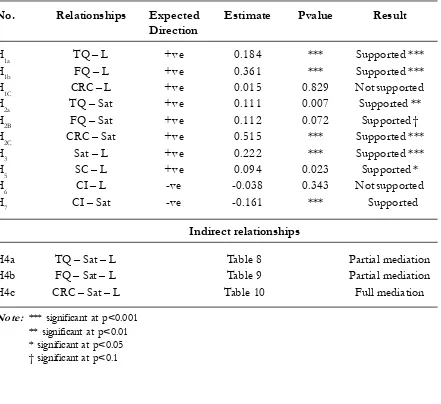
All the hypotheses and their test results are shown in Table 11. The results suggest that only two dimensions of service quality (technical and functional) are positively and significantly related to service loyalty ( =
0.184, p < 0.001 and = 0.361, p < 0.001 respectively). Hence hypotheses H1a, H1b are supported. On the other hand, customer lationship competency is not significantly re-lated to service loyalty thus, H1c ( = 0.015, p = 0.829) is rejected. The plausible expla-nation for this may be due to the reason that,
unlike pre-paid users, post-paid users may feel very little need for customer relationship competencies from their SPs, as they seldom interact with the mobile phone service staff. Furthermore, customer support and conve-nient procedures (functional quality) seem to be more important to them, instead of re-sponsiveness, assurance and empathy. This finding is also supported by Lai et al. (2009). They reported that SERVQUAL dimensions did not substantiate the quality-loyalty rela-tionship in the Chinese telecommunications context.
Table 11. Summary of the Hypotheses Test Results
No. Relationships Expected Estimate Pvalue Result
Direction
H1a TQ – L +ve 0.184 *** Supported ***
H1b FQ – L +ve 0.361 *** Supported ***
H1C CRC – L +ve 0.015 0.829 Not supported
H2a TQ – Sat +ve 0.111 0.007 Supported **
H2B FQ – Sat +ve 0.112 0.072 Supported †
H2C CRC – Sat +ve 0.515 *** Supported ***
H3 Sat – L +ve 0.222 *** Supported ***
H5 SC – L +ve 0.094 0.023 Supported *
H6 CI – L -ve -0.038 0.343 Not supported
H7 CI – Sat -ve -0.161 *** Supported
Indirect relationships
H4a TQ – Sat – L Table 8 Partial mediation
H4b FQ – Sat – L Table 9 Partial mediation
H4c CRC – Sat – L Table 10 Full mediation
All three hypotheses related to service quality dimensions and service satisfaction (H2a, H2b and H2c) are supported ( = 0.111, p < 0.05, = 0.112, p < 0.1 and = 0.515, p < 0.001 respectively). In addition, service satisfaction is positively related to service loyalty. Thus, H3 ( = 0.222, p < 0.001) is
accepted. These findings are in accordance with the EDT which suggests that product/ service performance positively affects con-sumers’ satisfaction states which ultimately leads to customer retention.
Evidence shows that service switching costs are positively related to service loyalty which supports H5 ( = 0.094, p < 0.05). Table 11 also shows that service satisfaction is positively and significantly related to ser-vice loyalty (=0.222, p>0.01), which pro-vides support for H3. Consumer inno-vativeness is not significantly related to ser-vice loyalty. Hence, H6 is rejected (= -0.038,
p = 0.343). For the present study, the plau-sible explanation for not having a significant effect between consumer innovativeness and service loyalty can be due to the existence of the switching costs. In support of this view, in the Korean mobile phone market, Kim and Yoon (2004) found spuriously loyal consum-ers who were not willing to defect just be-cause of the switching costs.
As expected, hypothesis 7 is supported by the data which indicates that consumers’ innovativeness significantly and negatively affects the consumers’ service satisfaction (= -0.161, p<0.01). This finding is in line
with the theory of exploratory buyer behaviour. It is understood that the consum-ers with a high exploratory component tend to be dissatisfied since it is embedded in their characters to explore more and to seek for newness.
In testing the mediation effect of vice satisfaction, the results reveal that ser-vice satisfaction partially mediates the rela-tionship between ‘technical quality and service loyalty’ (Table 8) and ‘functional quality and ser-vice loyalty’, (Table 9). On the other hand, ser-vice satisfaction fully mediates the relation-ship between ‘CRC and service loyalty’. (Table 10) Thus, H4a, H4b, H4c are supported.
Conclusion, Limitations and
Future Research Directions
The objective of this study was to shed some light on the service loyalty issue in the Malaysian mobile phone service industry. The study’s results found that for enhancing ser-vice loyalty, serser-vice satisfaction plays the most influential role, followed by technical quality, functional quality, and service switch-ing costs. However, consumer innovativeness does not affect service loyalty. Moreover, satisfaction mediates the relationship be-tween service quality and service loyalty.
opera-tors (e.g., Internet, e-mail) can also benefit from the present study’s findings. This re-search comprises the important work of ex-amining the service switching costs effect on service loyalty/switching under the MNP policy, along with the presence of other con-tributing factors in mobile phone service us-age.
These findings provide an important basis for practitioners in formulating their service quality, service satisfaction, and ser-vice switching cost building strategies to mini-mize switching behaviour, as they will lead to better user retention. It was expected that the higher the level of service switching costs, the greater would be the likelihood that vice satisfaction would lead to greater ser-vice loyalty/lower serser-vice switching. It is evident that it influences service loyalty di-rectly. This finding implies that service satis-faction/dissatisfaction poses a stronger effect on service loyalty/switching rather than ser-vice switching costs. Moreover, while MNP has lessened the switching barrier effect, it does not eliminate it altogether. Hence, the service providers in a mature market, like the mobile phone service usage one, should de-velop strong service switching costs related to ‘adaptation costs’ and ‘benefit loss costs’ as well as other service switching costs (e.g., customer lock-in and creating high economic costs involved in switching to a new service provider, etc.) as the switching barrier to re-tain their users as a short term retention strat-egy. Consequently, it will help to support the breadth strategy. Furthermore, it is evident that service satisfaction is very crucial to building service loyalty. Thus, developing customer reward programs that concretely compensate customers, such as mileage pro-grams and price discounts, in order to increase service satisfaction as well as loss costs, can be another important strategy to consider. It
is also important to emphasize improving proper service quality elements to ensure long term loyalty, to maintain the growth of the industry (breadth strategy) as well as to con-tribute to the depth of usage. In this regard, service providers need to focus more on the technical, as well as the functional dimensions (as these two dimensions influence service loyalty both directly and indirectly) rather than customer relationship competencies to enhance service loyalty.
Although this research has provided rel-evant and interesting insights into the under-standing of service loyalty and ser vice switching, it is important to recognize some limitations associated with this study. Over-coming these limitations will open new av-enues for future research. The analysis of this study relies on cross-sectional data. Thus, to provide a more accurate causal interpretation of the relationship among the study variables, additional future research can be longitudinal
References
Khatibi, A. A., H. Ismail, and V. Thyagarajan. 2002. What drives customer loyalty: An analysis from the telecommunications industry. Journal of Targeting, Measurement and Analysis for Marketing 11(1): 34-44. Adham, K. A., and M. F. Said. 2011. DiGi.com: Strategies for capturing market share. Asian Journal of Case
Research 4 (1): 19-56.
Ahn, J., S. Han, and Y. Lee. 2006. Customer churn analysis: Chun determinants and mediation effects of partial defection in the Korean mobile telecommunications service industry. Telecommunications Policy
30: 552-568.
Al-Kwifi, S., U. Zafar, and A. D. Yammout. 2014. Brand switching of high-technology capital products: How product features dictate the switching decision. Journal of Product and Brand Management 23 (4/ 5): 322-332.
Anderson, R. E., and S. S. Srinivasan. 2003. E-satisfaction and e-loyalty: A contingency framework. Psychol-ogy and Marketing 20 (2): 123-138.
Anderson, E.W., C. Fornell, and D. R. Lehmann. 1994. Customer satisfaction, market share and profit-ability: Findings from Sweden. Journal of Marketing 58: 129-41.
Annala , S., S. Viljainen, and J. Tuunanen. 3013. Rationality of supplier switching in retail electricity markets.
International Journal of Energy Sector Management 7 (4): 459 – 477.
Arbuckle, J. L., and W. Wothke. 1999. AMOS 4.0 User’s Guide. Chicago: Smallwaters Corp.
Athanassopoulos, A. D. 1997. Another look into the agenda of customer satisfaction. International Journal of Bank Marketing 15 (7): 264–278.
Aydin, S., and G. Ozer. 2005. National customer satisfaction indices: An implementation in the Turkish mobile telephone market. Marketing Intelligence and Planning 23 (5): 486-504.
Aydin, S., G. Ozer, and O. Arasil. 2005. Customer loyalty and the effect of switching costs as a moderator variable. Marketing Intelligence and Planning 23 (1): 89-103.
Babakus, E., and G. W. Boller. 1992. An empirical assessment of the SERVQUAL scale: Journal of Business Research 24: 253-68.
Bagozzi, R. P., and L. W. Phillips. 1982. Representing and testing organizational theories. A holistic construal.
Administrative Science Quarterly 27: 459-489.
Bagozzi, R. P., and Y. Yi. 1988. On the evaluation of structural equation models. Journal of the Academy of Marketing Science 16 (1): 74-94.
Ball, D., P. S. Coelho, and M. J. Vilares. 2006. Service personalization and loyalty. Journal of Services Market-ing 20(6): 391–403.
Bandalos, D. L. and S. J. Finney. 2001. Item parceling issues in structural equation modeling. In G. A. Marcoulides and R. E. Schumacker (Eds.), New Developments and Techniques in Structural Equation Modeling (pp. 269-296). Mahwah, NJ: Law rence Erlbaum Associates, Inc.
Baumgartner, H., and J. B. E. M. Steenkamp. 1996. Exploratory consumer buying behaviour: Conceptualization and measurement. International Journal of Research in Marketing 13: 121-137. Beggs, A. and P. Klemperer. 1992. Multi-period competition with switching costs. Econometrica 60(3):
651-666.
Berlyne, D. E. 1960. Conflict, Arousal and Curiosity. New York: McGraw Hill Book Company, Inc. Berlyne, D. E. 1963. Motivational problems raised by exploratory and epistemic behaviour. In S. Koch
(Eds.), Psychology: A Study of Science 5: 284-364, New York: McGraw-Hill. Berlyne, D. E. 1978. Curiosity and learning. Motivation and Emotion 2: 97-175.
Bharadwaj, S. G., P. R. Vanradarajan, and J. Fahy. 1993. Sustainable competitive advantage in services industries: A conceptual model and research proposal. Journal of Marketing 57: 83-99.
Bitner, M. J., and A. R. Hubbert. 1994. Encounter satisfaction versus overall satisfaction versus quality. In R. T. Rust and R. L. Oliver (Eds.), Service Quality: New Directions in Theory and Practice (pp. 72-94). Thousand Oaks, CA: Sage.
Bodet, G. 2008. Customer satisfaction and loyalty in service: Two concepts, four constructs, several relationships. Journal of Retailing and Consumer Services 15: 156–162.
Boulding, W., A. Kalra, R. Staelin, and V. A. Zeithaml. 1993. A dynamic process model of service quality: from expectations to behavioural intentions. Journal of Marketing Research 30(February): 7-27. Brady, M. K., and Robertson, C. J. 2001. Searching for a consensus on the antecedent role of service
quality and satisfaction: Exploratory cross-national study. Journal of Business Research 51: 53-60. Bristow, D. N., and Sebastian, R. J. 2001. Holy cow! Wait’til next year! A closer look at the brand loyalty of
Chicago Cubs baseball fans. Journal of Consumer Marketing 18(3): 256-275.
Burnham, T. A., J. K. Frels, and V. Mahajan. 2003. Consumer switching costs: A typology, antecedents, and consequences. Journal of the Academy of Marketing Science 31 (2): 109-126.
Byrne, B. M. 2010. Structural Equation Modeling with AMOS: Basic Concepts, Application, and Programming (2nd
Eds.). Ney York: Routledge.
Caruana, A. 2002. Service loyalty: The effects of service quality and the mediating role of customer satisfaction. European Journal of Marketing 36 (7/8): 811-828.
Cattell, R. B. and C. A. Burdsal Jr. 1975. The radial parceling double factoring design: Solution to the item-vs.-parcel controversy. Multivariate Behavioral Research 10:165–179.
Chea, S., and M. M. Luo. 2005. E-service customer retention: The roles of negative affectivity and perceived switching costs. Proceeding of the Eleventh America Conference on Information System. Omaha, NE, USA.
Chenet, P., C. Tynan, and A. Money. 1999. Service performance gap: re-evaluation and redevelopment.
Journal of Business Research 46(2): 133–47.
Churchill, H. 1942. How to measure brand loyalty. Advertising and Selling, 35(24): 11-16.
Churchill, G.A. Jr. 1979. A paradigm for developing better measures of marketing ‘constructs. Journal of Marketing Research 16: 64-73.
Clark, T. 1990. International marketing and national character: a review and proposal for an integrative theory. Journal of Marketing 54 (4): 66–79.
Cody, K. and B. Hope. 1999. EX-SERVQUAL: an instrument to measure service quality of extranets.
Proceedings of the 10th Australasian Conference on Information Systems. Wellington.
Cortina, J. M. 1993. What is coefficient alpha? An examination of theory and applications. Journal of Applied Psychology 78(1): 98-104.