Geospatial Analysis and Turbidity Measurement for Monitoring
Suspended Solids of Hitotsuse Dam in Miyazaki Prefecture,
Kyushu, Japan
Purnama Budi Santosa 1, Yasuhiro Mitani 2
1)Dept. of Geodetic Engineering, Faculty of Engineering, Gadjah Mada University
2)Dept. of Civil & Structural Engineering, Faculty of Engineering, Kyushu University, Japan
Corresponding Email: purnamabs@ugm.ac.id
Abstract
The existence of suspended solids at Hitotsuse dam, Miyazaki Prefecture, Kyushu, Japan, has been the main concern of Kyushu Electric Power Company. These have been carried by rivers fl owing into the dam. In a long term, it is worried that this phenomenon will potentially cause the environmental degradation, especially around the dam, where the Kyushu Electric Power Plant is located. Therefore, necessary measures are required to protect the dam from environmental degradation, which in return is to assure its long term power plant operational. Preliminary studies found that the suspended solids, which was generated upstreams and was carried out into the dam by rivers, causes the turbid water resident. Therefore, evaluation on the potential sources of the existence of the suspended solids needs to be carried out. In this research, analysis was conducted to fi gure out the spatial distribution and the quantity of the suspended solids. For this purpose, by focusing attention on the upper river basin of reservoir, several factors which are possible to cause turbid water are extracted and analyzed quantitatively by using GIS. To understand the characteristic of the river turbidity, river fl ows and river turbidity are measured at several selected stations. Then mechanical factors causing turbid water are identifi ed after analyzing relationship between effl ux characteristics and possible factors that induce the presence of suspended solids. The results show that spatial information extraction could be done effi ciently by applying spatial analysis method. Furthermore, by applying multiple regression analysis, it was found that landslide scars, artifi cial forests, drainage area, and terrain undulation are indicated as the dominant factors causing the turbidity.
Keywords: GIS, river turbidity, suspended solids, hydrology, watershed
Abstrak
Keberadaan padatatan tersuspensi di dam Hitotsuse, Prefektur Miyazaki, Kyushu, Jepang, telah menjadi perhatian utama dari Perusahaan Listrik Kyushu. Material padat ini dibawa oleh sungai-sungai yang mengalir ke dalam dam. Untuk jangka panjang, dikhawatirkan fenomena ini berpotensi akan menyebabkan degradasi lingkungan, terutama di sekitar dam, di mana Perusahaan Listrik Kyushu berada. Oleh karena itu, diperlukan langkah-langkah yang diperlukan untuk melindungi dam dari degradasi lingkungan, dan untuk operasional pembangkit listrik untuk jangka panjang. Penelitian awal menemukan bahwa padatan tersuspensi, yang berasal dari hulu bagian atas daerah aliran sungai dan terbawa masuk ke dam melalui sungai-sungai, menyebabkan keruhnya air dam. Oleh karena itu, evaluasi terhadap sumber-sumber potensial keberadaan padatan tersuspensi ini perlu dilakukan. Dalam penelitian ini, analisis dilakukan untuk mengetahui distribusi spasial dan kuantitas padatan tersuspensi. Untuk tujuan ini, dengan memfokuskan perhatian pada DAS bagian atas reservoir, beberapa faktor yang mungkin menyebabkan air keruh diolah dan dianalisis secara kuantitatif dengan menggunakan SIG. Untuk memahami karakteristik dari kekeruhan sungai, arus sungai dan kekeruhan sungai diukur dengan beberapa stasiun yang dipilih. Kemudian faktor mekanik yang menyebabkan air keruh diidentifi kasi setelah menganalisis hubungan antara karakteristik effl ux dan kemungkinan faktor padatan tersuspensi. Hasil penelitian menunjukkan bahwa ekstraksi informasi spasial dapat dilakukan secara efi sien dengan menerapkan metode analisis spasial. Selanjutnya, dengan menerapkan analisis regresi berganda, ditemukan bahwa longsor dan hutan buatan, wilayah drainase, dan terain bergelombang diindikasikan sebagai faktor dominan yang menyebabkan kekeruhan.
Kata kunci: SIG, kekeruhan sungai, padatan tersuspensi, hidrologi, DAS
Introduction
Kyushu electric power plant which is located in the Hitotsuse dam, in Miyazaki Prefecture is one of the main electric power plants managed by Kyushu Electric Power Plant Company. The water in this dam is supplied
from the rivers fl owing from the upper basins.
During several recent years, the environmental degradation problem has been the concern of the company. One of the sources of the problem is the existence of turbid water from the upper rivers which can potentially causes the existence of suspended solids at Hitotsuse dam. In a long term, it is worried that this phenomenon will potentially cause the environmental degradation, especially around the dam, where the Kyushu Electric Power Plant is located. Therefore, necessary measures are required to secure the dam from environmental degradation, which in return is to assure the long term power plant operational activities.
Stream water substance is controlled by numerous natural and anthropogenic factors (Ahearn et al., 2005). Their effects on hydrochemistry can either be diffuses (e.g., runoff from urban and crop cultivation,
interfl ow through organic rich soils) or point
pollutants (e.g., industrial effl uents) (Sliva and
Williams, 2001; Li et al., 2008). Also, watershed characteristics including topography and
surfi cial geology can infl uence surface water
quality (Sliva and Williams, 2001). In recent years there is a rapid declining availability of usable freshwater in terms of water quality and quantity due to unsustainable land use practices (Ngoye and Machiwa, 2004). Water quality is generally linked to land use/land cover (LULC) in catchment (Ahearn et al., 2005), and studies have been focusing on their relationships with water quality variables such as dissolved salts, suspended solids, and nutrients (Hill, 1981; Smart et al., 1998; Sliva
and Williams, 2001; Turner and Rabalais, 2003; Ahearn et al., 2005). They conclude
that agricultural land use strongly infl uences
nitrogen (Smart et al., 1998; Ahearn et al., 2005), phosphorus (Hill, 1981), and sediments (Ahearn et al., 2005) in stream water. Urban
land use has infl uenced water nutrients as well
(Sliva and Williams, 2001).
Turbidity is a fundamental index used to assess water quality conditions. Turbidity in natural
waters is typically caused by fi ne inorganic
and organic particles suspended within the water column.Variations in turbidity also help us to understand the distribution of total suspended solids or sediments (TSS), as well as processes like coastal erosion and mobilization of chemicals or pollutants (Heyes et al., 2004). Researches and studies with focus on river turbidity have been a concern for some researchers (Chikita and Okumura, 1990; Pirmez and Imran, 2003; Pavanelli and Bigi, 2005; Lawler et al, 2006;; Foltz et al, 2007; Susfalk et al, 2008;). Lawler et al (2006) for example, conducted research on the analysis of turbidity dynamics during spring storm events in an urban headwater river system. A research on the calculation of sediment runoff values from a watershed has been demonstrated by Osawa et al (2003). This research develops a Suspended solids Contents (SSC) analysis model based on a storage-type and lumped parameter model, such as Tank
Model, for a watershed with insuffi cient data
collection, to calculate discharge and SSC at the end of the watershed. Sakai et al (2005) developed a storage-type sediment runoff model with two runoff elements of direct runoff and base runoff with the sediment runoff process corresponding to these runoff elements. This model is used to calculate SSC
of two catchments in Okinawa with signifi cant
success.
water turbidity has been carried out by many researchers (Chen et all, 2007; Bustamante et al, 2008; Stech et al, 2007). The utilization of this data is based on the fact that satellite-borne sensors is potentially to be an effective tool to assess turbidity because they provide synoptic and frequent mapping capabilities. However, satellite platforms also have limitations such as in spatial resolution, revisit time, accessibility to data, sensor calibration and image processing software.
By considering the turbidity problem characteristics in the Hitotsuse area, this study tries to develop a spatio-statistical analysis model which is based on GIS spatial analysis method and statistical approach to understand the potential factors which cause in the existence of turbidity in the river water. Hydrological Tank Model was utilized for river water turbidity based on input
precipitation data as it proves to be potential for hydrological modeling.
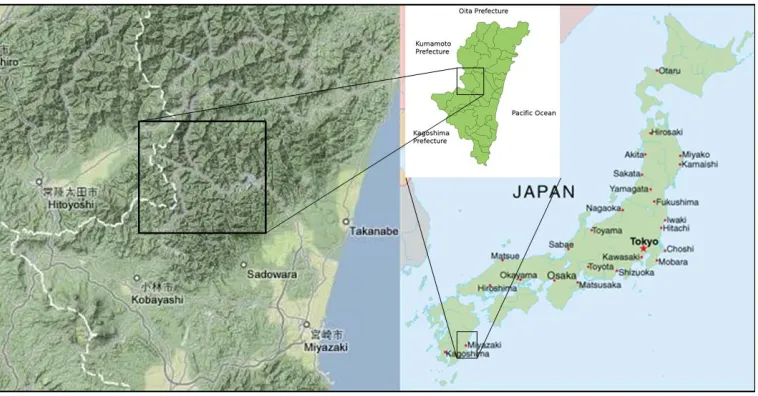
Study Area and Research Method
Miyazaki Prefecture is located in south-east of Kyushu island, Japan, surrounded by Oita Prefecture on the north, Kumamoto Prefecture on the west, Kagoshima Prefecture on the
south, and Pacifi c ocean on the east. The study
area is in a mountainous forested terrain of the Hitotsuse area in Miyazaki Prefecture, Kyushu (Figure 1), bounded within Latitude:
320 10` 48” N - 32024`59” N and Longitude:
13102`40” E - 131017`31” E. The topographic
condition is very undulating with maximum slope of about 79.5 degrees, and the elevations ranging from 196 to 1723 m above sea level. The natural vegetation is warm-temperate evergreen broadleaf forest and secondary natural broadleaf forest presently dominates the area.
Figure 1. Study location in Hitotsuse area, Miyazaki Prefecture, Japan
.
The data used in this study are SPOT satellite data, digital elevation model (DEM), precipitation, and river turbidity data. A SPOT 5/HRG image was utilized in this study. This satellite data was observed in February 3, 2006 and November 11, 2006. They have four bands: band 1 (visible green, 0.50-0.59
m), band 2 (visible red, 0.61-0.68 m),
band 3 (near-infrared, 0.78-0.89 m), and
band 4 (SWIR, 1.58-1.75 m). The spatial
resolution of band 1 to band 3 is 10 m, and band 4 is 20 m. A 10-m grid digital map created by Hokkaido Map Corporation was used for the digital elevation model (DEM). This DEM was produced based on digital 10 m contour map at scale 1:25000 published by the Geographical Survey Institute of Japan.
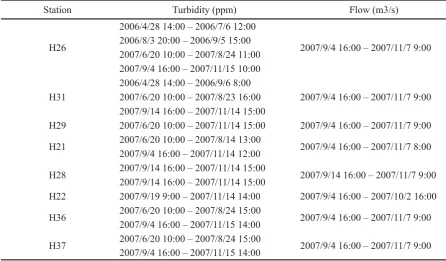
The river turbidity and river fl ow data was
collected from 9 stations: Oukawachi, Oyabu, Makinokuchi, Kamiage, Ohae, Ogawa, Murasho power station, Murasho, and
Kamiitaya. The recorded data was dated from 2006/5/1 (10:00) to 2006/10/16 (18:00) and from 2007/4/1 (10:00) to 2007/11/25 (00:00).
Table 1. River turbidity and river fl ow data observation period.
Station Turbidity (ppm) Flow (m3/s)
H26
2006/4/28 14:00 – 2006/7/6 12:00
2007/9/4 16:00 – 2007/11/7 9:00 2006/8/3 20:00 – 2006/9/5 15:00
2007/6/20 10:00 – 2007/8/24 11:00 2007/9/4 16:00 – 2007/11/15 10:00
H31
2006/4/28 14:00 – 2006/9/6 8:00
2007/9/4 16:00 – 2007/11/7 9:00 2007/6/20 10:00 – 2007/8/23 16:00
2007/9/14 16:00 – 2007/11/14 15:00
H29 2007/6/20 10:00 – 2007/11/14 15:00 2007/9/4 16:00 – 2007/11/7 9:00
H21 2007/6/20 10:00 – 2007/8/14 13:00 2007/9/4 16:00 – 2007/11/7 8:00 2007/9/4 16:00 – 2007/11/14 12:00
H28 2007/9/14 16:00 – 2007/11/14 15:00 2007/9/14 16:00 – 2007/11/7 9:00 2007/9/14 16:00 – 2007/11/14 15:00
H22 2007/9/19 9:00 – 2007/11/14 14:00 2007/9/4 16:00 – 2007/10/2 16:00
H36 2007/6/20 10:00 – 2007/8/24 15:00 2007/9/4 16:00 – 2007/11/7 9:00 2007/9/4 16:00 – 2007/11/15 14:00
H37 2007/6/20 10:00 – 2007/8/24 15:00 2007/9/4 16:00 – 2007/11/7 9:00 2007/9/4 16:00 – 2007/11/15 14:00
The research fl ow is grouped into three steps:
1) spatial information extraction and analysis,
2) river water fl ow and turbidity observation
and analysis, and precipitation data collection, and 3) statistical analysis. Spatial information extraction and analysis includes steps of preparation and development of spatial data necessary for the analysis. This was done
based on spatial analysis method within GIS. The extracted and developed spatial data are the factors which are potentially contribute to the existence of river turbidity, which then are called mechanical factors. These
identifi ed mechanical factors are described in
table 2, which are grouped into fi ve types of
contributing factors.
Table 2. Type of mechanical factors.
Type of contributing factors Mechanical factors
Hydrological factor Drainage area, river length, river density, curvature of river, stream gradient
Topographical factor Average of slope angle, dip direction, slope number and density, terrain undulation, failed slope
Geological and edaphic factor Geologic condition, soil type
Land cover Land cover class, land cover change, landslide scar
The river fl ow and turbidity observation
was done by measuring the river fl ow and
its turbidity within a period of time at eight selected stations (see table 1). These stations were selected based on the turbidity currents
which were identifi ed from the previous study.
Then, based on the previously developed tank model system, the collected precipitation
data, river fl ow data, and turbidity data were
utilized to develop a hydrological model of the study area. This model was used to predict the
turbidity currents under specifi c precipitation
input data, namely 10 mm/h, 20 mm/h and 30 mm/h. The resulting turbidity currents
which were predicted under specifi c rainfall
circumstances were then utilized to identify the correlation between the mechanical factors and the turbidity currents by utilizing multiple regression analysis.
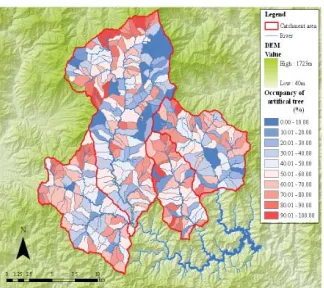
Results and Discussion
The developed spatial database which is necessary for conducting the analysis
comprises of several data which are identifi ed
as mechanical factors. These mechanical factors are believed to be the contributing factors for the occurrence of the suspended material in river turbidity. Some of these
mechanical factors are depicted in fi gure
2. Figure 2a shows the four watersheds namely Hitotsuse, Itaya, Ogawa, and Shiromi watershed, also eight selected observation stations for the purpose of turbidity and
river fl ow data collection which are located
in the Hitotsuse watershed. Each of these
stations represents its catchment. The stations selection was based on the previously recorded
turbidity data which showed the signifi cant
high quantity of the suspended solids contents within the water column.
a) Watershed of fork in a river. b) Area of landslide scar
c) Mean of slope angle on rinpan d) Density of river on watershed of fork in a river.
e) Distribution of soil type on rinpan. f) Occupancy of artifi cial forest on rinpan
Figure 2. Developed spatial data.
The other thematic data include geological and edaphic factor data, land cover factor data,
and man-caused factor data. The identifi ed
important data for geologic and edaphic factor are geologic condition and soil type data. The
soil type for the entire study area is illustrated
in fi gure 2e, represented in area unit of rinpan.
Rinpan is Japanese unit area which represents
one type of forest section which is community
divided by natural landscape such as valleys, mountain ridges and rivers. A collection of
rinpans forms a catchment.
Land cover factor includes land cover class, land cover change, and landslide scar. This information was extracted from the SPOT5 satellite data. The land cover class information was extracted by applying land
use classifi cation process to classify land
cover into 7 classifi cations, namely forest,
road, river, logging area, developed land, landslide scar, and bare land. Land cover change analysis was then conducted to grasp the information about the change of land use within the entire study area between February
2006 and November 2006. The identifi ed land
use change is from bare land to forest and vice versa, from forest to bare land. It was
identifi ed that from February to November
2006 there was a change in land use from bare
land to forest at about 19.93 km2 or about 6.45
% of the total area.
Failed slope area has been regarded as one of the important factors which dictate the occurrence of suspended solids. Therefore, landslide scar is one factor that should be extracted from the satellite data, conducted by visual inspection. The total area of the
landslide scar that could be identifi ed is about
2.36 km2, or about 0.63% of the total study
area. This number is the accumulation from
the four watersheds at about 1.25 km2 (0.74%)
for Hitotsuse, 0.38 km2 (0.49%) for Itaya, 0.31
km2 (0.53%) for Ogawa, and 0.42 km2 (0.55%)
for Shiromi watershed. The percentage is the proportion to the total area of each watershed.
The identifi ed landslide scar areas then were
represented into each slope unit. The result is the number of slopes which contain collapsed area, accounted for about 2575 or about 3.72% of the total area. This slope number is distributed within Hitotsuse, Itaya, Ogawa and Shiromi watersheds at about 1265 (3.88%), 490 (3.65%), 320 (4.22%) and 500 (4.39%) respectively.
Man-caused factor includes area of artifi cial
forest and road density. Within the entire study area, forest area occupies about 91.60% of the total area. This is composed of natural
forest at about 47.48 % and artifi cial forest at
about 44.12 %. The artifi cial forest is forest
area which is planted with specifi c tree types
and managed by local people for logging industry purpose. This area is distributed around the four watersheds with different coverage. Furthermore, the total length of the road networks is about 949.70 km. This is distributed in Hitotsuse, Itaya, Ogawa and Shiromi watershed with road length at about 371.25km, 250.52 km, 140.62 km, and 187.27 km respectively. The density of road is the proportion between road length and its area. Therefore the average road density
for each watershed is about 2.57 km/km2 for
Hitotsuse, 3.69 km/km2 for Itaya, 3.65 km/
km2 for Ogawa, and 3.22 km/km2 for Shiromi
watershed. In this research, the road density is calculated within catchment unit area.
The hydrological data includes rainfall,
turbidity and river fl ow data. The historical
river fl ow quantity (m3/s) at several stations
as a result to rainfall from January 1st until
August 28th 2007 is represented in fi gure 3.
During that time period, there were two peak
rainfall intensities between April 6th and April
30th valued at about 30 mm/hour. The resulting
river fl ow due to those two peak rainfall can
be seen at Station H29 which shows highest
river fl ow intensity with maximum value at
about 9.8 m3 per second. Even though did not
show a signifi cant response to the peak rainfall
intensity, Station 31 shows relatively constant
river fl ow volume, with average value at above
1.4 m3 per second. For Stations H21, H26 and
H28, even though they show a constant river
fl ow value much less than Station H29 and H31,
these stations show signifi cant response to the
two rainfall events. One of the reasons of the phenomenon is because the rainfall intensity was not evenly distributed over the whole area
with the same intensity, concentrated around
0
Figure 3. Precipitation and quantity of fl ow in observing watershed.
The turbidity amount as a response to the
rainfall events is depicted in fi gure 4. This
fi gure also represents the graph of predicted
turbidity calculated by using tank model
system. From the fi gure, it can be clearly
seen that there is a positive correlation between the rainfall and observed turbidity. The rainfall events over the basin area has
resulted in a signifi cant turbidity quantity
outfl ow as can be seen from the positive
response of the turbidity value towards the rainfall data. In other words, the rainfall data variation throughout the graph is resembled by the turbidity data distribution along the
time series. This positive strong correlation
is verifi ed by the correlation determination
value at about 0.9 which was resulted from regression analysis. However, this is not the case for the predicted turbidity values. Even though the predicted turbidity values show
the similar fi gures with the observed turbidity
values, this fi gure is not good enough to judge
the strong correlation between rainfall and predicted turbidity values. This is supported by the weak correlation determination value at about 0.56. Nonetheless, due to the high complexity of the hydrological model of the study area to be modeled, this result is considered good enough.
0
0 744 1488 2232 2976
Hour
The collected data were statistically evaluated using multiple regression analysis method. Since the general purpose of multiple regressions is to understand the relationship between several independent or predictor variables and a dependent or criterion variable, there are two objectives of the utilization of this method in this research. Firstly is to understand the important factors contributing to the occurrence of the suspended solids in the turbid water; and secondly is to be able to predict the total suspended solids quantity
within the whole watershed. For this purpose, the mechanical factors are regarded as the independent variables, whereas turbidity is considered as dependent variable. The turbidity value used in this analysis is the turbidity values resulted from the hydrological tank model based on the constant intensity of precipitation input data at 10, 20 and 30 mm/h. This scenario was applied in order to be able
to measure the infl uence of the mechanical
factors towards the resulting turbidity values at a certain rainfall event.
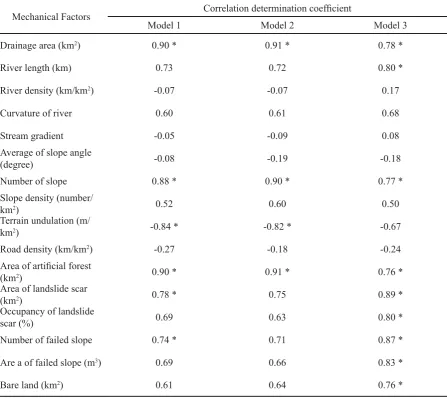
Table 3. Results of correlation analysis between suspended solids and factors
Mechanical Factors Correlation determination coeffi cient
Model 1 Model 2 Model 3
Drainage area (km2) 0.90 * 0.91 * 0.78 *
River length (km) 0.73 0.72 0.80 *
River density (km/km2) -0.07 -0.07 0.17
Curvature of river 0.60 0.61 0.68
Stream gradient -0.05 -0.09 0.08
Average of slope angle
(degree) -0.08 -0.19 -0.18
Number of slope 0.88 * 0.90 * 0.77 *
Slope density (number/
km2) 0.52 0.60 0.50
Terrain undulation (m/
km2) -0.84 * -0.82 * -0.67
Road density (km/km2) -0.27 -0.18 -0.24
Area of artifi cial forest
(km2) 0.90 * 0.91 * 0.76 *
Area of landslide scar
(km2) 0.78 * 0.75 0.89 *
Occupancy of landslide
scar (%) 0.69 0.63 0.80 *
Number of failed slope 0.74 * 0.71 0.87 *
Are a of failed slope (m3) 0.69 0.66 0.83 *
Bare land (km2) 0.61 0.64 0.76 *
Table 3 depicts the correlation analysis results between the suspended solids and mechanical
factors. Correlation determination coeffi cients
which determine the correlation strength between the two variables are grouped in
strong correlation between the variables that varies between model 1, model 2 and model 3. Based on these values, the mechanical factors which are highly correlated to the
suspended solids outfl ow quantity then were
selected for the multiple regression analysis,
to fi nd the most signifi cant mechanical factors
towards the suspended solids outfl ows and
also to develop a multi regression equation for
suspended solids outfl ow prediction.
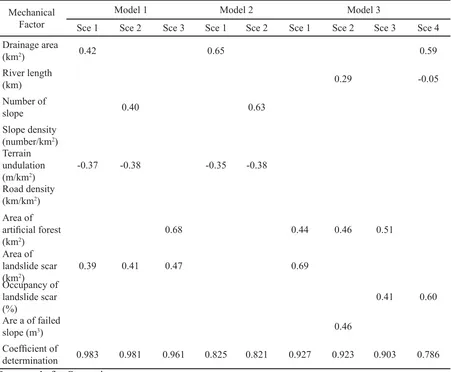
Table 4 depicts the partial regression
coeffi cient of each mechanical factor of model
1, model 2 and model 3, which were resulted from different scenarios. Each scenario involves different combination of mechanical factors when conducting multiple regression analysis. For this purpose, the selection of
the mechanical factors to be included in the analysis is based on the information on table 3; i.e. only the factors which have strong
correlation with the suspended solids outfl ow
would be included in the analysis. Therefore there are several scenario of analysis to be
conducted in order to be able to fi nd the most
signifi cant factors. From the model 1, scenario
1 gives the best result as is indicated by the
highest value of coeffi cient of determination
at about 0.98. This scenario reveals the fact that drainage area, terrain undulation and area
of landslide scar have signifi cant contribution
in determining the suspended solids quantity. For model 2, scenario 1 takes account of drainage area and terrain undulation as important factors. Furthermore, model 3 has
put scenario 1 with area of artifi cial forest and
area of landslide scar factors as the best result.
Table 4 Result of multiple regression analysis (standardized partial regression coeffi cient)
Mechanical Factor
Model 1 Model 2 Model 3
Sce 1 Sce 2 Sce 3 Sce 1 Sce 2 Sce 1 Sce 2 Sce 3 Sce 4
-0.37 -0.38 -0.35 -0.38
Road density (km/km2)
Area of artifi cial forest (km2)
0.68 0.44 0.46 0.51
Area of landslide scar (km2)
0.39 0.41 0.47 0.69
Occupancy of
determination 0.983 0.981 0.961 0.825 0.821 0.927 0.923 0.903 0.786
From the selected scenarios, the selected
mechanical factors which signifi cantly
contribute to the suspended solids outfl ow
vary from model 1, model 2 and model 3. Area of landslide scar, for example, is regarded as important factor in model 1 and model 3, whereas drainage area and terrain undulation factors are essential in model 1 and 2. The ideal situation is that the selected mechanical factors are the same in all models.
Yet, it is diffi cult to achieve this ideal result
since there are many aspects in the research
steps contribute to the fi nal results. One of
the aspects is the hydrological model used for turbidity prediction. Necessary measures need
to be carried out to refi ne and to improve its
performance.
For the purpose of turbidity prediction for the whole watershed area, regression equation was constructed. Equation (1) is the multiple regression equation for the model 3. As a result, for the rainfall event of 30 mm/h, the
estimated turbidity outfl ow is:
Predicted suspended solids = 21.875 x (area
of landslide scar) + 1.212 x (Area of artifi cial
forest) – 0.45 (1)
From comparison of the coeffi cient of each
term in this equation, it is notable that area of landslide scar is more important for predicting
suspended solids than the area of artifi cial
forest.
Conclusion
An attempt to understand the infl uential
factors in relation to the suspended solids currents within the river water in Hitotsuse area has been demonstrated in this research. The spatial data extraction process which was conducted within GIS spatial analysis could be conducted effectively. Furthermore, by applying multivariate analysis on the three models which were based on three different precipitation intensities (10 mm/h, 20 mm/h and 30 mm/h), the important factors which dictate the suspended solids currents could
be recognized. These identifi ed mechanical
factors vary from model 1, model 2 and model
3. However, based on these fi ndings, it can
be concluded that in general, the important mechanical factors are drainage area, terrain undulation, area of landslide scar, and area of
artifi cial forest.
References
Ahearn, D.S., Sheibley, R.S., Dahlgren, R.A., Anderson, M., Jonson, J., and Tate, K.W. (2005).
Land use and land cover infl uence on water quality in the last free-fl owing river draining
the western Sierra Nevada, California. Journal of Hydrology, 313, 234–247.
Bustamante, J., Pacios, F., Dı´az-Delgado, R. and Aragone´s, D. (2008). Predictive models of
turbidity and water depth in the Do~nana marshes using Landsat TM and ETMt images.
Journal of Environmental Management, 1e7
Chen, Z., Hu, C., Muller-Karger, F. (2007). Monitoring turbidity in Tampa Bay using MODIS/
Aqua 250-m imagery. Remote Sensing of Environment 109 (2007) 207–220.
Chikita, K. and Okumura, Y. (1990). Dynamics of turbidity current measured in Katsurazawa
reservoir, Hokkaido, Japan. Journal of Hydrology, 117 (1990) 323-338 323
Foltza, R. B., Yanoseka, K. A. and Brownb, T. M. (2007). Sediment concentration and turbidity
changes during culvert removals. Journal of Environmental Management, doi:10.1016/j.
jenvman.2007.01.047
Heyes, A., Miller, C., & Mason, R. P. (2004). Mercury and methylmercury in Hudson River
sediment: Impact of tidal re-suspension on partitioning and methylation. Marine Chemistry,
Hill, A.R. (1981). Stream phosphorus exports from watersheds with contrasting land uses in
southern Ontario. Water Resources Bulletin, 17, 627–634.
Lawler, D. M., Petts, G. E., Foster I. D. L., and Harper, S. (2006). Turbidity dynamics during spring storm events in an urban headwater river system: The Upper Tame, West Midlands, UK. Science of the Total Environment, 360 (2006) 109– 126
Li, S., Xu, Z., Cheng, X., and Zhang, Q. (2008). Dissolved trace elements and heavy metals
in the Danjiangkou Reservoir, China. Environmental Geology. doi:10.1007/s00254-007-
1047-5.
Ngoye, E., and Machiwa, J.F. (2004). The infl uence of land use patterns in the Ruvu river
watershed on water quality in the river system. Physics and Chemistry of the Earth 29, 1161–1166.
Osawa, K., Sakai, K. and Shimada, M. (2003). Construction of the suspended sediment runoff
model for agricultural basins. In: Williams JD and Kolpin DW (eds). AWRA 2003 Spring
Specialty Conference. Kansas, KA.
Pavanelli, D. and Bigi, A. (2005). A new indirect method to estimate suspended sediment
concentration in a river monitoring program. Biosystems Engineering (2005) 92 (4), 513–
520.
Pirmez, C. and Imran, J. (2003). Reconstruction of turbidity currents in Amazon Channel.
Marine and Petroleum Geology, 20 (2003) 823–849
Sakai, K., Osawa, K. and Yoshinaga, A. (2005). Development of suspended sediment concentration (SSC) analysis model and its application with multi-objective optimization.
Paddy Water Environ (2005) 3: 201–209
Sliva, L., and Williams, D. D. (2001). Buffer zone versus whole catchment approaches to
studying land use impact on river water quality. Water Research, 35, 3462–3472.
Smart, R.P., Soulsby, C., Neal, C., Wade, A., Cresser, M.S., Billett, M.F., Langan, S.J., Edwards, A.C., Jarvie, H.P., and Owen, R. (1998). Factors regulating the spatial and temporal
distribution of solute concentrations in a major river system in NE Scotland. The Science of
the Total Environment, 221, 93–110.
Stech1, J., Alcântara1, E., Novo1, E., Shimabukuro1, Y. and Barbosa, C. (2007). Turbidity
in the Amazon fl oodplain assessed through a spatial regression model applied to fraction
images derived from MODIS/Terra. IEEE. Downloaded on October 5, 2008 at 22:50 from
IEEE Xplore.
Susfalk, R. B., Fitzgerald, B. and Knust, A. M. (2008). Characterization of Turbidity and Total
Suspended Solids in the Upper Carson River, Nevada. DHS Publication No. 41242, January
2008.
Turner, R.E., Rabalais, N.N. (2003). Linking landscape and water quality in the Mississippi