CHAPTER IV
RESEARCH FINDING AND ANALYSIS
A. Research Finding
The results of hypothesis data of this research showed that there was significant effect
between the students’ achievement in writing narrative paragraph by using SWELL method
and the students’ achievement in writing narrative paragraph without using SWELL method.
SWELL method was a nice method on the students’ achievement in writing narrative
paragraph. It can be seen from the result of the students’ score who were taught by using
SWELL method. SWELL method had strength in teaching writing narrative paragraph. This method help students to understand important components such as character, setting,
problem, and solution in writing, SWELL style help the students’ ensure that their sentence
are clearly written in their final draft, using SWELL the students more active and creative in
learning, using SWELL, the students’ are able to transfer their ideas easily, get motivated, get
activated, and they could avoid the boredom of the conventional teaching method, besides
this method can lead the students’ to write better. However, this method also had weakness
such as, sometimes, the teachers find it difficult to divided the students into a pairs because the students still fell not confident to be a helper.
B. Data Description
given after the treatment. The write gave the treatment to students’ in the experimental group by using SWELL method while control group without using SWELL method.
After conducting the research, the research got the data of students’ scores in pre test and
post test from both experimental and control group.
Table: 4.1
The Score of Pre Test and Post Test of Experimental Group
NO Students Initial Pre-Test Post-Test
18 SFSN 45 85
Based on the table above, the students’ achievement in writing text in experimental group
mean of pre test was 50. On the other hand the lowest score of post test was 60, and the highest score of post test was 90 and the mean of post test was 76.84.
Table: 4.2
The score of Pre Test and Post Test of Control Group
No Student Initial Pre-test Post-test
From the table above, the students’ score in writing text in control group showed the
lowest score of pre test was 30, and the highest score of pre test was 55 and the mean of pre
test 41.71. On the other hand the lowest score of post test was 60, and the highest score of post test was 80 and the mean of post test 68.15.
Based on the explanation above, it shows that the students’ score in experimental group
was higher than students’ score in control group, where in pre test (50) and the score in post
test (76.84). The total score of the mean score in experimental and control group showed that
there was significant effect in improvement of students’ score between pre test and post test.
C. Analysis Requirement Testing
C.1 Normality Testing
Normality testing used to determine if a data set is well-modeled by normal distribution and to compare how likely it is for a random variable underlying the data set to be normally distributed.
1.1Normality Testing of Experimental Group
Table: 4.3
Frequency Distribution of Pre Test in Experimental Group
NO Xi Fi FiXi Xi² FiXi²
1 40 5 200 1600 8000
2 45 10 450 2025 20250
3 50 8 400 2500 20000
4 55 10 550 3025 30250
5 60 5 300 3600 18000
Based on the data above, the result of FiXi² is 96500 and FiXi is 1900.
Then the following is the calculation of mean, variant and standard deviation.
= 6.367
After getting the calculation of mean, variant and standard deviation, then the next step is to found out the normality of the test. It means that the test was given to the students is observed by Liliefors test. The calculation of normality writing text can be seen in the following table:
Table: 4.4
Normality Testing of Pre Test in Experimental Group
a. Finding Z score Formula: Zi 1 =
Zi 1 = = -1.57
Zi 2 = = -0.78
Zi 3 = = 0 Zi 4 = = 0.78 Zi 5 = = 1.57 B. Finding S(Zi)
S(Zi) =
S(Zi) = = 0.1315 S(Zi) = = 0.3947 S(Zi) = = 0.6052 S(Zi) = = 0.8684 S(Zi) = = 1
From the table above, it can be seen that Liliefors observation or Lo = - 0.1317 with n =
38 and at real level α = 0.05 from the list of critical value of Liliefors table Lt = 0.14. It is known
that the coeficient of Lo (0.1317) < Lt (0.14). So it can concluded that the data distribution of
Table: 4.5
Frequency Distribution of Post Test in Experimental Group
No Xi Fi FiXi Xi² FiXi²
from the data above, the result of FiXi² is 227300 and FiXi 2920. Then the following is the calculation of mean, variant and standard deviation.
b. Variant Where :
S2 = variant
N = Number of sample
So’
S2 = =
=
=
= 78.94
c. Standard Deviation S =
= = 8.88
After getting the calculation of mean, variant and deviation standard, then the next step is
to found out the normality of the test. It means that the test was given to the students’ is observed
by Liliefors test. The calculation of normality writing text can be seen in the following table:
Table: 4.6
Normality Testing of Post Test in Exprimental Group
NO SCORE F Fkum Zi F(Zi) S(Zi)
S(Zi) =
From the table above, it can be seen that Liliefors observationor Lo= -0.1845 with n = 38 and at real level α= 0.05 from the list of critical value of Liliefors table Lt = 0.14. It is known that the coeficient of Lo (-0.1845) < Lt (0.14). So it can be concluded that the data distribution of
the students’ ability in writing text normal.
1.2Normality Testing of Control Group Table: 4.7
Frequency Distribution of Pre Test in Control Group
No Xi Fi FiXi Xi² FiXi²
After getting the calculation of mean, variant and standard deviation, then the next step is
to find out the normality of the test. It means that the test was given to the students’ is observed
by Liliefots test. The calculation of normality writing paragraph can be seen in the following table:
Table: 4.8
Normality Testing of Pre Test in Control Group
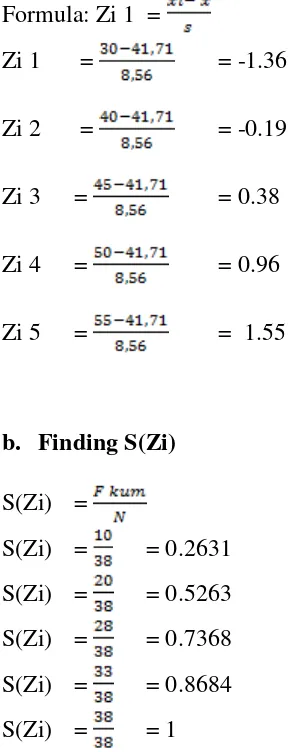
Formula: Zi 1 =
Zi 1 = = -1.36
Zi 2 = = -0.19
Zi 3 = = 0.38
Zi 4 = = 0.96
Zi 5 = = 1.55
b. Finding S(Zi) S(Zi) =
S(Zi) = = 0.2631 S(Zi) = = 0.5263 S(Zi) = = 0.7368 S(Zi) = = 0.8684 S(Zi) = = 1
From the table above, it can be seen that Liliefors observation or Lo= -0.1762 with n= 38
and at real level α = 0.05 from the list of crtical value of Liliefors table Lt = 0.14. It is known
that the coefficient of Lo ( -0.1762) < Lt (0.14). So it can be concluded that the data distribution
of the students’ ability in writing paragraph normal.
Frequency Distribution of Post Test in Control Group following is the calculation of mean, variant and standard deviation.
Where :
S2 = variant
N = Number of sample
So’
S2 = =
=
=
= 52.19
c. Standard Deviation S =
= = 7.22
After getting the calculation of mean, variant and standard deviation then the next step is
to find out the normality of the test. It means that the test was given to the students’ is
Table 4.10
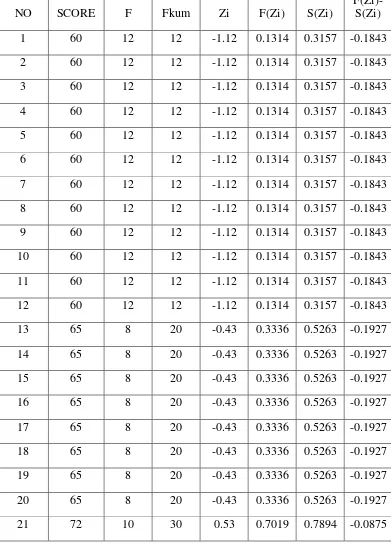
Normality Testing of Post Test in Control Group
Zi 2 = = 1.64
Finding S(Zi)
S(Zi) =
S(Zi) = = 0.3157 S(Zi) = = 0.5263 S(Zi) = = 0.7894 S(Zi) = = 0.9210 S(Zi) = =1
From the table above, it can be seen that Liliefors observation or Lo= -0.1927 with n= 38
and at real α = 0.05 from the list of critical value of Liliefors table Lt= 0.14. It is known that
the coefficient of Lo (-0.1927) < Lt (0.14). So it can be concluded that the data distribution of
the students’ ability in writing text is normal.
C.2. Homogenity Testing
2.1 Homogenity Testing of Pre Test Fobs =
Where: S12 = the biggest variant S22 = the smallest variant
Based on the variants of both samples of pre test found that: S2
ex = 40.54 N = 38
So :
Fobs = = 0.55
Then the coefficient of Fobs = 0.55 is compared with Ftable, where Ftable is determined at
real α = 0,05 and the same numerator dk = 38-1 = 38-1 that was exist dk numerator 37, the
denominator dk = 38-1 ( 38-1= 37). Then Ftable can be calculated F0,05(38;38) = 1.72
So Fobs < Ftable or (0.55 < 1.72) so it can be concluded that the variant is homogenous.
2.2Homogenity Testing of Post Test
Fobs =
Where: S12 = the biggest variant S22 = the smallest variant
Based on the variants of both samples of pre test found that: S2
ex = 78.94 N = 38
S2co = 52.19 N = 38
So :
Fobs = = 1.51
Then the coefficient of Fobs = 1.51 is compared with Ftable, where Ftable is determined at
real α = 0.05 and the same numerator dk =38-1 = 37 that was exist dk numerator 37, the denominator dk = 38-1 (38-1= 37). Then Ftable can be calculated F0,05(38;38)= 1.72
C.3. Hyphothesis Testing
Table 4.11
Mean of Post Test- Pre Test in Exprimental Group
Table: 4.12
Mean of Post Test- Pre Test in Control Group
Before doing hypothesis testing by using t-test, in this case is done by taken post-test score in experimental class and post test score in control class. The post test score is taken because the score that have gotten after teaching learning process.
The formula t-test used as follows :
The coefficient of was 6.77 that was compared with , where the coefficient of at real level 0.05 with df = 38 + 38 -2 = 74 gained the coefficient of = 1.99 In fact , the coefficient of (6.77) > ( 1.99). It shows that is in zero hypothesis rejection ( ) is accepted. It means that the alternative hypothesis which is
proposed by the researcher that there is significant effect of SWELL method to students’