CHAPTER IV
RESULT OF THE STUDY AND DISCUSSION
This chapter will present the result of the study and discussion. The finding designs to answer the research problem are the quesionaire. This section
covers data finding or the students’ response toward the non-TBI course of
English Education Program in implementation of 2011 curriculum and discussion.
A. Description of the Data
The result of the research on the students’ perception toward non-TBI
course of English Educatioan Study Program of STAIN Palangka Raya by using quesionaire as the instrument for collecting the data. The presented data consisted of response.
1. Data Analyses of Questionaires
In order to analyze the results of the research on the students’
perception toward the implementation of 2011 curriculum at English education Study Program of STAIN Palangka Raya by using questionnaire , The data were displaying as follow:
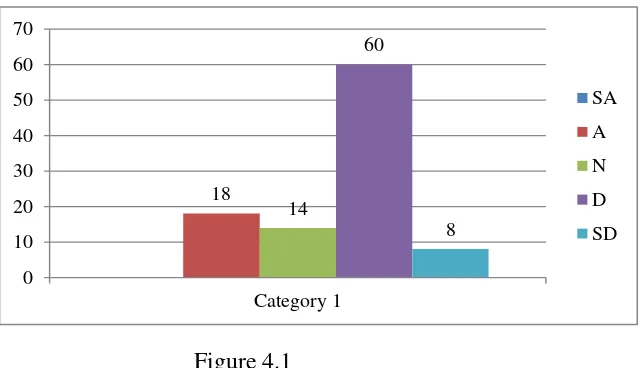
From the Item 3, with stetement is “Non-TBI course is not relevant in curriculum”. We can see the frequency and precentage response of the students as follow in the table :
18
14
60
8
0 10 20 30 40 50 60 70
Category 1
SA
A
N
D
SD Table 4.1 Display of Students response for question number 3.
Frequency Percent Valid Percent
Cumulative
Percent
Valid 1 4 8.0 8.0 8.0
2 30 60.0 60.0 68.0
3 7 14.0 14.0 82.0
4 9 18.0 18.0 100.0
Total 50 100.0 100.0
By the table above, writer describe the result into a figure for displaying the percentage and frequency of students response item number 3. That figure as follow :
Figure 4.1
6
16
20
40
18
0 5 10 15 20 25 30 35 40 45
Category 1
SA
A
N
D
SD
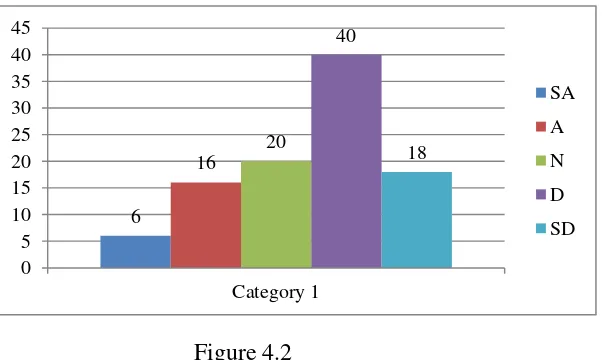
From the Item 5, with stetement is “Students have no to study non-TBI course”. We can see the frequency and precentage response of the students as follow in the table :
Table 4.2Display of students response to question number 5.
Frequency Percent Valid Percent
Cumulative
Percent
Valid 1 9 18.0 18.0 18.0
2 20 40.0 40.0 58.0
3 10 20.0 20.0 78.0
4 8 16.0 16.0 94.0
5 3 6.0 6.0 100.0
Total 50 100.0 100.0
By the table above, writer describe the result into a figure for displaying the percentage and frequency of students response item number 5. That figure as follow :
Figure 4.2
14
24 32
28
2
0 5 10 15 20 25 30 35
Category 1
SA
A
N
D
SD
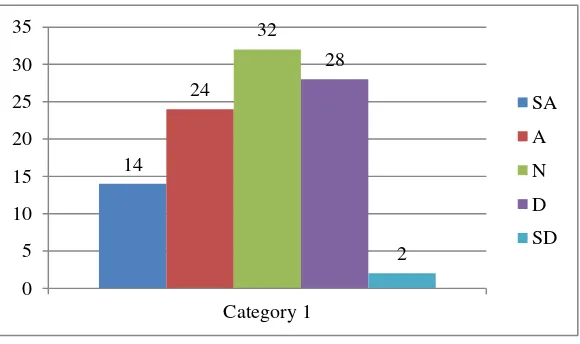
Move to the Item 7, with stetement is “Non-TBI course is difficult than English course”. We can see the frequency and precentage response of the students as follow in the table :
Table 4.3 Display of students response to question number 7.
Frequency Percent Valid Percent
Cumulative
Percent
Valid 1 1 2.0 2.0 2.0
2 14 28.0 28.0 30.0
3 16 32.0 32.0 62.0
4 12 24.0 24.0 86.0
5 7 14.0 14.0 100.0
Total 50 100.0 100.0
By the table above, writer describe the result into a figure for displaying the percentage and frequency of students response item number 7. That figure as follow :
Figure 4.3
10
22
40
24
4
0 5 10 15 20 25 30 35 40 45
Category 1
A
SA
N
D
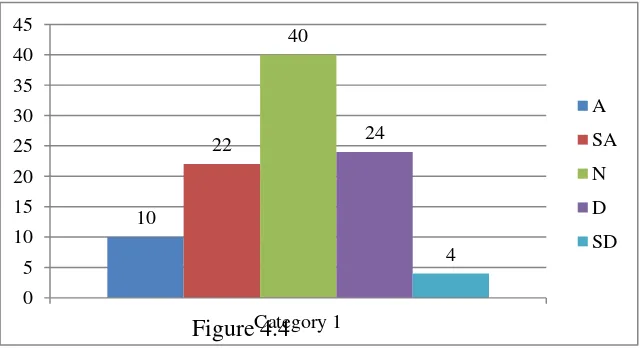
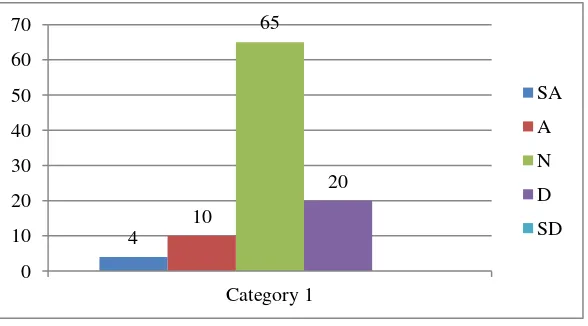
SD Next to the Item 10, with stetement is “Students have to attend every
Non-TBI course”. We can see the frequency and precentage response of the
students as follow in the table :
Table 4.4Display of students response to question number 10.
Frequency Percent Valid Percent
Cumulative
Percent
Valid 1 2 4.0 4.0 4.0
2 12 24.0 24.0 28.0
3 20 40.0 40.0 68.0
4 11 22.0 22.0 90.0
5 5 10.0 10.0 100.0
Total 50 100.0 100.0
By the table above, writer describe the result into a figure for displaying the percentage and frequency of students response item number 10. That figure as follow :
Figure 4.4
4
10
65
20
0 10 20 30 40 50 60 70
Category 1
SA
A
N
D
SD
From the Item 12, with stetement is “the 2011 curriculum of English Education Program is balancing.”. We can see the frequency and precentage response of the students as follow in the table :
Table 4.5Display of students response to question number 12.
Frequency Percent Valid Percent
Cumulative
Percent
Valid 2 10 20.0 20.0 20.0
3 33 66.0 66.0 86.0
4 5 10.0 10.0 96.0
5 2 4.0 4.0 100.0
Total 50 100.0 100.0
By the table above, writer describe the result into a figure for displaying the percentage and frequency of students response item number 12. That figure as follow :
Figure 4.5
6
34
48
10
2 0
10 20 30 40 50 60
Category 1
SA
A
N
D
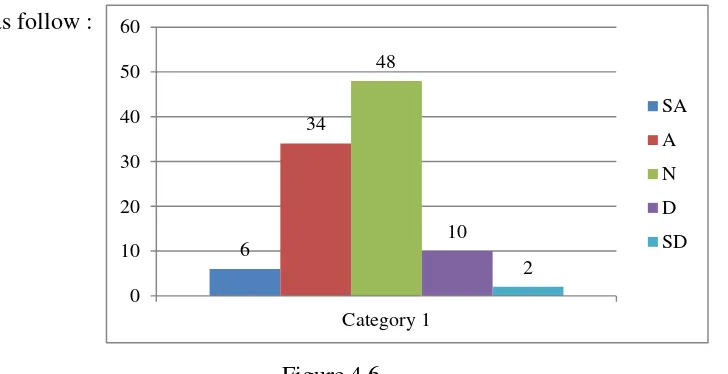
SD From the Item 13, with stetement is “the implementation of 2011 curriculum of English Education Program has interest and make students increase in English skill”. We can see the frequency and precentage response of the students as follow in the table :
Table 4.6Display of students response to question number 13.
Frequency Percent Valid Percent
Cumulative
Percent
Valid 0 1 2.0 2.0 2.0
2 5 10.0 10.0 12.0
3 24 48.0 48.0 60.0
4 17 34.0 34.0 94.0
5 3 6.0 6.0 100.0
Total 50 100.0 100.0
By the table above, writer describe the result into a figure for displaying the percentage and frequency of students response item number 13. That figure as follow :
Figure 4.6
6
36
50
8 6
0 10 20 30 40 50 60
Category 1
SA
A
N
D
SD From the Item 14, with stetement is “the composition of TBI course and Non-TBI courses should be same”. We can see the frequency and precentage response of the students as follow in the table :
Table 4.7Display of students response to question number 14.
By the table above, writer describe the result into a figure for displaying the percentage and frequency of students response item number 14. That figure as follow :
Figure 4.7
Item 14,There were Strongly Agree is 6% (3 student), Agree is 36% (5 students), Neutral is 50% (25 students), disagree is 20% (10 students), strongly disagree 5 % (1 student).
From the result of the data review in the the table and figure above writer made the rakapitulation of the data into :
Frequency Percent Valid Percent
Cumulative
Percent
Valid 1 4 8.0 8.0 8.0
2 25 50.0 50.0 58.0
3 18 36.0 36.0 94.0
4 3 6.0 6.0 100.0
Statistics
VAR03 VAR05 VAR07 VAR10 VAR12 VAR13 VAR14 VAR15 VAR16
N Valid 50 50 50 50 50 50 50 50 50
Missing 0 0 0 0 0 0 0 0 0
Mean 2.4200 2.5200 3.2000 3.1000 2.9800 3.3000 2.4000 3.9400 2.6800
Median 2.0000 2.0000 3.0000 3.0000 3.0000 3.0000 2.0000 4.0000 3.0000
Mode 2.00 2.00 3.00 3.00 3.00 3.00 2.00 4.00 3.00
Std. Deviation .88271 1.14713 1.06904 1.01519 .68482 .88641 .72843 .76692 1.03884
The explanation of the data review and recapitulation : see at thequestion number 3 the statement is “Non-TBI course is not relevant in
curriculum” almost of students disagree with that were 68% (34 students)
disagree about that, that describes if the impelementation of 2011 in english education study program has relevant in courses. Than we can see Item number 5, 7 and 10, with the general statement is students response of Non-TBI caourses have no to study non-TBI course” they asnwer were disagree is 58% (29 students), in addition, students still need the Non-TBI courses in curriculum of 2011 who has implemented. But the curriculum should be make more balancing and have to be students need or students interest.
Some aspect that the curriculum have to evaluate are the composition of the courses as like the time of learning, the value of the courses, the facility and lecturer methode, than the facility as handsbook, syllabus. They need more comprehend in mastering english or non english courses clearly.
We can see item number 16 with the statement are “There were
some course are not suitable in English Courses (Arabic Language, Indonesian Language, Tafsir). There were students Neutral is 38 % (19 students), disagree is 42% (21 students), that can guide us to understand if the students stiil want to study Non-TBI courses, just need change some aspect as composition and the quantity of the courses. That effect students can increase or support their values in examination, as we see item 18 were almost 50 % students agree with that.
In conclusion, implementation of 2011 was success but need evaluation in some aspect as like the materials of course must be relevant for the future as item number 1, 3 and 5. The students want to develop and mastering English skill who can integration and interconnection for some basis general and religion knowledge and experience
In order to analyze the result of the research on the students’
12 50
26
10
1 0
10 20 30 40 50 60
Category 1
SA
A
N
D
SD
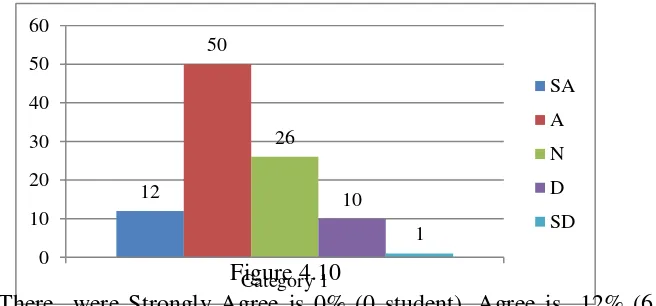
From the Item 1, with stetement is “The courses of general and region is not suitable for students of English Education Program needed.”. We can see the frequency and precentage response of the students as follow in the table :
Table 4,10 Display of Students response for question number 1.
Frequency Percent Valid Percent
Cumulative
Percent
Valid 0 1 2.0 2.0 2.0
1 5 10.0 10.0 12.0
2 13 26.0 26.0 38.0
3 25 50.0 50.0 88.0
4 6 12.0 12.0 100.0
Total 50 100.0 100.0
By the table above, writer describe the result into a figure for displaying the percentage and frequency of students response item number 1. That figure as follow :
Figure 4.10
12 12 38
32
4
0 5 10 15 20 25 30 35 40
Category 1
SA
A
N
D
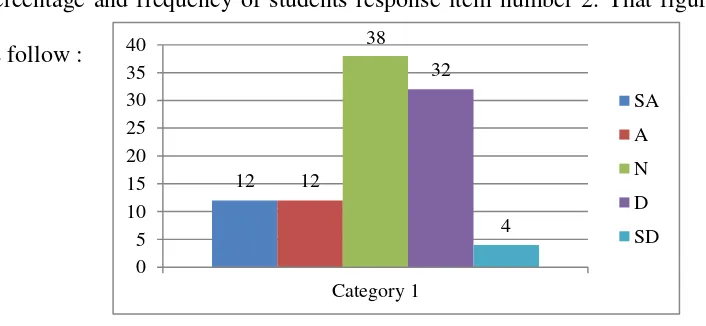
SD From the Item 2, with stetement is “in learning non-TBI course make students difficult to increase IPK”. We can see the frequency and precentage response of the students as follow in the table :
Table 4.11Display of Students response for question number 2.
Frequency Percent Valid Percent
Cumulative
Percent
Valid 0 1 2.0 2.0 2.0
1 2 4.0 4.0 6.0
2 16 32.0 32.0 38.0
3 19 38.0 38.0 76.0
4 6 12.0 12.0 88.0
5 6 12.0 12.0 100.0
Total 50 100.0 100.0
By the table above, writer describe the result into a figure for displaying the percentage and frequency of students response item number 2. That figure as follow :
Figure 4.11
2 6
32
54
6
0 10 20 30 40 50 60
Category 1
SA
A
N
D
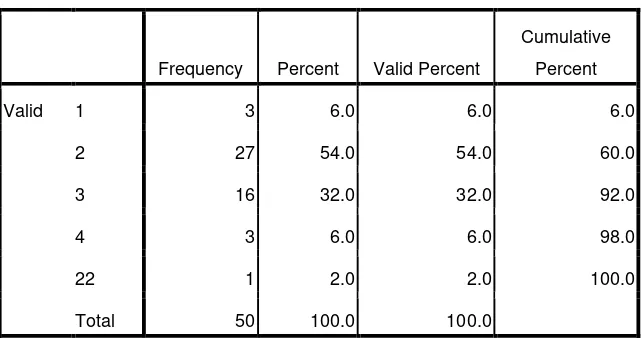
SD From the Item 4, with stetement is “Students are like non-TBI course than English or TBI course more”. We can see the frequency and precentage response of the students as follow in the table :
Table 4.12 Display of students response to question number 4
Frequency Percent Valid Percent
Cumulative
Percent
Valid 1 3 6.0 6.0 6.0
2 27 54.0 54.0 60.0
3 16 32.0 32.0 92.0
4 3 6.0 6.0 98.0
22 1 2.0 2.0 100.0
Total 50 100.0 100.0
By the table above, writer describe the result into a figure for displaying the percentage and frequency of students response item number 4. That figure as follow :
Figure 4.12
24
40
24
12
0 10 20 30 40 50
Category 1
SA
A
N
D
SD From the Item 8, with stetement is “in learning Non-TBI course students are be able professional teacher..”. We can see the frequency and precentage response of the students as follow in the table :
Table 4.14 Display of students response to question number 8.
Frequency Percent Valid Percent
Cumulative
Percent
Valid 2 6 12.0 12.0 12.0
3 12 24.0 24.0 36.0
4 20 40.0 40.0 76.0
5 12 24.0 24.0 100.0
Total 50 100.0 100.0
By the table above, writer describe the result into a figure for displaying the percentage and frequency of students response item number 8. That figure as follow :
Figure 4.14
18
35 35
8
2
0 5 10 15 20 25 30 35 40
Category 1
SA
A
N
D
SD From the Item 11, with stetement is “Students like TBI course than Non-TBI course.”. We can see the frequency and precentage response of the students as follow in the table :
Item 4.16Display of students response to question number 11
Frequency Percent Valid Percent
Cumulative
Percent
Valid 1 1 2.0 2.0 2.0
2 4 8.0 8.0 10.0
3 18 36.0 36.0 46.0
4 18 36.0 36.0 82.0
5 9 18.0 18.0 100.0
Total 50 100.0 100.0
By the table above, writer describe the result into a figure for displaying the percentage and frequency of students response item number 11. That figure as follow :
Figure 4.16
24
52
24
0 10 20 30 40 50 60
Category 1
SA
A
N
D
SD From the Item 17, with stetement is “the value of course of TBI have to more than Non-TBI”. We can see the frequency and precentage response of the students as follow in the table :
Table 4.17Display of students response to question number 17.
Frequency Percent Valid Percent
Cumulative
Percent
Valid 3 12 24.0 24.0 24.0
4 26 52.0 52.0 76.0
5 12 24.0 24.0 100.0
Total 50 100.0 100.0
By the table above, writer describe the result into a figure for displaying the percentage and frequency of students response item number 17. That figure as follow :
Figure 4.17
8
42
48
2 0
10 20 30 40 50 60
Category 1
SA
A
N
D
SD From the Item 18, with stetement is “the value of Non-TBI course can increase students values.”. We can see the frequency and precentage response of the students as follow in the table :
Table 4.18Display of students response to question number 18.
Frequency Percent Valid Percent
Cumulative
Percent
Valid 2 1 2.0 2.0 2.0
3 24 48.0 48.0 50.0
4 21 42.0 42.0 92.0
5 4 8.0 8.0 100.0
Total 50 100.0 100.0
By the table above, writer describe the result into a figure for displaying the percentage and frequency of students response item number 18. That figure as follow :
Figure 4.18
12
28
38
16
6
0 5 10 15 20 25 30 35 40
Category 1
SA
A
N
D
SD From the Item 19, with stetement is “The students are graduation from high school are more difficult to study religion course.”. We can see the frequency and precentage response of the students as follow in the table
Table 4.19Display of students response to question number 19.
Frequency Percent Valid Percent
Cumulative
Percent
Valid 1 3 6.0 6.0 6.0
2 8 16.0 16.0 22.0
3 19 38.0 38.0 60.0
4 14 28.0 28.0 88.0
5 6 12.0 12.0 100.0
Total 50 100.0 100.0
By the table above, writer describe the result into a figure for displaying the percentage and frequency of students response item number 19. That figure as follow :
Figure 4.19
From the result of the data review in the the table and figure above writer describes and recapitulation the data into statistical frame :
Statistics
VAR01 VAR02 VAR03 VAR04 VAR05 VAR06 VAR07 VAR08 VAR09 VAR010
NValid 50 50 50 50 50 50 50 50 50 50
Missing 0 0 0 0 0 0 0 0 0 0
Mean 2.6000 2.9000 2.7800 3.5000 3.7600 3.6000 3.6000 4.0000 3.5600 3.2400
Median 3.0000 3.0000 2.0000 3.5000 4.0000 4.0000 4.0000 4.0000 3.5000 3.0000
Mode 3.00 3.00 2.00 3.00a 4.00 4.00 3.00a 4.00 3.00 3.00
Std. Deviation .90351 1.12938 2.85921 .90914 .95959 .98974 .94761 .69985 .67491 1.06061
As see at thequestion number 1, 4, 6, 9, and 11 were general
statements is “how respon students about the suitable Non-TBI courses to
TBI courses who has implemented in 2011 curriculum of English Education
Study Program”. some students has understand what the purpose of
In other hand, almost students disagree with statement if the Non-TBI courses make students dificult to increase their IPK (see item 2, 17, 18, 19, 20). That describes if students not worry if the Non-TBI courses still implemented, furthermore their from General Senior High School or Islamis School and Dormitory School (item 2, 19, 20). but in aplied students hope the TBI value have more than Non-TBI value in score to increase students’ IPK and to mastering english clearly (see item 17).
In conclusion, students still need Non-TBI course that same likes the vision/mission of the English Education Study Program to create and make the graduation of Professional English Teacher who integrate and interconnection to some Non-TBI courses to be Islamic Professional English Teacher. the students mostly need study Non-TBI courses with the point is they need to develop their knowledge and experience in another skill as like Human Developing Resource, or Entrepreneurship courses.
In addition, the Non-TBI courses is still need to implemented in English Education Study Program of STAIN Palangka Raya, but need evaluate for the quantity and quality of that courses, so that students will more interest in study English and Non-English courses who can increase
students’ Commutative Score.
2. Data Analyses of Interviews
The writer did the interview for making reliable and supporting the data was found. The results of the interview as follow:
a) ZI
ZIis a students in sevent semester of 2011-2012 academic years in English Education Study Program. He wa became more spirit to learn when the 2011 curriculum was implemented. He became more understood and focused on the English courses. He felt the 2011 curriculum gave many improvements for him skills in English and teaching English. ZI felt the implementation of 2011 curriculum was success.1
b) FA
FAis a students in sevent semester of 2011-2012 academic years in English Education Study Program. FAfelt satisfied on the implementation of 2011 curriculum. He focused on the English learning process in the class. He said that the curriculum 2011 made the situation in the class was not boring as the past semester. The 2011 curriculum also has affected his English skills and teaching English skills. FA wanted the lecturer improving their teaching language strategy for making the class being an interesting class.2
c) WT
1
Zainuri, Personal Interview, on November 4th, 2014
2
WT is a students in sevent semester of 2011-2012 academic years in English Education Study Program. According to WT, she thought the curriculum as the program of the institution on the learning process. She felt the implementation of 2011 curriculum has affected her English language skills and teaching skills. She realized that the 2011 curriculum made her IPK has grown during the implementation of 2011 curriculum. WT said that the role of teacher in the class was one of the parts of the institutions. Teachers or lecturers have their capability for reconstruction the curriculum as the program of that institution. In short, TKS supported the curriculum changing and evaluation for giving the multiple effects to institution. She also felt the 2011 curriculum was a good program however needed to be evaluated.3
d) ERV
ERV is a students in sevent semester of 2011-2012 academic years in English Education Study Program. She focused on the Islamic courses. She felt the curriculum 2011 has been implemented very well even though there was something to evaluate. The distribution of the courses in TBI was not relevant in some courses. She also thought the curriculum 2011 gave the improvement for her skill in English. In other hand, the English language skills did not improve as same as her English skills. YWND felt the curriculum 2011 should be evaluated in
3
the distribution of the courses. Moreover, the implementation of 2011 has affected on her skills to be an English teacher.4
e) BDYO
BDYO is a students in sevent semester of 2011-2012 academic years in English Education Study Program. He thought the curriculum as the planning for reaching the purposes. He said TBI has the purpose for making the professional teacher. He felt the implementation of 2011 curriculum was a good planning and strategy for developing their skills in English and teaching English. BDYO said the affect of the implementation of 2011 curriculum for the students was based on the students itself. He believed who wanted to get the best value and results should do the best also. The evaluation and changing the curriculum 2011 he was happy because many of Islamic Learning in TBI was deleted and changed to be creative English learning and English elements.5
B. Discussion
The writer problem stated are : “How is the students’ response of the
implementation of 2011 curriculum by English Education Study Program?” and
“how is the students’ perseception toward Non-TBI course in impelementation
4
Yuwinda, Personal Interview, on November 4th, 2014
5
2011 curriculum in English Education Program of STAIN Palangka Raya?”
Hence, the question looked for the answer. To answer the problem of the study above, the writer has done the study in this research.
In other hand, the instructions stated in the questionnaire described 2 results there were response of students for the implementation of 2011 curriculum and Non-TBI course as perceived by students of English Education Study Program. Those writer discuses above :
a. English Students’ Perception toward the Implementation of 2011
curriculum of English Education Study Program of STAIN Palangka Raya.
The writer did the research on the problem as stated previously. The data were found indicated that the implementation of 2011 curriculum as perceived by the sixth semester students of English Education Study Program. The writer gave the questionnaire as the instrument for measure the information. The questionnaire that the writer used was adopted by the 2011 curriculum of English Education Study Program. Therefore, the questions in the questionnaire focused on the courses and the qualifying of graduation into a professional or vocational field.
a great influence on curriculum implementation.6 For understanding and
describing the success of the implementation measuring by the students’
perception on the implementation therefore the writer did the formative evaluation. Evaluation may be carried out as part of the process of the program development in order to find out what is working well and what is not and what problems need to be addressed.7
The learners were the central figure in the curriculum implementation
process. Students’ perception toward the implementation was one of the ways
to measure the successful of the implementation. Implementation takes place as the learner acquires the planned or intended experiences, knowledge, skills, ideas and attitudes that are aimed at enabling the same learner to function effectively in a society.8 Perception was also a process of how people select, organize and interpret input information and experiences that exist and then interpret them to create a whole picture that matters.9 The discussion of the
results’ of this study as follows:
The result of this subject were 50 students on sixth semester of English Education Study Program. Their response by the answer of question number 12 that describe if the implementation of 2011 curriculum are balance there were Strongly Agree is 4% (2 student), Agree is 10% (5 students), Neutral is 66 % (33 students), disagree is 20% (10 students), strongly disagree 0 % (0 student). In addition students response for agree is 14 %, Neutral is 66 %, and
6
University of Zimbabwe, Curriculum Implementation, Change and Innovation, p. 8
7
Jack C. Richards, Curriculum Development in Language Teaching, p. 288.
8
University of Zimbabwe, Curriculum Implementation, Change and Innovation, p. 8.
9Norjennah, “The Students’ Perception Toward EFL Teachers’ Feedback on Oral
disagree is 20%. We can see of the result of the implementation of 2011 curriculum of English Education Study Program of STAIN Palangka Raya still make students confuse in the groups of courses as like as there were MPK for 6,37 % as the groups of course in Human Developing Resource, MBB as Social Culture were 10,19 %, MK as the course of Knowledge and Experience were 12,74%, Required and Elective Courses of TBI were 66,88% and last MPB as the Attitude of Creativity are 3,82.
In other hand the curriculum has good enough for implemented for 2011/2012 academic years of English Education Study Program, but any some evaluating as mention previously by Levy in chapter II, he affirms that curriculum in general, is the overall plan of the content or specified material of interaction that the school should offer the learners by way of qualifying him or her for graduation or certification or for entrance into a professional or vacation field.10
In conclusion, the data were found by doing the research on the
students’ perception toward the implementation of 2011 curriculum described
the implementation of 2011 was success but need evaluation in some aspect as like the materials of course must be relevant for the future as item number 1, 3 and 5. The students want to develop and mastering English skill who can integration and interconnection for some basis general and religion knowledge and experience.
10
b. English Students’ Perception toward the Non-TBI Courses in Implementation of 2011 curriculum of English Education Study Program of STAIN Palangka Raya.
By the statement above the writer conclude that the students agreed on the subjects or courses offered in the curriculum 2011 has in accordance with
the students’ need and the vision/mission of the English Education Study
Program because of their experiences as the learners. The learner factor influences teachers in their selection of learning experiences, hence the need to consider the diverse characteristics of learners in curriculum implementation.11Example from item 19 and item 20 there were describes if Graduation school is give an effect for student in learning in English Education Study Program of STAIN Palangka Raya.
There were students agreed if the study Non-TBI courses like religion courses they need have basic knowledge, that was make them difficult in study because the quantity of religion subject in school are just once class.
So’ they have to began from firstly. The students felt the subject of general
and religion have to decrease than before. It can help them to increase and developing English skill and Mastering English.
In other hand, students still need Non-TBI course that same likes the vision/mission of the English Education Study Program to create and make the graduation of Professional English Teacher who integrate and interconnection to some Non-TBI courses to be Islamic Professional English Teacher. That can we see on item 5, and item 8 there were Strongly Agree is
11
24% (12 student), Agree is 40% (20 students), Neutral is 24 % (12 students), disagree is 12% (6 students), strongly disagree 0 % (0 student). In conclude, the students mostly need study Non-TBI courses with the point is they need to develop their knowledge and experience in another skill as like Human Developing Resource, or Entrepreneurship courses.
In addition, the Non-TBI courses is still need to implemented in English Education Study Program of STAIN Palangka Raya , but need evaluate for the quantity and quality of that courses, so that students will more interest in study English and Non-English courses who can increase
students’ Commutative Score.
c. The data interview also gave the similar results
The data interview also gave the similar results with the data were foundin the questionnaire. By doing the interview on 5 students in seventh semester, the writer got the data that ZI, FA, BDY, WT, and ERV stated the distribution and the groups of the courses in the 2011 curriculum was good. The interview results is available in appendix III.
Item 3,5,7,10,12,13,14,15 and 16which have been classified into the subject matters in curriculum elements. This is similar for thequestion
number 3 the statement is “Non-TBI course is not relevant in curriculum”
But the curriculum should be make more balancing and have to be students need or students interest.
And the item 12 and 13 there were they agree. That describes that students still confuse of the curriculum that has implemented There were some aspect and some courses changed, but some students still not ready yet, so it make some students who are still not passing yet of one of the course felt difficult when they recourse or take the subject again to complete they value.
Some aspect that the curriculum have to evaluate are the composition of the courses as like the time of learning, the value of the courses, the facility and lecturer methode, than the facility as handsbook, syllabus. They need more comprehend in mastering English or non english courses clearly.
implementation process. Implementation takes place as the learner acquires the planned or intended experiences and the perception was also a process of how people select, organize and interpret input experiences that exist and then interpret them to create a whole picture that matters.
By the statement above the writer conclude that the students disagreed on the subjects offered in the curriculum 2011 has in accordance with the students’ need and the vision / mission of the English Education Study Program because of their experiences as the learners. The learner factor influences teachers in their selection of learning experiences, hence the need to consider the diverse characteristics of learners in curriculum implementation.12 The classroom practice, the learners were actually transmitted and adopted from the official curriculum. The official curriculum could be quite different from the curriculum that was actually implemented. Therefore, the students felt the subject offered in 2011 curriculum was not in accordance with their need and the vision / mission of the English Education Study Program.
The first, the respondents thought the lecturers should be mastery on the specific course. The quantities of the lecturers also should be added by the English Education Study Program and the last the students wanted the non-TBI clas it just additional classes as effective as possible. Then, the respondents wanted the learning experiences, the students’ need as
12
consideration of the curriculum implementation. In addition, a few of them also stated that before doing the implementation of curriculum, the students
should be given the information for avoiding the students’ misunderstanding
toward the implementation.
In conclusion, the data were found by doing the research on the students’