CHAPTER III
RESEARCH METHOD
This chapter consists of research type and design, Place and Time of the
Study, Population and Sample, Research Instrument, Data Collecting Method,
and Technique of Data Analysis.
A. Research Type
The type of this research is quantitative research. Quantitative research is
based on the measurement of quantity or amount. It is applicable to phenomena
that can be expressed in terms of quantity.57 It is because this research is purely quantitative with questionnaire as the main instrument to obtain the data
which was in the form of numerical in the statistic analysis.
B. Research Design
The research design of this study is correlation research. According
Donal Ary “Correlational research is nonexperimental research that is similar
to ex post facto research in that they both employ data derived from preexisting
variables. There is no manipulation of the variables in either type of
research”.58 In correlation research, Before a researcher starts to do the research, firstly make the planning. The planning, it self, is named as research
design. Based on Arikunto research design is a plan or program made by a
researcher, as the activity target that will be done.59
57
C.R Kothari, Research Methodology, New Age International (P), Jaipur (India), 2004, p. 3
5858
Donal Ary, Lucy Cheser Jacobs,and Chris Sorensen, Introduction to Research in Education, p. 349.
59
Suharsimi Arikunto, Dasar-dasar Evaluasi Pendidikan. Jakarta: Bumi Aksara. 2002, p.45
A correlation relationship is summarized by using a descriptive statistic
called a correlation coefficient. A positive correlation coefficient means that as
one variable increases, the other also increases. A negative correlation
coefficient means that as one variable increases, the other decreases. Morissan
describe positive correlation and negative correlation as bellow.60
Positive Correlation Negative Correlation
Var X Var Y Var X Var Y
Var X Var Y Var X Var Y
The size of of the number (regardless of the sign) indicates how strong the
relationship is between the variables.
C. Place and time of the study
A research was conducted at Palangka Raya, especially at Campus of IAIN
Palangka Raya. This research took a month to collect the data.
D. Population and Sample
1. Population
According to DonalAry „a population is defined as all members of any
well defined class of people, events or objects.61 According to Suharsimi population is the total number of the subjects of an investigation.62
60
Morissan, Metode Penelitian Survei,Kencana Prenadamedia Group, jakarta:2012, p.378 61
DonalAry(et...all) Introduction to Research in Education, p.129. 62
The writer concluded that population is a number of groups interest to the
researcher, a number of groups which she would like to make the results of the
study to be reported. The population in this study is all of students on sixth
semester, and eight semester of english students of The State Islamic Institute
of Palangka Raya in the academic year of 2015/2016 which consisted of 154
students.
Table 3.1 The Population of The Research
Semester Number
Semester 6 68
Semester 8 86
∑=154
Source data: from the Data of academic years 2015/2016
2. Sample
According to Suharsimi Arikunto, Sample is a part of population which
has same characteristics. There are two ways in selecting a sample. First, if the
population is less 100, all population can be sampled. Second, if the population
is over 100, the researcher can take 10%-15% or 20%-25% from all population
as a sample.63 For determine the sample, the writer used random sampling. In this research, the writer used the slovin formula:
Sample = N = 154 = 154 = 154 = 60,6 N.d2+1 154.0.12+1 (154).(0,01)+1 2,54
Minimum = 61
Sample = 70 Respondents
63
The writer used slovin‟s formula because the 10 % of the sample can
represent a number of population and the level of trust is about 90 % .64
From the formula above it can be derived that the sample is 70
respondents. Those 70 respondents are derived from the total population that is
all of the State Islamic Institute of Palangka Raya in the academic year of
2015/2016.
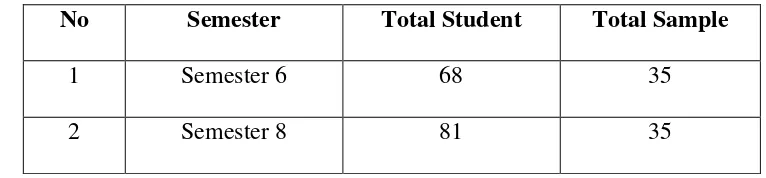
Table 3.2
The Sample of the research
No Semester Total Student Total Sample
1 Semester 6 68 35
2 Semester 8 81 35
E. Research Instrument
1. Instruments
To get the data accurately, it is important to use the instrument, for it is the
tool to get the data on the field. In collecting the data, questionnaires, and
documentation was used in this research to answer the problem of the study.
a) Questionnaire
A questionnaire instruments was used in this study. Zoltan Dornyei stated
questionnaire is any written instruments that present respondents with a series
of questions or statements to which they are to react either by writing out their
64
answers or selecting from among existing answers.65 The two main types of questions are open-ended and close-ended questions.66 In this case, the writer using the questionnaire close-ended is questionnaire that presented in a form
such that the respondents were asked to choose one answer that suits the
characteristics of him by giving the sign (x) or a checklist (√).
The writer used questionnaire to get the data about vocabulary learning
strategies. The vocabulary learning strategy questionnaire was adapted based
on Zhang Yunhao (Kristianstad University:Chinese, 2011)67 with some modification. It is because the writer claimed that if took or use the present
questionnaire, it would be helpful, effective and efficient.
In compiling the results of the research, the coding has been done, because
Likert scale is used, and the interval scales also is used to code the question.
The questionnaire is constructed in the form of Likert scale. Each response is
given a number for example strongly agree = 4, agree = 3, disagree = 2, and
strongly disagree = 1. And the questions in this study is in the form of check
list items. To avoid confusion, the questionnaire was written in indonesia.
65
Zoltan Dornyei, “Questionnaires in Second Language Research Construction, Administration, and Processing” London: University of Nottingham, Lawrence Erlbaum Associates, Publishers, 2003, p.6.
66
Sandra Lee Mckey, Researching Second Language Classroom, , London: Lawrence Erlbaum Associates, Publishers2006 p. 37.
67
Zhang Yunhao, The Use of Vocabulary Learning Strategies by Good and Poor Language LearnersA case study of Chinese non-English major sophmores, Chinese ;Kristianstad
It is because not all students have same skill in understanding L2. So that
the writer adjust the language with the ability and the condition of students.
b) Documentation
Documentation provides the researcher with information that is used to
support the available data. Based on Sugiyono “Dokumentasi adalah mencari
dan mengumpulkan data mengenai hal-hal yang berupa catatan, transkip,
buku, surat kabar, majalah, notulen, rapot, agenda dan sebagainya”.68
In order words, it can be stated that documentation is used to collect data
through printed materials. It means that the writer collected written data, such
as the amount of the students on sixth and eight semester of english students of
The State Islamic Institute of Palangka Raya, the result of vocabulary
questionnaire, and the value result of speaking (KHS of speaking). In this
research, the writer did not take a test by herself, but collect students‟ score
from their value result of speaking (KHS of speaking).
Based on yuliana in her research it is because to get scoring in speaking
performance, we can not only give one test, but it needs on-going assessment
or test. In this test, the lecturer had some criteria to score the students‟ability,
as fluency, performance or pronunciation. This criteria made the lecturer was
easier to score and more objective.69 So, the writer only took the value result of speaking (KHS of speaking) several reasons such as; first,it does not require
much time, second, it doesn‟t need the others people as an inter-rater.
68
Sugiyono, Metode penelitian Kuantitatif Kualitatif dan R&D, Alfabeta, Bandung, 2013. P, 240
69
And the thrid, this technique makes it possible to take a larger sample
because it takes a relatively short time.
2. Research Instrument Try Out
Try out is used to measure the suitable instrument for students‟ vocabulary
building strategy. The try out was done to the sixth and eight semester students
by English students of the IAIN of Palangka Raya who did not become sample
in this study, then the writer chose student in different semester to try out the
quesionnaire.
Procedures to do try out were:
a) The writer gave try out to the students who did not become research
sample.
b) The writer collected the answers and gave score to the respondents.
c) The writer analyzed the respondents score to find out instrumen reliability
and validity use SPSS version 18.
3. Instrument Reliability
The good instrument in a study is not only the the instrument valid but also
reliable to measure what suppose to be measured.
According to Donal Ary, “Reliability is concerned with the effect of error
on the consistency of scores. Reliability is consistent in measuring whatever it
is measuring.70
The reliability of a measuring instrument is the degree of consistency with
which it measures whatever it is measuring.
70
On a theoretical level, reliability is concerned with the effect or error on
the consistency of scores.71 To measure the reliability of the questionnaire and speaking score, the writer used SPSS Program in order to make easy and valid.
The scores of tryout can be seen at the appendices I.
4. Instrument Validity
One of the requirements of a good instrument is the instrument must be
valid. Validity is defined as the extent to which scores on a test enable one to
make meaningful and appropriate interpretations.72 Validity is the most important consideration in developing and evaluating measuring instruments.
a. Face Validity
Face validity is taken to ensure that the questionnaire is valid. Face
validity is a term sometimes used in connection with a test‟s content.
Face validity refers to the extent to which examinees believe the
instrument is measuring what it is supposed to measure.73
The face validity of the test items is that this questionnaire used to measure
the students‟ perception of vocabulary building strategy.
b. Construct Validity
Costruct validity is type of validity which assumes the existence of certain
learning theories or constructs underlying the acquisition of ability and skill.74 The item questionnaire is constructed based on students perception about
vocabulary learning strategy. The instrument measures certain spesific
71
Ibid., p.237. 72
Ibid., p.224. 73
Ibid.p.228 74
questionnaire. It means how the instrument ability can cover the indicator of
english vocabulary learning strategy.
c. Content Validity
Content validity demands the appropriateness between the ability to be
measured and the test being used to measure it.75 In this study the instrument for collecting the data must be valid. It means the items in the instrument are
equal and proportional in their distribution as the indicators of qustionnaires.
F. Data Collecting Procedure
Collecting data is the most important step in conducting the research.
Before conducting the real test, the writer cconducted a try out test and then
analyzed the test to get its validity, reliability, difficulty of level and
discriminating power of each item of the test. In this research, there were two
steps to collect the data, questionnaire and speaking test.
To collect the objective data, this research has several steps as follows:
1. The writer preparing the questionnaires.
2. The writer giving the questionnaire to the respondents try out.
3. The writer Collecting the responses.
4. The writer Calculating the result of responses.
5. The writer Analyzing the data obtained using SPSS version 18.
6. The writer Concluding the students‟ perceptions of vocabulary building
strategy in the English class of English Education Study Program at IAIN
Palangka Raya.
75
7. The writer Collecting the data value result of students speaking (KHS
Speaking).
8. After obtained students‟ result of questionnaire, the writer compared the
result with students‟ score for speaking test. To know and analyze the data,
the researcher using SPSS program that would be easier.
G. Normality Testing
In quantitative research, it important to know the normality of the data. An
assessment of the normality of data is a prerequisite for many statistical tests
because normal data is an underlying assumption in parametric testing.
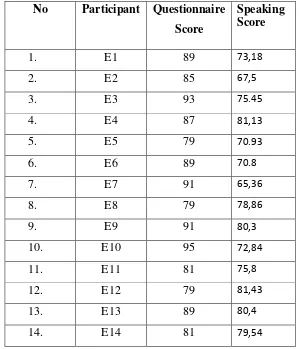
Table 3.3 The data of two variables.
No Participant Questionnaire
Score
Speaking Score
1. E1 89 73,18
2. E2 85 67,5
3. E3 93 75.45
4. E4 87 81,13
5. E5 79 70.93
6. E6 89 70.8
7. E7 91 65,36
8. E8 79 78,86
9. E9 91 80,3
10. E10 95 72,84
11. E11 81 75,8
12. E12 79 81,43
13. E13 89 80,4
From the data above, the researcher found out whether the data is normal
or not by using SPSS program. The result can be looked below:
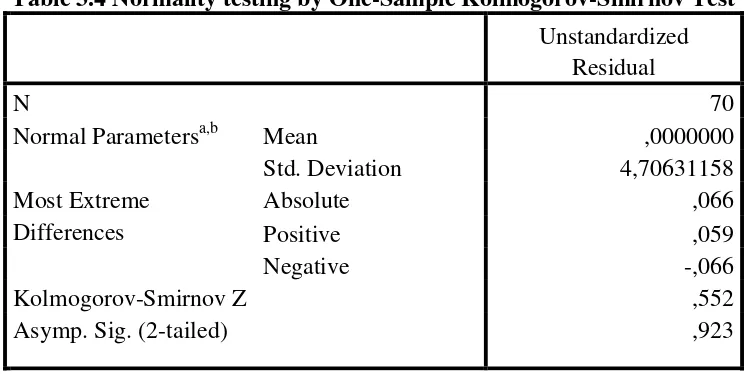
Table 3.4 Normality testing by One-Sample Kolmogorov-Smirnov Test
Unstandardized Residual
N 70
Normal Parametersa,b Mean ,0000000
Std. Deviation 4,70631158
Most Extreme Differences
Absolute ,066
Positive ,059
Negative -,066
Kolmogorov-Smirnov Z ,552
Asymp. Sig. (2-tailed) ,923
Hypothesis testing:
a. Ho accepted if N. Sig < 0,05
b. Ha rejected if N. Sig > 0.05
As the table show above, the percentage of the significance (Sig.) 0,923>
0,05 it means the distribution data is normal.
H. Technique of Analyzing Data
After all data have been collected, the next step is analyzing the data. To
analyze the data obtained from the field, several techniques are conducted as
follow:
1. Examination and scoring on each questionnaires.
2. For the vocabulary building strategy questionnaires rated between 1 and 4.
Which consisted 12 items.
3. Calculating the results of the vocabulary building strategy questionnaires
4. Calculate the value result of speaking I (one), II (two) and speaking III
(three). For the students speaking test, as the writer said above, the score
collecting from their value result of speaking (KHS of speaking). There
were many score that the lecturer had (students‟ tasks, mid-term test, UAS).
After the writer got the score of students‟ speaking score, then calculated
them until got the final score.
5. To find out the correlation both the two variables, the writer used the
formula as below:
d. Pearson Product Moment formula as follows76:
rᵪᵧ
= N.(Σху)- (Σх)( Σy)
√
[
N(Σх²)-( Σх )2][
N(Σ у²)-( Σу)2]
Where:
rxy : The coefficient of correlation
∑X : Total Value of Score X
∑Y : Total Value of Score Y
∑ XY : Multiplication Result between Score X and Score Y
N : Number of students
The formula above is very important due to finding out whether or not the
(Ho) Hypothesis or (Ha) Hypothesis is accept in this research. A correlation
greater than 0.5 is generally described as strong, whereas a correlation less than
0.5 is generally described as weak. These values can vary based upon the
"type" of data being examined.
76
However, to get the correlation both of the variables the writer used
manual calculate and also used SPSS 18 application. Then the writer used the
distribution (t table) for ɑ = 0, 05 (significance of 5% or 0, 05, is a standard
measure that is commonly used in research.)77.
The writer used the 5% significant level because field of research is
language subject not an exact subject. In the language study, it is better to use
5% significant level. On the other hand, for exact study it is better to use the
1% significant level. The writer determined the table interpretation of product
moment scales, as follow:
Table 3.5 interpreted to the criteria by Riduan78
Correlaation Value (r) Interpretation
0.800 – 1.000
0.600 – 0.800
0.400 – 0.600
0.200 – 0.400
0.000 – 0.200
Very High Correlation
High Correlation
Fair Correlation
Low Correlation
Very Low Correlation
From these formula, it could be gotten the correlation coefficient value (r) of
the two variables. And by the interpretation table, the writer can conclude the
strength of the correlation.
77
Riduan, Metode dan teknik Menyusun Thesis, Alfabeta,Bandung:2009, p.221 78