PRINCIPl:...ES OF
EXPERIMENTAL DESIGN
FOR ART CONSERVATION
RESEARCH
fi'rr;' j. Reedy
GCI SCIE NTIFIC PROGRAM RE PORT
.JANUARY 1 992
St,lt/( ,(If/S/I! ,) St,lgt' Ro,u/
S{'/I ',I rk, /)"/,111 'd n' I') -I 1 { 'I/I/'t'nlt}, a(/ )"!,III'dn' Art C(m,ct'r/'dt/{/Ii n''f'drflli''1/t ,w.) ( )/d ((I/I,Xt'
,\'t'll'drJ.', nt'I,III',n/' 1 ') -J(, 1/,,' ('-l'tt1' C(II/"'/'I'dt/(/I/ /wrltlif" '/ "i(l.) (,-Iolml' A 1,,'/1/1,'
PRIN CIPLES OF
EXP ERIMEN TAL DESIGN FOR ART CONSERVAT ION
RESEARCH
Tnryj. Reedy eNnJrll L Reedy
GCI SCIENTIF"IC PROGRAM REPORT
.JANUARY 1992
SI4tlO",nJ 3 SIIII� RotUi
Nt1INlr/t. D�/m.vlln 19711
U"iwnity of D�Im.vtt" Art U1WTVIItio" D�lU'tmmt
303 0'" ulk:�
Nt1INlr/t. D�/m.vlln 19716
Tk Gdt] U1UmJlltw" Instituu 4503 GIntrH Avmw
CJ992bytMJ. PtnJGmy Trrut .11/ "lhls rrs6WJ
Uwt1' printNi 0" Simpso" Qunt. " r«yekJ st«1t rui"l} 00%
CONTENTS
PREFACE 1
1. CONSERVATION SCIENCE AND PRACTICE 3
1.1 CONSERVATION RESEARCH 3
1.2 CLASSIFICATION OF CONSERVATION RESEARCH & KNOWLEDGE 3
1.2.1 Phase 3
1.2.2 Study Types 4
1.2.3 ConseIVation Research Problems 4
1.2.4 Art Objects and Materials 5
1.3 EXPERIMENTAL DESIGN 6
1.3.1 literature SUIVey 6
1.3.2 Planning 7
1.3.3 Major Aspects of Experimental Design 8
2. THE SCIENTIFIC METHOD AND CONSERVATION RESEARCH 1 1
2.1 STEPS IN THE SCIENTIFIC METHOD 11
2.2 RESEARCH QUESTIONS 12
2.3 HYPOTHESES 13
2.3.1 Contingency 14
2.3.2 Multiplicity 15
2.3.3 Two Cautionary Tales 15
2.4 EXPERIMENTS AND OBSERVATIONS 16
2.5 ANAL YSIS AND INTE RP RET A TION 16
2.5.1 Statistical Hypothesis Testing 17
2.6 EXAMPLES 18
2.6.1 Technological Example 18
2.6.2 Scientific Example 18
2.6.3 ObseIVational Example 19
2.6.4 Summary Example 20
3. SINGLE-OBJECT STUDIES 23
3.1 ADVANTAGES AND USE 23
3.2 MEASUREMENTS ON SINGLE OBJECTS 24
3.2.1 One Measurement 24
3.2.2 Simultaneous Measurement of Multiple Variables 24
3.2.3 Two Measurements of One Variable 25
3.2.4 Repeated Measurements of One Variable 25
3.2.5 Treatment Effects 27
3.3 DESIGN 1: ONE TREATMENT INTERVAL 27
3.3.1 Random Selection from Multiple Intervals 27
3.3.2 Test Statistics 29
3.3.3 Treatment Randomization Tests 32
3.4 DESIGN 2: MULTIPLE TREATMENT INTERVALS 34
3.4.1 Example with Calculations 34
3.4.2 Selecting Combinations 36
3.5 OTHER DESIGNS FOR ONE TREATMENT ON A SINGLE OBJECT 37
3.5.1 Design 3: Single Treatment Patch 37
3.5.2 Design 4: Multiple Treatment Patches 37
3.5.3 Design 5: Multiple Treatment Patch-Intervals 38 3.5.4 Design 6: Paired Treatment-Control Intervals 39
3.5.5 Design 7: Order-Balanced Paired Intervals 39
3.5 MULTIPLE TREATMENTS AND CONDmONS 40
4. EXPERIMENTAL DESIGN 41
5.3 INFERENCE AND HYPOTHESIS TESTING 62
5.3.1 One-Sided and Two-Sided Tests 62
5.3.2 Randomization, Ranks, and Distributions 63
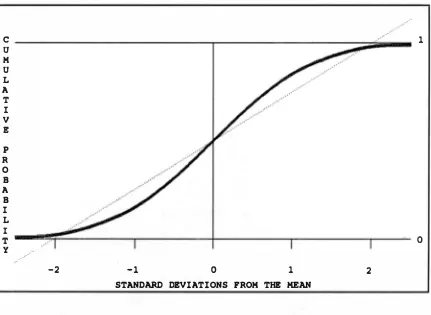
5.3.3 Tests Based on the Normal Distribution 64
5.3.4 Tests Based on Ranks 65
5.3.5 Points, Intervals, and Significance 66
THE AUTHORS
Terry J. Reedy
Dr. Terry 1. Reedy has degrees in mathematics, operations research, and ecology. He was a consulting statistician from 1979 to 1989 in the Biomathematics Unit of the Center for Ulcer Research and Education in the School of Medicine, University of California at Los Angeles. This work gave him broad experience with the practical problems of data analysis in scientific research. He also has experience in the problems of statistics in archaeometry, art history and conservation research. He currently works as an independent consultant and writer.
Chandra L. Reedy
PREFACE
The subject of this report is experimental design for art conservation research. It covers both practical and statistical aspects of design, and both laboratory experiments on art materials and clinical experiments with art objects. General principles developed in other fields are applied to concrete research problems in conservation. Problems encountered in conservation practice illustrate the points discussed. Most of the material should be comprehensible to working conservators and conservation scientists alike.
Chapters 1 and 2 set the scene by discussing conservation research and the scientific method. In broad terms, an experiment is planned, performed, analyzed, and reported. The remaining chapters generally focus on the design phase of research, which comes before the performance and analysis phases. They explore possibilities for designing experiments in art conservation but do not evaluate current practice.
Chapter 3 presents designs for experiments with single objects and the corresponding treatment randomization tests. Both subjects are ignored in most books on experimental design and statistical analysis, but they are especially pertinent to conservation research. The designs formalize and extend the current practice of testing treatments on small patches before treating a whole object. The corresponding statistical tests are comprehensible without esoteric assumptions and mathematical derivations. This material should be especially accessible to conservators without training in research and statistics.
Chapter 4 systematically examines the major aspects of design: goals, objects, measurements, and treatments. In chapter 7, this scheme is used to discuss a particular design: treatment trials directly comparing two or more treatments on art objects. The authors believe that more extensive and more rigorous use of this design would benefit conservation practice.
More traditional material on experiments with groups of objects and statistical tests based on normal distributions and ranks is presented in chapters 5 and 6. These chapters do not duplicate the detail found in books on these subjects. However, the preponderance of scientific experiments use the simpler designs given the most attention in chapter 6. This chapter ends with a work sheet that readers can use to design similar studies (section 6.5).
knowledge and can be skipped by those without. The STATISTICAL GLOSSARY & INDEX briefly defines many statistical terms and gives page references to their use in the text.
Our previous study and technical report, Statistical Analysis in Art Conservation Research (Reedy and Reedy 1988), reviewed 320 papers from the conservation literature, covering five years of four publications. It critically evaluated presentation of designs, data, and statistical analyses in this body of published art conservation research. Though written first, it is logically a sequel to this work. It gives several examples of statistical analysis of art conservation data and discusses issues of data organization and plotting that are not covered here.
This report results from a conceptual investigation combined with experience teaching this material to art conservation graduate students. It builds on and is colored by the senior author's statistical experience, which is primarily laboratory and clinical research at a university medical school. An agricultural or industrial statistician would certainly emphasize different topics. By its size, it is more of an overview than a detailed compendium. It is an opening statement rather than a closing argument. The authors invite reasoned reader responses.
Acknowledgments
CHAPTER 1
CONSERVATION SCIENCE AND PRACTICE
1.1 CONSERVATION RESEARCH
Art conservation practice combines philosophy, skill, and knowledge. Philosophy covers the goals and evaluation of conservation practice, including aesthetics, questions of restoration versus preservation, and questions of reversibility versus permanence. Skill comes from hands-on practice obtained in apprenticeships and training programs. Knowledge can be communicated but is originally derived from experience, either accidental or deliberate. This book discusses the design of intentional research projects aimed at increasing the knowledge of objects, materials, and processes that forms the basis of art conservation practice.
The purpose of research is to answer questions. In the field of conservation, theoretical questions involve some aspect of conservation science. Their answers add to a developing body of scientific knowledge. Practical questions deal with some phase of a conservation project. Such technological questions and their answers help achieve the goal of the project. Research can be directed at either technological or scientific questions. The principles used in research study design and experimental design can be applied to questions of both types. Both types of questions are covered in this book.
To put a boundary on the subject of conservation research, we require that it involve some art object or material. If several adhesives are studied "in the pot" by measuring variables such as viscosity, density, shelf life. and fume toxicity. then the subject is adhesive chemistry. Even if such work is done by a conservation scientist and is relevant to conservation practice, it is not conservation science as defined here. If one applies the same adhesives to some art material and then measures properties such as strength and discoloration. then the study falls within conservation science.
1.2 CLASSIFICATION OF CONSERVATION RESEARCH AND KNOWLEDGE 1.2.1 Phase
Conservation of an object has three possible phases:
Composition Deterioration
Treatment
Determining the composition of the object.
Determining how the object might or is most likely to deteriorate (for prevention) or how it has deteriorated (for remediation).
Composition, deterioration, and treatment are three major divisions or aspects of conservation. This scheme covers most studies published in the conservation literature. It is also useful as one basis for organizing research questions in conservation science.
This three-part categorization has direct analogies in medical science and medical practice. The study of COmposilion can be likened to anatomy and physiology, which cover the structure and function of the human body. Pathology and etiology include the nature and cause of disease (delerioralion). The corresponding phase of medical practice is diagnosis. Pharmacology (with the attendant practice of drug prescription) and surgery are two of the subareas of medical therapeutics (lrealment). Medical students study all these areas of medical science as a basis for medical practice. Research in medical science continues in all these areas.
1.2.2 Study Types
Conservation questions can be divided or categorized on another basis -- the subject or type of object studied:
Melhod
Objecl
Class
SUmJgale
A particular technique, process, or type of equipment.
An art object, or a few objects, considered individually.
A generic class of art objects, with particular objects possibly used as illustrative or experimental material.
Art materials or objects made from art materials especially for the study.
A class of objects can include all the objects in a large collection or a group selected by any reasonable criterion. The dividing line between an object study of a few objects and a class study of a small group is sometimes a bit fuzzy. When a group is so large that one cannot study each object with individual attention, then one is doing a class study.
The key to surrogate studies is the use of art materials in place of actual art objects. Surrogate objects may be artificially aged and given possibly dangerous treatments. Occasionally, old materials that have aged naturally are available. Other advantages of surrogates are the availability of as much material as needed and the freedom to do destructive testing. The disadvantage is that results must be extrapolated to real objects, sometimes with questionable validity.
1.2.3 Conservation Research Problems
Composition Method
Quantitative determination of red anthraquinone dyes on ancient textile fibers (Wouters 1985).
Identification of the pigments in the "Peacock Room" by Whistler (Winter and FitzHugh 1985).
Presence of manganese black pigment on Etruscan terracottas (Schweizer and Rinuy 1982).
Discrimination between re-creations of three nineteenth century blue textile dyes (Cordy and Yeh 1984).
Rapid determination of exhibition and storage materials likely to tarnish silver objects (Daniels and Ward 1982). Nature and cause of sandstone deterioration on a reconstructed eighteenth-century building in Bern, Switzerland (Zehnder and Arnold 1984).
Contribution of various weathering processes to deterioration of rock art inside caves (Dragovich 1981). Effect of temperature and humidity change on cracking, splitting, and anisotropic movement of ivory (Lafontaine and Wood 1982).
Rapid and easy testing of polyethylene glycol (PEG) penetration in wood stabilization (Hoffmann 1983). The most efficacious and safe solvent-reagent system for cleaning the damaged gilding on the "Door of Paradise" panels by L Ghiberti (Fiorentino et al 1982).
The best method for eliminating chlorides from highly corroded excavated iron objects (Rinuy and Schweizer 1981).
Effectiveness of benzotriazole (BTA) for inhibiting the corrosive behavior of stripping reagents used on bronze while still allowing the patina to be removed (Merk 1981).
Books, works of art on paper, paintings, textiles, and photographs are legitimate areas of specialization, each with their own problems and practices. Their common feature is that they are basically two-dimensional, with a thin third dimension consisting of image material superimposed on a mechanical substrate. Image materials -- such as ink, pigment, dye, and silver nitrate -- all have the unfortunate property that they can fade and change colors. Substrate materials, such as canvas, paper, textile, wood, and plaster, have the common problem that they can lose strength and fall apart.
Here is one possible classification of art materials and objects:
Two-Dimensional /mage
Three-Dimensional Object
substrate wood canvas textile paper glass plastic leather
image paint
dye
silver grains ink
gilding
wood stone metal glass plastic
1.3 EXPERIMENTAL DESIGN 1.3.1 Literature Survey
(b) the reporting of design, data, and analysis. Our primary purpose at that time was to quantify, categorize, and evaluate the statistical methods used in conservation research.
We discovered that few papers in the conservation literature had any formal statistical content. For only 10% of all papers could we say that the experimental design was such that the statistical technique of hypothesis testing could and should have been applied. For nearly half of the studies none of our evaluation categories, not even description-of-treatment number, was applicable, because the experimental design did not allow for it.
In Statistical Analysis we said that many of the studies reviewed could have been designed to make numerical techniques and statistical analysis applicable and useful, but that design questions were beyond the scope of that volume. Here we examine the appropriateness and tradeoffs of various experimental designs in relation to conservation research questions.
1.3.2 Planning
What is experimental design? In one sense, it is whatever one does in an experiment. It also refers to the action of planning. An experimental design is analogous to an architectural plan. One could start with the goal of building a two-story house with four bedrooms, three bathrooms, and a fireplace, but one usually would not immediately start to build. An
architectural plan would be drawn first. The degree of detail for experimental designs, as with architectural plans, ranges from a rough sketch to a complete finished plan.
A plan requires a goal and consideration of context. Chapter 2, which reviews the scientific method, discusses the scientific aspects of both goals and contexts. An important point is that a scientific experiment has to have the possibility of more than one result. The hypotheses behind the experiment should each be specific enough to be contradicted by one of the possible results. In other words, scientific hypotheses have to be falsifiable.
A major differentiation in study design is between experiments, which manipulate or treat objects with the intention of inducing a change, and observational studies or surveys, which do not. Survey measurements may cause unintentional and even undesirable changes, but these are not the focus of the study. An experiment concerning the effect of treatments must involve a new treatment that would not have been applied if the study were not done. Observation of the outcome of standard treatments that were or would be applied anyway, without the study, is a survey.
Since conservators take the composition of art materials and objects as given, composition studies of actual objects are surveys. Composition method studies may involve active experiments. Deterioration studies of real art objects are usually surveys. One can
objects. Chapter 3 shows how planned experimentation can be done with single objects that are to be treated. It is therefore particularly relevant for practicing art conservators.
1.3.3 Major Aspects of Experimental Design
Given the goal or question to be answered by a study, the major aspects of study design, discussed in detail in Chapter 4, are:
Objects
Variables
Treatments
Number, source, and method of selection or sampling� grouping of experimental units into homogeneous blocks to reduce the experimental error in the comparison of treatments or populations.
Number, measurement protocol, repetition, units, recording, and reduction.
Number, organization, and replication� assignment to experimental units in the design blocks� application protocol.
The answers to the questions implied by the list above (such as "How many objects?") largely make up a design. In this sense, Chapter 4 is a step-by-step guide to experimental design.
Unfortunately, cookbook answers are not possible. For example, there is no simple answer to the question of how many objects to study. It depends on the variability of objects, treatments, and measurements and on the desired precision of the answer. Workers in various fields develop rules of thumb. Such rules should be based upon relevant experience and statistical consideration of that experience. A general answer is to use as many objects or samples as required to get an answer that is both statistically and scientifically meaningful. Statistically, more is better. Scientific considerations usually give an upper limit, because the detection of very small differences is often unimportant. For instance, conservators would typically not consider it worthwhile to do enough samples to detect a 1 % difference in decay half-life between two treatments. At some point, it is scientifically more worthwhile to finish and publish the experiment and go on to the next. Economic and career considerations also come into play.
Chapter 6 presents designs for multiple object and multiple group studies. It incorporates the major aspects of design described in Chapter 4 into a variety of experimental designs for specific situations. The chapter ends with schematic outlines of several real examples and a work sheet that readers can copy or modify for their own use.
CHAYfER2
mE SCIENTIFIC MEmOD AND CONSERVATION RESEARCH
A science is a systematized body of knowledge usually comprising both facts and principles. It is derived from a sophisticated coordination of thought and action -- thought in the form of hypothesis and inference, action in the form of experiment and observation. Thought, though starting with prior knowledge, is modified on the basis of experience, and is used as a guide to action, which in turn leads to new experience, which is used to generate new thought, and so on. When coupled with publication and peer review of results, this iterative process is called the scientific method. It has been extraordinarily successful. It is as applicable to conservation and conservation research as to other practical applied endeavors. Modern science and scientific method dates from about the year 1600. Two primary innovators were Francis Bacon, the philosopher, and Galileo Galilei, the experimentalist. The number of scientist practitioners has since grown by several orders of magnitude, while a far smaller group continues developing the philosophy and history of science and the scientific method. Among the many recent discussions of the scientific method, our favorites include Chamberlin (1965), Platt (1964), Hempel (1966), and Harre (1981). These were the basis for the following discussion.
2.1 STEPS IN mE SCIENTIFIC MEmOD
The basic scientific method, which leads to rapid advance and progress in a scientific field, consists of several steps:
Observe Specify
Hypothesize
Record the observation or phenomenon stimulating the study.
Choose a research question, problem, or area of study as the basis for a research program. The question or problem should be explicit, clear, and answerable.
Explicitly construct alternative hypotheses. Write several possible answers to the research question or several possible explanations of the initial phenomenon.
Infer Work out the implications of the hypotheses. Write some concrete predictions. If a hypothesis is true, what therefore has to happen or be
Design
Explain
observable?
Devise tests to support or eliminate one or more of the hypotheses. Think of experiments that should generate the predicted phenomena.
Experiment
Analyze
Publish Build
Select objects, measure variables, and apply treatments according to the design. Observe what happens.
Analyze and interpret the results of the tests. Reduce the data, do statistical analysis, and compare actual results to expectations for the different hypotheses.
When appropriate, make results public for discussion and use by others. Repeat the procedure after constructing sub-hypotheses or sequential hypotheses to refine the possibilities that remain. If appropriate, refine the research question.
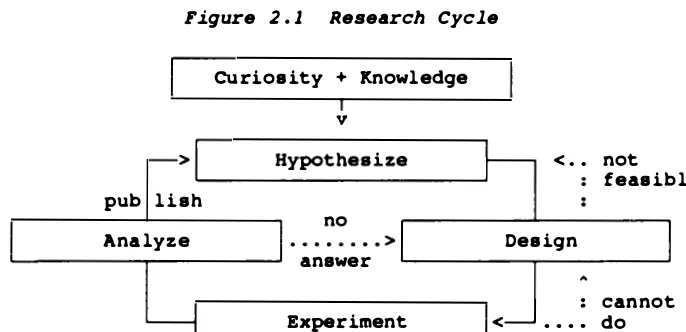
Figure 2.1 illustrates the research cycle, with backtracking for lack of success at any step. Figure 2.1 Research Cycle
CUrioaity + Knowledge
v
pub l iah
<
• • not feaa ibleAna lyze Dea ign
anawer
Experiment . . .
�
do cannotMajor questions usually require many studies and experiments. Progress begins by choosing experimental projects that are appropriate given current knowledge and feasible given current resources. Do not try to do everything in one research cycle. Progress continues by combining results from several studies. The new discipline of meta-analysis does this in a quantitative way. Glass, McGaw, and Smith (1981), Light and Pillemer (1984), and Hunter and Schmidt (1990) are recent presentations of the newest methods.
2.2 RESEARCH QUESTIONS
Research questions fall along a spectrum from technological (what happens, what results treatments have) to scientific (why). Between these two extremes are questions of when, under what conditions, to what degree, and with what patterns things happen. Additional types of questions concern variability, estimation error, and importance. Is something different enough from some neutral value to be worth additional attention?
usefully ask why. Once we establish a factual base, organization and unifying principles are pragmatically useful and intellectually satisfying. A modem trend in most applied disciplines is the development of a scientific base so that solutions to problems can be designed in light of predicted behavior rather than merely discovered through trial and error.
For example, an initial experiment with colorant C determines that C fades over time at a moderate rate. Further experiments investigate the relationship among light exposure, temperature, humidity, air pollutants, and fading rate. The answers allow interpolations that predict the outcome under conditions not yet tested. Experiments closer to the scientific end of the spectrum modify the composition of both the substrate for C and the air in the experimental chamber. Suppose ozone accelerates the fading of C regardless of the value of other variables. The next few experiments might then investigate the mechanism of this effect. This hypothetical example study started by identifying which factors had which effect and continued by finding out why.
For another example, a study of several colorants starts with ranking their degree of fading under a particular set of environmental conditions. The scientific study of these materials continues by developing an explanation for the observed ranking. This initially takes the form of partial correlations between fading and other properties of the colorants, such as structure and composition. These hint at some of the underlying relationships. These scientific answers lead to non-obvious predictions of the fading of previously untested colorants with better-than-random accuracy.
Discovery of structure-function relationships has become of intense interest, for instance, in the pharmaceutical industry, where trial-and-error searches may involve thousands of compounds. Science involves generalizations that enable us to make predictive jumps.
It may be hard work to refine and simplify a research question until it is unambiguous and clearly answerable in one particular experiment. A major question will often need to be split into subquestions. For example, "What causes deterioration of stone sculpture?" is too large a question to address in one experiment. It requires a major research program with a series of experiments each addressing subquestions.
2.3 HYPOTHESES
A scientist might address the question of why colorant C changes color by hypothesizing: (1) hydration reactions, (2) photo reactions, (3) chemical reactions with its substrate, or (4)
inherent instability. He or she needs an understanding of the chemistry of C to refine these hypotheses. The specific set of hypotheses developed should build on previous work by that experimenter and by others.
your work is often not obvious to others or to you at a later time. If it is not obvious how the hypotheses might answer the research question or how experimental outcomes might eliminate or support them, provide a rationale explaining the relationship.
If these steps are easy there is a tendency to think that they are not worthwhile. If they are difficult, there is a tendency to think that they are too much trouble. However, vague thinking and planning at the beginning of a study can lead, after months or years of work, to vague results with little or no value.
2.3.1 Contingency
Several authors have stated that a scientific hypothesis must be falsifiable. More exactly, it must be logically and psychologically contingent on experience so that there is some real possibility of refuting it. The evidence gathered from observation and experience must matter in order for the judgement rendered to be within the realm of evidential reasoning (Lett 1990).
A scientific hypothesis should not be contradictory and necessarily false regardless of the evidence. One is most likely to commit this error if one has a complicated hypothesis compounded from many simpler statements or if one combines into a single hypothesis competing hypotheses that should be kept separate. An example would be, "lbis chemical consolidates stone and this chemical does not consolidate stone."
A scientific hypothesis should also not be a logical tautology (true regardless of evidence) or a subject-matter platitude. "lbis chemical consolidates stone or this chemical does not consolidate stone" is a logical tautology. A subject matter platitude is a statement so weak that no practical amount of evidence could disprove it. An example is "lbis treatment might be valuable under some circumstance." A hypothesis should say something worthwhile but should not try to say everything.
Similarly, a scientific hypothesis must not be a value judgement, philosophical stance, or religious belief that is outside the influence of evidence or considered to be so by the individual involved.
Lett (1990) gives two ways to violate the rule of falsifiability. He summarizes these as "whatever will be, will be" (a platitude) and "heads I win, tails you lose" (philosophical slipperiness). The first violation is to make a broad, vague claim with little content and blank spaces that are filled in, if ever, only after evidence is collected. The second violation is to make a claim with some content, but then to generate excuses as needed to explain away contradictory evidence.
surface reaction. When she says that light accelerates fading, he says that lingrems absorb light and use the energy to enteate. She adds that ozone does the same. He adds that lingrems use it as an alternative energy source. When trying to replicate his experiment, she cannot destroy them with heat or cold. He claims that they have a super-resistent spore-like stage. If she cannot see them with light microscopy, he says that they are either transparent or too small, and she cannot see them with scanning-electron microscopy because they are destroyed by preparation for SEM. And so the dialogue continues without resolution.
2.3.2 Multiplicity
The scientific reason for having multiple hypotheses is that there may be multiple explanations or facets to the problem involved. A single hypothesis may misleadingly simplify complex relationships.
A psychological reason for having multiple working hypotheses, even if one of the hypotheses seems trivial, is to prevent over-attachment to any one of them (Chamberlin 1965). If everything depends upon supporting one hypothesis, the mind excels at seeking out or only noticing the evidence that tends to do so. One becomes remarkably blind to all evidence refuting it. Platt ( 1964) also discussed the subconscious tendency to try to force results to fit a pet hypothesis.
Another psychological reason is to prevent under-commitment, in the form of having no hypothesis. Being vague about what might happen is another trick the mind uses to avoid being wrong. This can be combatted by bearing in mind that it is hypotheses and not scientists that are wrong. Oearly stated multiple hypotheses combine the virtues of explicitness and flexibility.
If one can only think of or only has interest in one hypothesis, then it is always possible to derive a second by negating the first. This may result in a null hypothesis, as discussed in 2.5. 1. Section 2.6 has several examples.
2.3.3 Two Cautionary Tales
The first, personal, is a tale of under-definition. One of the senior author's first statistical assignments was to help organize and analyze 7 years and 5000 lines of clinical data comprising 4 tables with over 200 variables. Unfortunately, the medical investigator who started the project had died without leaving a written set of questions, hypotheses, and rationales for the data collected. From this mountain of data we extracted a mole of a result that generated one paper with little impact. The study continued, slightly revised, with a vague purpose that can be paraphrased, not unfairly, as "to see what we can see." The vague hypothesis was "we might see something worthwhile." Five years later, after a couple person-years of work distributed among several people and some frayed relationships, the data remained mute and the project abandoned with no scientific result.
more thermal energy coming out of a room-temperature electro-chemical cell than electrical energy going in. They hypothesized that the surplus heat was generated by a hitherto unknown cold fusion reaction. Apparently blinded by visions of a Nobel Prize, patent royalty millions, and a new future for humanity, they announced their hypothesis as a conclusion at a news conference. They did not properly consider and test the alternative hypotheses that nearly everyone else considered more likely. Only later did they submit a paper for peer review, which they withdrew when asked for certain methodological details. Although definite about cold fusion, they were vague about their methods. They explained negative results by others attempting to duplicate their results as due to undisclosed but essential differences in technique.
2.4 EXPERIMENTS AND OBSERVATIONS
The details of experiments and measurements are specific to the research questions and hypotheses. Later chapters discuss many of the general principles. An important question is, what is the simplest experiment that can exclude one of the hypotheses? A simple, short, elegant experiment that clearly eliminates one possibility is intellectually and financially preferable to a long and complicated one that produces that same result.
2.5 ANALYSIS AND INTERPRETATION
When the outcome predicted by a hypothesis does not occur, one should question that hypothesis. If the outcome is accepted as correct, the hypothesis must be rejected.
When the predicted outcome does occur, the hypothesis is not necessarily true. Another hypothesis may also predict and explain the same observation. Suppose Reverend Ego hypothesizes "I am the Chosen of God" and infers "It will snow tonight because I want to go skiing tomorrow." Snow that night does not prove his divine favor when it has another explanation.
Successful prediction of observations or events, while not proving a hypothesis, supports it. The strength of the test depends upon how unusual the observation is. Snow on a winter night is a weak prediction, though stronger than predicting that the sun will rise in the morning. Snow on a summer day is a much stronger prediction.
Sometimes two people doing the same experiment get different results. Experimental results are not always as clear as we would like. The sample sizes often used for experiments allow substantial random variations.
2.5.1 Statistical Hypothesis Testing
Hypothesis testing has a specific sense in statistics. The focus is on rejection of null hypotheses. A null hypothesis is a hypothesis that some groups are the same with respect to some characteristic, or that several treatments are the same with respect to some outcome, or that certain variables have no inherent relationship. In other words, a null hypothesis is a hypothesis of zero difference or zero correlation. This definition encompasses the proposition that a treatment has no effect, since there is an implicit comparison with the alternative "treatment" of doing nothing. Doing nothing is a type of control treatment as discussed more thoroughly in later chapters.
Statistical hypothesis testing is a tool used in scientific hypothesis testing. Because of the difference of focus between numerical relationships and subject matter content, making the two mesh usually requires some thought. If we use neutral hypothesis as a synonym for null hypothesis, the relationship may be a little clearer. A neutral hypothesis that all treatments are equally good is similar to saying that all theories or hypotheses are equally valid. The common theme is to not prejudge and to keep an open mind until one has clear evidence, and to keep open to further evidence and development of a new and even better theory or treatment.
When one of the hypotheses regarding the outcome of an experiment is itself a neutral hypothesis, the situation is a little more complicated. The usual procedure is to stick with the null hypothesis unless and until there is reason to reject it and consider an alternative. This follows the principle enunciated in the early fourteenth century by William of Occam (or Ockham) and known as Occam's Razor -- do not multiply entities beyond necessity. In other words, do not declare the existence of phenomena and causes unless there is a good reason. Yet another wording of this principle is to stick with the simplest hypothesis that accounts for the most facts.
Our law courts follow a similar procedure with the presumption that a defendant is innocent until proven guilty ("one of the most important null hypotheses in Western Civilization" as Jim Druzik remarked). There are millions of possible suspects for any crime, and investigators sometimes select the wrong person. Prosecutors are therefore required to publicly present both the evidence and reasoning supporting a hypothesis of guilt. The jury must be convinced beyond a reasonable doubt before rejecting the null hypothesis of no connection with the crime. Only then is (punitive) action taken.
In medicine, there are millions of possible causes for every disease, and millions of possible treatments. Usually only one or a few are of major importance. The goal of medical research is to find these few that are worth acting on.
an interaction, or through some lengthier chain of interactions. But this is not the issue in either courts of law or scientific judgment. Is the correlation, effect, or connection strong enough to be worth paying attention to? The practical null hypothesis for any question is that it is not.
2.6 EXAMPLES
2.6.1 Technological Example
Observation Some adhesives used to conserve paper type P subsequently discolor. Question Which of three specific adhesives will discolor least when used on paper P?
Hypotheses
Method
Rationale
Variables
(0) There is no difference in degree of discoloration that appears over time with the three adhesives on paper P.
(A) Adhesive A applied to paper P discolors less over time than do adhesives B and C.
(B) Adhesive B applied to paper P discolors less over time than do adhesives A and C.
(C) Adhesive C applied to paper P discolors less over time than do adhesives A and B.
Hypothesis A refines to ABC and ACB, where hypothesis ABC is that adhesive A discolors less than B which discolors less than C. Hypotheses B and C have similar refinements.
Measure the color of the adhesives applied to paper substrate P before and after thermal artificial aging and calculate the color difference.
There are problems interpreting artificial aging data. The correlation of the effect of short-term severe environments with the effect of long-term natural aging conditions needs more assessment. However, the conservation literature accepts the theoretical use of thermal aging tests to rank the performance of materials.
In addition to color change one might include peel strength, reversibility, and change in pH.
2.6.2 Scientific Example
Observation Some adhesives used in the conservation of paper type P discolor noticeably more than do other adhesives.
Question What factors determine how much an adhesive will discolor on paper type P?
Implication
Color measurements of some adhesives subjected to varying humidity will show greater discoloration after exposure to high humidity.
Excess moisture allows hydration reactions to occur.
(2) Adhesives containing the impurity phenol formaldehyde will discolor over time.
Color measurements made before and after thermal artificial aging on adhesives with and without the impurity will show greater discoloration on the ones with the impurity.
Phenol formaldehyde is a highly reactive impurity that can be introduced into an adhesive during synthesis or processing.
2.6.3 Observational Example
Observation Medieval-period copper-based statues from Kashmir are often difficult to distinguish stylistically from those produced in West Tibet (Reedy 1986; Reedy and Meyers 1987; Reedy 1988; Reedy 199 1).
Question Can we distinguish statues from the two regions on technical grounds? Hypothesis (la) Statues from the two regions are distinguishable from each other in
casting and decorating technology.
Rationale The casting and decorating technology employed in statue production involves many steps, with alternative choices available at each. Statues originating from a set of workshops located within one specific region might vary in casting and decorating methods from statues originating in another regional set of workshops.
Historical texts say that medieval Himalayan craftsman were often mobile, and artists from Kashmir went to West Tibet to produce statues for monasteries there. They might have used the same techniques in both places, resulting in overlapping technologies between the two regions.
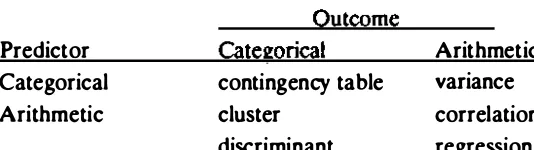
Identify and record surface and internal casting and decorating features visible by eye, binocular microscope, and X ray. Use stepwise discriminant analysis to show how well these data distinguish between the two regions.
(2a) Statues from the two regions are distinguishable from each other in elemental composition of the metals.
Hypothesis
practices exist from one region to another. Trace element differences may result from the exploitation of different copper ore sources by different regions.
(2b) There are no significant differences between the two regions in metal composition.
There may be no significant alloying differences between regions since there
are limited variations in copper-based alloys. Metal was probably imported into West Tibet since it had limited ore resources, and also might have been imported into Kashmir at times. If the imports into the two regions came from the same source(s), we would find no significant trace element differences in metals.
Sample 25 mg of metal from each statue and analyze by inductively-coupled
plasma emission spectrometry (ICP-ES) to measure major, minor, and trace element concentrations. Use stepwise discriminant analysis as before.
(3) Statues from the two regions are distinguishable from each other in clay
core composition.
Since clay core materials are unlikely to have been imported from an outside region to the manufacturing workshop, this should be an ideal material for a regional characterization. Since Kashmir and West Tibet are separate geographic areas, the sandy clay used in core manufacture should show considerably more mineralogical and elemental variation between two regions than it does within a single region.
Sample core material when available and do petrographic analysis to identify the mineralogical variables and instrumental neutron activation analysis to quantify the trace elements. Use stepwise discriminant analysis as before.
(4) Combining all datasets will result in an increased ability to distinguish between the two regions.
The more information we have about each regional group, the more likely we are to be able to characterize it and distinguish it from the other regional groups.
Perform stepwise discriminant analysis with various combinations of the datasets to see which gives the best results.
2.6.4 Summary Example
Observation The surface of a bronze grizzly bear statue in Yellowstone Park is deteriorating, resulting in severe discoloration.
Question What is causing the deterioration?
Hypotheses (1) Rain beating on the surface or components within rainwater such as acid.
(2) Excess sunlight exposure. (3) Fluctuating temperatures.
(4) Fire ash and smoke (from the 1988 forest fires). (5) Fluctuating humidity.
(6) Condensing moisture that sits on the surface of the statue and works its way inside through small cracks.
(7) Wind abrasion.
(8) Finger oil from tourists who touch the statue. (9) Exposure to animals and their urine and droppings. (10) Sulphur exposure from adjacent hot springs.
(1 1) Unstable metal composition and casting methods resulting in "inherent vice."
(12) Surface patina applied by the artist with an unusual component.
Devising multiple hypotheses may increase creativity and the ability to come up with many possible answers to a question. Some hypotheses may be eliminated without tests by using logic and library research. Implications are needed for the rest. Their tests can be as
CHAPTER 3
SINGLE-OBJECT STUDIES
3.1 ADVANTAGES AND USE
The scope of conservation projects and conservation research ranges from one object to thousands of objects and generic classes of objects. The same is true of the healing, training. and education disciplines that work with human beings. This chapter concentrates on studies of single objects. Such studies are perhaps most important to practicing conservators, who spend much time with a single objects and need to justify particular treatments without always having similar objects available for experimentation. Single-object studies also may aid researchers who are more interested in conservation science than in a particular object but who are studying actual works of art rather than surrogate samples of art materials.
Historically, applied disciplines began with a focus on individuals, with the primary method of research being the case study. This century has seen a shift of emphasis in research and experimental design toward group comparison methods. The latter is the primary content of most books on experimental design and analysis.
[n recent years, there has been a revival of interest in single-subject studies for gaining knowledge (Barlow and Hersen 1984). This does not mean a return to subjective case studies. [t instead means applying the principles used in group studies to derive statistically valid conclusions from single-subject studies. The key idea is that an experimenter
can sometimes make an object serve as its own control by treating it more than once in a
formal experimental design. It is therefore possible to make formal statistical statements comparing treatments applied to only one object. Such designs are alternatives to case-study trial-and-error. They should result in a more rapid accumulation of knowledge.
Strictly speaking. the results of a single object study are applicable only to that object. However, the conservator who must treat a particular object. just like the doctor who must treat a live patient, can use objective substantiated conclusions to plan a treatment for that object and to develop knowledge for future projects.
Single-object studies also may interest researchers who would otherwise prefer more general results. Material may be in short supply, especially for destructive experiments. Resources may be limited or uncertain. A complete study on one or two objects is better than an incomplete study on six that is prematurely terminated as resources run out. The treatment protocol for an experiment may be in flux and subject to change after the experience with each object. A series of completed single-object studies may lead to the desired generalizations.
Over-the-counter headache remedies are a typical example. A limited exception is the simultaneous application of skin treatments that have only local effects. Art objects can more
often receive different treatments at different places within one treatment session. Conservation researchers therefore have added flexibility for designing rapid studies.
A second advantage of art objects is that the effect of time is more stable and
predictable. Unlike human medical subjects, objects do not spontaneously heal themselves. We can more plausibly conclude that observed improvement results from treatment. Bronze
disease does not cure itself, whereas organisms are active entities and tumors sometimes disappear without a doctor's intervention. The art object might get worse, but it rarely cures itself.
Art conservation has the additional advantage of greater stability and dependability of treatment outcome. We use this in everyday conservation practice to make cause-and effect conclusions. However, people can be fooled. Coincidences do occur and are
constantly subject to misinterpretation. People remember dreams that come true much better than they recall those that do not. But it is harder to apply a treatment and not notice that there has been no effect.
In part, this chapter builds upon the everyday art conservation practice of testing
patches on an art object. It develops that practice into formal, statistically analyzable experiments. Once learned, the techniques often require relatively little extra time, perhaps an hour or so. This is not much compared with the total time involved in some treatments. We are not suggesting that every treatment on every object be subject to a rigorous test. Instead, we discuss when and how one justifies making routine conclusions that a treatment works, give suggestions on how to proceed when its value is not so clear, and show how to test an object's treatment statistically by applying it to test patches within test intervals.
3.2 MEASUREMENTS ON SINGLE OBJECI'S
3.2.1 One Measurement
A single measurement reveals the state of the object at the time of measurement. It may be useful for choosing a treatment but does not in itself constitute a study.
3.2.2 Simultaneous Measurement or Multiple Variables
3 . 2 . 4A Exampl e time trends of quality decay for an object
Q u A L I T Y
o po
o B J E C T
TIME
special multivariate statistical techniques to analyze multiple outcomes as a group. To avoid complications, we assume that only one outcome variable is of immediate interest even if there are others to be analyzed later in the same study.
3.2.3 Two Measurements or One Variable
The difference between two measurements estimates how much the object changed during the interval between the measurements. However, real measurements are always subject to variation. Concluding that there has been a change in the state of the object requires information about the size of measurement errors. We must assume that this information is applicable to the current measurements.
Treating or otherwise manipulating the object between the two measurements generates a minimal before-and-after study. Concluding that the action affected the outcome requires additional assumptions about the change expected if there were no intervention. The validity of the conclusion is no greater than the validity of the assumptions.
3.2.4 Repeated Measurements or One Variable
c o L o R
S A T U R A T I o N
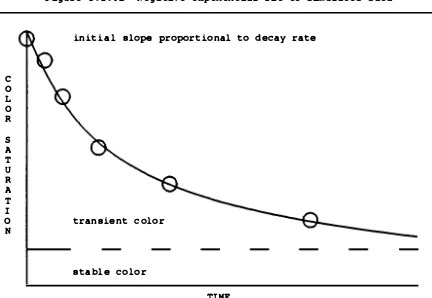
Figure 3 . 2.4B Nega tive exponential fi t to simulated da ta
init ial s lope proportional to decay rate
transient color
stable color
TIME
information about the shape of the decay curve. Does the tensile strength of a fiber decay in a straight line to zero, exponentially decline to 50% of its original value, or something else? Figure 3.2.4A shows some graphical examples.
Three or more sequential measurements under constant conditions give additional kinetic information. Least-squares regression and other curve-fitting techniques fit straight lines and curves to such data. These summarize and condense the data and estimate characteristics of the object in that particular condition that we cannot measure directly. If the number of measurements is greater than the number of parameters estimated, then we can judge the statistical significance of the slope or change parameter. With enough measurements we can estimate both the time effect and the measurement error without making assumptions about the relevance of previous information.
An example of a time series is a sequence of color measurements at predefined times or after predefined exposures to a hypothesized fading agent. In the units usually used to measure color intensity. the relationship between exposure and remaining intensity is often approximately a declining (negative) exponential. We can then summarize several repeated measurements by a single decay constant, which we could call "fading rate." Figure 3.2.4B shows a declining exponential fit to hypothetical color saturation measurements. The fit estimates the long-term residual color, the portion that disappears, and the rate. Expressed as numbers, these three aspects of the system are called parameters.
surface, also have application in conservation studies. The difference between measurements on the edge and interior of a two-dimensional surface estimates edge effects and may give an initial indication of the presence of decay.
3.2.5 Treatment Effects
Statistical tests of treatment effects compare observed differences or changes to the amount of difference one would expect to see from random experimental error. The expected size of the random variation must be known from prior data or estimated from the current data. The key to experimental design for one object is that there are several times or places at which one might apply the treatment. Random assignment of treatments to times or places gives an internal experimental basis for the calculation of the differences expected from random error. One can then do a formal statistical test and evaluate the outcome even
though only a single object is involved.
3.3 DESIGN 1: ONE TREATMENT INTERVAL
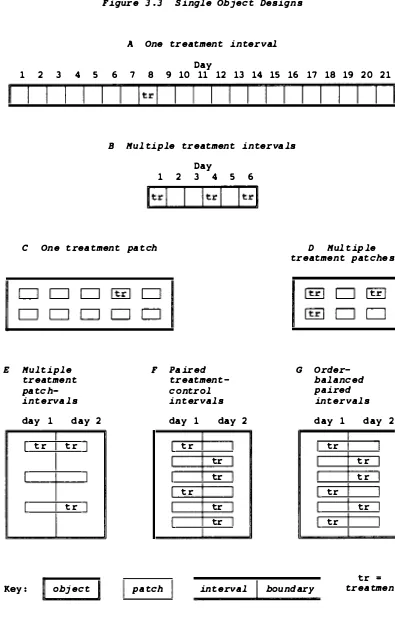
The following three sections describe seven different single object designs. Figure 3.3 gives a schematic example of each. The text and the figures are meant to work together to reinforce understanding of these designs.
3.3.1 Random Selection from Multiple Intervals
Subsection 3.2.3 introduced the minimal before-and-after study. Such a measure-treat-measure design does not tell us that an observed change results from the treatment unless we have external information that the difference is much larger than both normal measurement variation and the changes induced by other conditions of the experiment. Consider this design to be a selection of one treatment interval from one possibility. Design 1 extends this minimal design to a random selection of one treatment interval from several possibilities. Adding the element of choice allows a statistically valid conclusion for one object without using previous data or making assumptions.
Figure 3 . 3 Single Object Designs
A One treatmen t interval
Day
1 2 3 4 5 6 7 8 9 10 11 12 13 14 15 16 17 18 19 20 2 1
B Mul tiple treatment
Day 1 2 3 4 5
C One trea tment patch
intervals
6
D Mul tiple treatmen t patches
E Mul tiple F
trea tment pa tch-intervals
day 1 day 2
tr tr
tr
Key : object pa tch
Paired treatmen t-control intervals
day 1 day 2
tr tr
tr
tr tr
tr
in terval
G Order-balanced paired intervals
day 1 day 2
tr tr
tr
tr tr
tr
boundary
tr
C cleans one sculpture and puts it in an empty gallery, along with some other work projects. At 9 a.m. for 21 successive working days, M enters the gallery, looks at the sculpture from a distance of three feet under normal gallery lighting, makes notes, and leaves. C enters the gallery and goes to work with no one else present. On one of the first 20 days, C applies the quick-sealing agent to the sculpture (a small piece). Thus, M observes the piece at least once before the treatment and at least once after. C selects or has a third party select the one treatment day from the 20 possibilities by a random process that makes each equally likely. (See 4.4.2 for a discussion of how to do randomization.)
C does not tell M when the object is going to be treated, or afterward that it has been treated. The visual measurements are, in this sense, done blindly, without the influence of knowledge of when the treatment has been applied. On the morning of the 21st day, after the final observation, M consults memory and notes and selects the one interval, out of the 20 observed, during which a change was most noticeable. The identity of the treatment done each day (something or nothing) is kept from M until after M's selection of the apparent treatment day.
At the end of the experiment, M and C give analyst A their respective data. In the simplest version of design I, the data are only the apparent and actual treatment days and
the number of possible treatment days. A can be a third person or either of C or M. The null hypothesis for this experiment is that the treatment does not affect any characteristic observed by M. If this is true, then M's selection is just a guess. Saying that the treatment does not affect M's observations means that M makes the same sequence of observations and the same selection regardless of when the treatment is done, or if it is done at all.
Because of the treatment randomization procedure, there is, with 20 possible treatment days, a 1120 or 5% chance of a match between the day selected for treatment and the day selected by M. If C just "picks a number" between 1 and 20, without a proper randomization procedure, the match probability would almost certainly be an unknown value different from .05. It is very difficult to mentally pick numbers with equal probability even when one intends to. In this example, the match probability would depend upon the psychology of both C and M, including their second-guessing of each other. Random selection of the treatment day eliminates all such difficulties and considerations.
Selection of the correct day by M has a 1 in 20 chance by accident. This is sufficiently low that M and C might reject the hypothesis of accident and accept the alternate hypothesis of visible difference. However, the choice whether to make such a judgment at this level of chance is beyond the realm of statistics.
3.3.2 Test Statistics
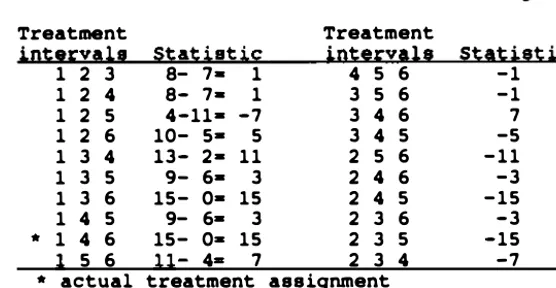
A, A can do the rank analysis described next. A might also re-sort the data to produce the other form of data table for additional insight into the experiment and its results.
Tabl e 3 . 3 . 2 Example rank data for design 1 population, or measurement process is a statistic. A test statistic, in particular, is a number that summarizes data for the purpose of deciding between competing hypotheses. If M only indicates a top choice, the test statistic is 0 or 1 for a miss or a match. Given a complete ranking, a better test statistic is the rank of the actual treatment day. For the hypothetical data table given in table 3.3.2, the summary test statistic is 3 for 3rd choice.
To interpret the test statistic, A calculates the probability of getting particular values when the null hypothesis is true. For miss or match, the probabilities were .95 and .05. For any particular rank, the probability is .05. A next sums the probabilities for the potential values that are as extreme or more so than the actual test statistic. This gives a cumulative probability known as a "p value." Extreme is defined as being in the direction predicted by the alternate hypothesis. For the ranks, M's hypothesis of easily visible treatment effect predicts a value of 1. For an actual value of 3, the potential values of 1, 2, and 3 are as much in the direction of 1 as 3 is. A reports a p value of . 15 for this experiment. There is a 15% chance that the actual day randomly chosen by C will be among the top three picked by M. [n general, the p value for this particular experiment and outcome measure is k times .05, where k is the rank of the actual treatment day.
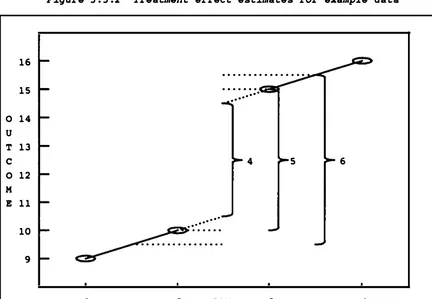
Figure 3.3.2 Treatment effect estimates for example da ta
16
1 5 . . . ... .
. -.. -..
-0 14 U T 1 3
C 4 5 6
0 12 M E 1 1
.. . .. . 10
9
1 2 DAY 3 4
A can try to improve the estimate of treatment effect by using the complete set of
measurements rather than just the ones immediately before and after the treatment. If the
measurements are noisy but otherwise stable, A can subtract the average of the
measurements before the treatment from the average of the measurements after the treatment. If there is a consistent trend in the measurements before and after treatment, a more sophisticated adjustment for slope might be used.
To be concrete, limit the experiment to 4 days instead of 2 1 . Suppose that M
measures values of 9, 10, 15, and 16 on days 1, 2, 3, and 4, respectively. Suppose further that
C treats the object on day 2 after the measurement of 10 and before the measurement of 15.
Then the simple estimate of treatment effect is 15 - 10 = 5. The mean-adjusted estimate is
( 15 + 1 6)/2 - (9+ 10)/2 = 6, and a slope-adjusted estimate is 5 - ( 1 + 1 )/2 = 4. Each of the
three estimates of treatment effect is a possible test statistic. These are illustrated in figure 3.3.2.
The null hypothesis for this experiment is that the treatment has no effect. For the 2 1 -day version, this means that the difference for the 1 treatment interval should be about the same as the differences for the 19 non-treatment intervals. The presence of 21
measurements instead of just 2 (20 differences instead of just 1) enables A to do a statistical
Using the simple difference as a test statistic, A does a randomization test by calculating the 20 differences that correspond to the 20 possible treatment day choices. This produces a derived data table similar to the second set of columns in table 3.3.2, with the
differences replacing the rank choices. A then sorts this table from largest difference to
smallest difference to produce a second derived data table similar to the first set of columns
in table 3.3.2. A then counts down from the top to get the rank of the actual treatment
effect in the set of possible treatment effects. This determines the p value as before. If the
observed treatment difference is the largest of the 20 possible, A declares it significant at the
.05 level. Subsection 3.3.3 more thoroughly describes the nature and logic of randomization tests.
Design 1 constitutes a legitimate experiment and statistical analysis without using any
other object as a control for comparison. The before-and-after measurement pairs for the
intervals without the treatment show what happens when C leaves the object alone. The
measurement intervals can be any length as appropriate for the particular treatment without
changing the logic of the design or analysis. They also can be unequal, to accommodate work
schedules, although there could be complications if there is substantial drift in either the object characteristic or measurement apparatus.
This first design is simple but illustrates some key points of experimental design for single objects. However, intervals of a week or more, as might be needed to apply the treatment or to allow for drying time, would make the procedure a bit tedious. The number of intervals needed can be decreased by accepting a greater uncertainty in the outcome than 5%. This reduces the amount of information that needs to be collected, as discussed in the
next subsection. An alternative is using one of the other designs discussed in 3.4 and 3.5.
3.3.3 Treatment Randomization Tests
The logic of the test described for design 1 is the following: We hypothesize that the treatment has no effect on the object. We give it an equal probability of being applied during any of 20 days. If both are true, then the measured difference for the treatment day has an equal l-in-20 (or 5%) chance of being in any of the 20 possible positions (excluding ties) in the sorted set of 20 differences for the 20 possible treatment days. For example, it has a 5% chance of being 8th largest purely by random happenstance. The same applies to being the largest or smallest.
If the observed difference is the largest, we may choose to reject the null hypothesis of no treatment effect because the data make it seem unlikely. We say that the p value or significance level is less than or equal to .05, or that we are rejecting the null hypothesis at
the 5% level. A p value is the probability of observing a result at least as extreme as the
actual result if the null hypothesis is true. Learning these catch phrases helps one read or write about statistical tests of experimental results.
population. Rather, C randomly samples one treatment time from the 20 possible treatment times.
The test does not depend on the nature or distribution of the measurements as long as there is a summary statistic that we can rank within the reference set of possible outcomes. One can be rigorous even with subjective scores. They may be less precise than instrumental measurements, but this is a only a reason to be more careful with the design and analysis. A's numerical calculations based on instrumental measurements are an objective, public alternative to M's private subjective rankings of the likelihood of each possible treatment protocol. But the logic of the test is the same.
It is crucial that the ranking of the possible treatment intervals be based only on M's observations without knowledge of C's actual random choice. This is obvious if M makes the rankings directly but just as true if A calculates and sorts a set of test statistics. A may choose a test statistic from many possibilities after looking at the data but not after knowing the actual treatment. Under the null hypothesis, the data contain no information about the actual treatment, so there is no harm in looking, and there may be some benefit in making the test statistic more sensitive to situations where the alternative hypothesis is true. If A chooses a test statistic after knowing the correct answer, then it is possible to do so to manipulate and therefore invalidate the apparent p value and the judgement of the null hypothesis.
With n possible treatment intervals, there is a 1/n probability that the actual randomly selected treatment interval will have the largest value of the test statistic purely by accident. The p value resulting from the experiment will be 1/n times the rank of the actual test statistic among the n possible. If we reduce design 1 to 10 or 5 possible treatment intervals, then we can calculate the p value only to the nearest 10 or 20%. With 100 intervals, the minimum p value would be .01 and the treatment statistic would only have to be in the largest 5 of the 100 possible to be significant at the .05 level.
Section 5.3 has more material on hypothesis testing. Some warnings on p values are given in 5.3.5.
3.3.4 One-Sided and Two-Sided Tests
In 3.3.2, the calculated test statistics are the differences between successive measurements. The p value is lowest when the actual treatment difference is the largest, with negative numbers being less than positive numbers. This corresponds to an alternative hypothesis that claims that the treatment will increase the measured attribute of the object. If the treatment is expected to decrease the measurement, the test is reversed by reversing the signs of the differences. In either case, the test is called a one-sided test, since it is