Evaluation of Teacher-Student Learning Style Disparity in
Construction Management Education
Tariq S. Abdelhamid, Ph.D.
Michigan State University East Lansing, MI
This paper presents results of a research study designed to evaluate the teacher-learning style disparity at Michigan State University’s Construction Management Program. The Felder-Solomon Index of Learning Styles (ILS) questionnaire was administered to 5 instructors and 277 students (81 freshman, 71 sophomores, 56 juniors, 63 seniors, and 6 graduate students). The study also investigated the relation between a student’s preferred learning style and associated preferred mode of instruction. The results of the study reveal that students preferred the active, sensing, visual, and sequential learning styles. The results also showed that the average disparity in teacher-student learning styles was not significant. Both instructors and teacher-students had strong preference to the visual learning style. Empirical evidence is presented suggesting that, irrespective of the preferred learning style, students predominantly preferred active learning as the primary mode of teaching. It was also found that compared to the magnitude of learning style disparity, the primary teaching mode adopted by the instructor had more effect on motivating and helping students learn. This suggests that instructors should solicit input from students on their preferred mode of teaching and work together to achieve it using active learning paradigms.
Key Words: Learning Styles, Construction Education, Active Learning, Instructional Design
Introduction
According to Bloom’s cognitive and affective taxonomies, learning begins with the reception of information (Anderson et al. 2000). The instructor’s ability to provide a learning environment that will engage the students’ interest is crucial to this process. In addition, a student’s interest, readiness, and willingness to engage in the learning process are equally critical. Another key factor is the learning style itself of students. Sarasin (1998, pg. 3) defines a learning style as “the preference or predisposition of an individual to perceive and process information in a particular way or combination of ways". A student’s predisposition to a preferred and unique learning style is an undisputed fact about how students (at any level) learn (Price 1983, Felder 1988 and Garsha 1996). This predisposition also explains learning style variation among students.
In some respect, the variation in learning style is desirable because it fuels different types of innovation and elicits a wide array of talents. However, from an educational perspective, favoring a learning mode over another potentially results in a mismatch between the learning styles of student and teacher. This mismatch or disparity is frustrating to the student whose learning style is not compatible with that of the teacher. Teaching under such circumstances, and they are almost guaranteed to occur, calls on a teacher to “cater” to all learning modes (Felder and Silverman 1988). This is termed in the literature as teaching “around the cycle” (Kolb 1984).
could be gleaned from the literature on addressing learning styles disparity is that calling on teachers to identify the learning styles among students and then design instruction to help students reach a balance in their preferred and less preferred modes of learning (Price 1983, Felder 1993, Grasha 1996, and Lyons et al. 1999).
Numerous descriptive models have been developed over the years to categorize learning styles and to help teachers identify their students’ preferential style of learning (McKeachie 1980, Felder 1988, Schmeck 1988, and Tobias 1990). These models originated from different perspectives on what factors affected the learning process. For example, the famous Myers-Briggs Type Indicator considers the effect of personality and character traits on the preferred way of receiving and integrating information. The Herrmann Brain Dominance Instrument (Felder 1996) and the Kolb model (Kolb 1984) consider the cognitive processes preferred by students in acquiring and understanding information. The Reichmann’s and Grasha’s (see Grasha 1996) typify learners based on how a student’s social interactions with peer groups – learners are independent, dependent, collaborative, competitive, participant, and avoidant. Felder (1996) gives examples of how educators have used these learning style models to successfully teach “around the circle”.
The learning style models mentioned have been the basis for developing psychometric tools for evaluating the learning style of students and instructors. These tools are typically developed in the form of surveys that elicit the preferred learning style of the respondent through a series of hypothetical questions. The development of these learning style tools has lead to a plethora of research wherein the tools were used as they were intended – to assess learning styles and design instruction accordingly – or the tools were themselves subjected to validation – to establish reliability (consistent and repeatable results) and construct validity (the tool actually measures what it was intended to measure).
As reported in the literature, efforts to understand students’ preferential style of learning and to design course instruction to “cater” to all learning modes have resulted in the following (Felder 1996):
• Helping students understand their preferred learning style and to formulate successful learning strategies.
• Improving performance of students with heavy reliance on one mode of learning.
• Providing a framework for instructors to redesign their course to such that they “teach around the cycle”.
• Increasing collegial discussions about teaching and interest in enhancing teaching.
The next section briefly describes the Felder-Silverman Learning Style Model and the Index of Learning Styles (ILS). This is followed by a discussion of the research design and results. The paper concludes with a synthesis of the results and inferences drawn to help guide instructors in redesigning delivery of their subject matter. Areas of future research are also discussed.
Felder-Silverman Learning Style Model
Intended for engineering and science majors, Felder and Silverman (1988) developed a learning style model based on how information is received and processed by a learner. According to Felder and Silverman, and others (McKeachie 1980, Lawrence 1990, and Lyons et al. 1999), optimum learning occurs when the reception of information is congruent with how it will be processed. And not surprisingly, each person will have a favored, and perhaps unique, processing routine or algorithm. For example, some people prefer written directions to a location while others opt for a map. The end result is the same; the final destination will be reached. However, if the communication given or received is mismatched with the favored processing routine, a person will be late to reach the final destination, if reached at all. The metaphor has significant relevance to what may happen to learning when students receive information in a manner or through a modality incongruent with their preferred processing routine.
Using Jung’s theory of psychological types (Lawrence 1984), and parts of Kolb’s model (Kolb 1984), Felder and Silverman (1988) suggested that a student’s learning style is defined and influenced by the following five phases:
1. Information Perception: “What type of information does the student preferentially perceive: sensory (external)—sights, sounds, physical sensations, or intuitive (internal)— possibilities, insights, hunches?” (pg 675)
2. Input Modality: “Through which sensory channel is external information most effectively perceived: visual—pictures, diagrams, graphs, demonstrations, or auditory — words, sounds?” (pg 675)
3. Information Organization: “With which organization of information is the student most comfortable: inductive—factsand observations are given, underlying principles are inferred, or deductive—principles are given, consequences and applications are deduced?” (pg 675)
4. Information Processing: “How does the student prefer to process information: actively—
through engagement in physical activity or discussion, or reflectively— through introspection?” (pg 675)
5. Understanding: “How does the student progress toward understanding: sequentially—in continual steps, or globally—in large jumps, holistically?” (pg 675)
The use of the 5 questions to encompass a student’s learning experience may imply that the Felder and Silverman learning style model classifies learners into one of two possible categories on each of the five dimensions, i.e., the sensing/intuitive, visual/verbal, inductive/deductive, active/reflective, and sequential/global dimensions. This would of course be an
humans for that matter. Recognizing this, Felder (1993) aptly cautions against this by stating that: “The dichotomous learning style dimensions of this model (sensing/intuitive, visual/verbal, inductive/deductive, active/reflective, and sequential/global) are continua and not either/or categories. A student's preference on a given scale (e.g. for inductive or deductive presentation) may be strong, moderate, or almost nonexistent, may change with time, and may vary from one subject or learning environment to another (pg 287).”
Felder and Silverman (1988) also proposed a parallel teaching style model intended to map the instructional methods used by teachers to the corresponding learning style phases. The teaching style model is represented in the following five questions as provided in Felder and Silverman (1988, pg 675):
1. “What type of information is emphasized by the instructor: concrete— factual, or abstract—conceptual, theoretical?
2. What mode of presentation is stressed: visual—pictures, diagrams, films, demonstrations, or verbal— lectures, readings, and discussions?
3. How is the presentation organized: inductively—phenomena leading to principles, or deductively— principles leading to phenomena?
4. What mode of student participation is facilitated by the presentation: active—students talk, move, reflect, or passive—students watch and listen?
5. What type of perspective is provided on the information presented: sequential—step-by-step progression (the trees), or global—context and relevance (the forest)?”
With this teaching model, Felder and Silverman are suggesting that a student favoring the sequential learning style would respond well to an instructor who presents information in a step-by-step fashion. It also follows that a student favoring the global learning style would respond well to an instructor who presents information in a holistic (big-picture) fashion. Similarly, a student favoring the sensing learning style would respond well to an instructor who presents facts and data while a student favoring the intuitive learning style would respond well to an instructor who presents concepts and principles. The same can be inferred for the visual/verbal dimension but not the active/reflective dimension. According to Felder and Silverman (1988), both active and reflective students respond well to an active mode of instruction and not to a passive one. They state that: “Active [student participation] signifies that students do something in class beyond simply listening and watching, e.g., discussing, questioning, arguing, brainstorming, or reflecting. Active student participation thus encompasses the learning processes of active experimentation and reflective observation.”
To facilitate the practical utilization of the Felder and Silverman learning style model, Felder and Solomon (2001) developed a psychometric evaluation tool known as the Index of Learning Styles (ILS). The ILS is a survey-based self-scoring instrument that assesses preferences on four out of the five learning style model dimensions, namely, the Sensing/Intuitive, Visual/Verbal, Active/Reflective, and Sequential/Global dimensions. The ILS is available as both a web-based and pencil-and-paper version (http://www.ncsu.edu/felder-public/ILSpage.html).
Examples of the ILS survey questions and the dimension they measure are as follows (Felder and Solomon 2001):
• I understand something better after I: (a) try it out; (b) think it through.
This and other similar questions (a total of 11) measure the preference of the respondent on the Active/Reflective dimension of learning. Active learners learn best by doing something with information, explaining it to others while working in groups. Their attitude towards learning is “Let's try it out and see how it works”. Reflective learners prefer to work alone and think quietly about presented information. Approaching learning with a “Let's think it through first” mindset is typical for reflective learners.
• I find it easier to: (a) learn facts; (b)learn concepts.
This and 10 other similar questions measure the preference of the respondent on the
Sensing/Intuitive dimension of learning. Sensing learners find it easier to learn and retain facts. They prefer structured methodical solutions, which appeals to their detail-oriented nature. They are also better at working with their hands (manipulating instruments and running experiments) and appreciate courses with a real-world connection. Intuitive learners prefer to discover
underlying principles and to think of what could be. They are better at grasping new and abstract concepts, and are comfortable with mathematical formulations. Intuitive learners dislike
repetition and loath ‘plug-and-chug’ problems.
• When I think about what I did yesterday, I am most likely to get: (a) a picture; (b) words.
This line of questions (11 in total) captures the preference of the respondent on the Visual/Verbal dimension of learning. Visual learners recall and retain better what they see (e.g., pictures, charts, graphs, demonstrations, etc). Verbal learners recall and retain best what they read and hear, i.e., written and spoken explanations. Felder and Solomon (2001) state that: “Everyone learns more when information is presented both visually and verbally.”
• Once I understand: (a) all the parts, I understand the whole thing; (b) the whole thing, I see how the parts fit.
steps and can articulate their approach quite well. Conversely, global learners are big-picture driven when tackling complex problems but find it difficult to clearly explain their solutions. This difference does not mean that global learners get the proverbial ‘light bulb’ turned on before the sequential learners. The real distinction between the two is the antecedent thinking process that leads to the ‘light bulb’ going on.
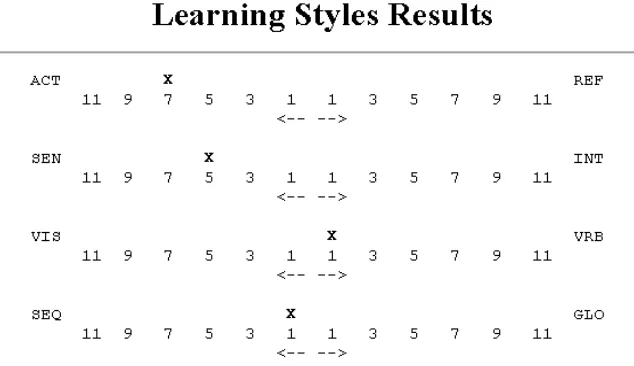
Results of the 44 question ILS survey are provided in four scores that correspond to each of the four dimensions being measured. A sample score is shown in Figure 1. The respondent in this case has a moderate preference for the active and sensing learning styles and is balanced on the other two dimensions, namely, the visual/verbal and sequential/global.
The ILS survey has been widely embraced by national and international engineering professors (Felder 1996, Rosati 1999, Smith et al. 2002). The survey has been translated into many foreign languages and in 2002 the website received 100,000 hits (Zywno 2003). A number of validation studies have been conducted on the ILS reliability and construct validity (Van Zwanenberg et al 2000, Livesay et al 2002, and Zywno 2003). A review of these studies is not in the scope of this paper. These studies generally conclude that the ILS is an acceptable and suitable psychometric assessment tool for learning styles of students in engineering and the sciences (Zywno 2003).
Figure 1: Sample results using the web-based ILS survey
Methods
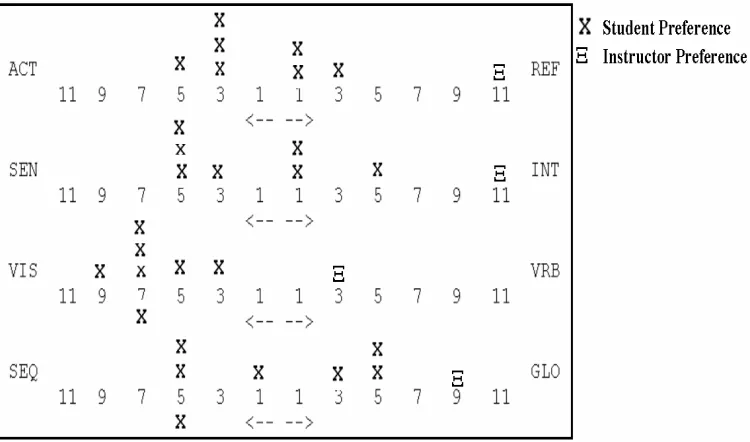
are aggregated as shown in Figure 2. The students shown in Figure 2 are clearly predominantly visual and sensing and equally sequential and global as well as equally active and reflective. It is also apparent that a learning style disparity of an enormous magnitude exists between the
students and their instructor. The results were shown and explained to the students. It was
emphasized that being on either side of any one dimension of learning preference does not reflect a good or bad thing.
The survey tremendously helped the instructor understand how he and his students learned. The instrument did indeed capture the disparity between instructor and students. This was the
diagnostic benefit of the survey and the instructor agreed to adjust the teaching style to bring the students and the instructor closer to a balanced learning mode.
Figure 2: Index of Learning Styles Survey Results – Pilot
Based on the Felder and Silverman learning and teaching style model, the instructor was advised that the subject matter should be presented with more emphasis on visual aids and facts while striking a balance between the step-by-step and holistic presentation of these facts in an active
environment that allowed students to both interact with each other as well as have the time to reflect on what they have learned. In response, the instructor rightfully asserted that he was not clear on which active learning mode to use and expressed apprehension towards some
techniques.
their ability to be effective in the mode that truly reflects their personalities. Thus, some may be most effective at lecturing and others at facilitating group work, etc. Notwithstanding the instruction mode, the common captivating and mesmerizing factor among these effective instructors is their ability to elicit the participation of their students and in opening the space to the students instead of filling it themselves.
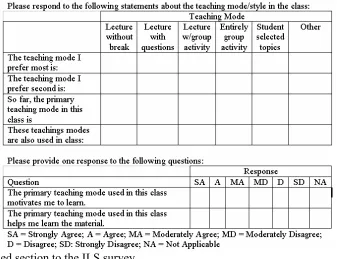
This discussion underscored the need to investigate, even if only empirically, the relation between a student’s preferred learning style and associated preferred mode of instruction. An addendum was therefore added to the ILS in which students were asked to indicate (self-declare) the primary and secondary teaching mode they preferred. The students were also asked to
classify the adopted primary and secondary teaching mode by the instructor. Finally, The students were asked whether the adopted primary mode of teaching motivated and helped them learn. Figure 3 shows these additions. The teaching modes shown in Figure 3 were adapted from Wankat (2001).
It is worth noting that a ‘1’ represents strong agreement that the primary teaching mode used in the class: (1) motivated the student to learn; (2) helped the students learn. A ‘6’ represents strong disagreement to the same statements. It is important to note that the emphasis is on learning motivation and assistance (help) and not on the efficacy of the learning, i.e., academic
performance. Students have, and typically assume, autonomy in determining what effort and, hence, final grade they would like. A student who receives a ‘C’ as a final grade may be as motivated to learn as a student who receives an ‘A’.
Figure 3: Added section to the ILS survey
studying. On the other hand, the phrase ‘helps me learn’ refers to whether the instruction mode used in class facilitates the process of learning, i.e., makes the subject matter more accessible and easier to understand. The difference is subtle and was thoroughly explained to the students in both the pilot and actual research phases.
After the study methods and details were finalized, 277 students in five different courses (81 freshman, 71 Sophomores, 56 Juniors, 63 seniors, and 6 graduate student) completed the modified ILS survey. The instructors teaching the five courses were also asked to complete the survey. Discussion of the results and inferences follow.
Results
The high number of participants (the 282 participants; 277 students and 5 instructors) renders a detailed presentation of the data collected and results encyclopedic. Thus, the presentation in the following sections is limited to general trends and aggregated results. It should also be noted that only 266 students have completed the addendum section shown in Figure 3. All 282 participants did complete the ILS in its entirety. Course titles are withheld to protect the identity of
instructors.
ILS Survey Results
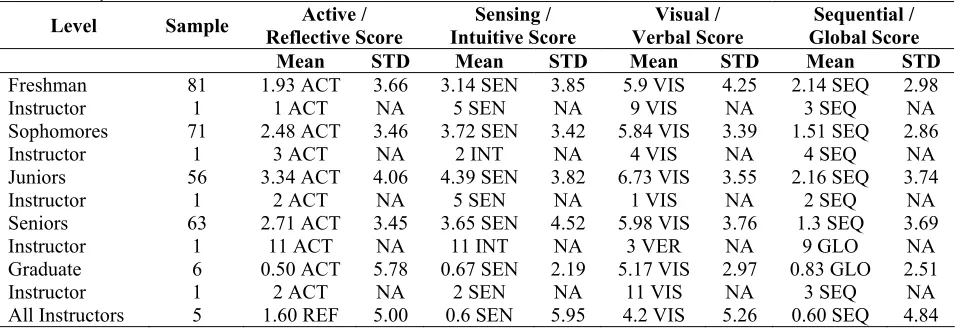
The ILS survey results are shown in Table 1. The mean and standard deviation (STD) for each of the four learning dimensions is provided for each grade level, individual instructors, and all instructors combined (see Appendix A for example calculation). For example, freshman students had a 1.93 mean score on the active reflective dimension. The “ACT” after the 1.93 indicates that the mean score fell on the active side of the dimension. For this same dimension and same grade level, the instructor scored 1 on the active side.
Table 1
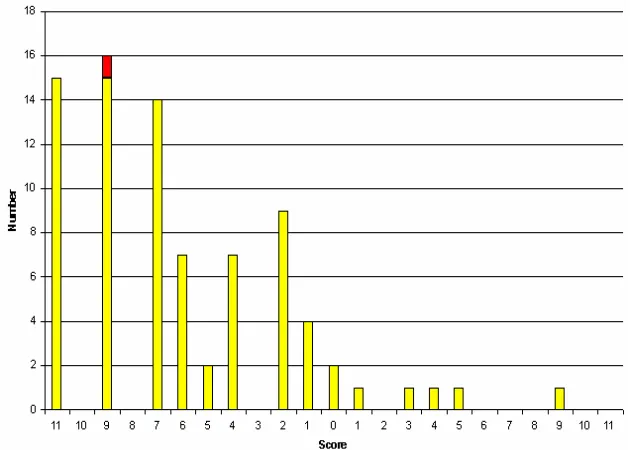
the variation in learning style preference for a particular class level and along any of the dimensions is quite high as evident by the high standard deviation values. To appreciate this variability, Figures 4 to 7 show histograms of the individual scores for the freshman and senior class on the active/reflective and visual/verbal dimension. The scores for the respective
instructors on the same dimensions are superimposed in Figures 4-7 (different bar color or an “I”).
Figure 4: Score distribution on the active/reflective dimension (Freshman)
Figure 5: Score distribution on the visual/verbal dimension (Freshman)
dimension was always skewed to the Visual dimension (see Figure 5 and 7). Because of the small sample of graduate students it was not possible to discern or infer a similar trend.
Figure 6: Score distribution on the active/reflective dimension (Seniors)
Figure 7: Score distribution on the visual/verbal dimension (Seniors)
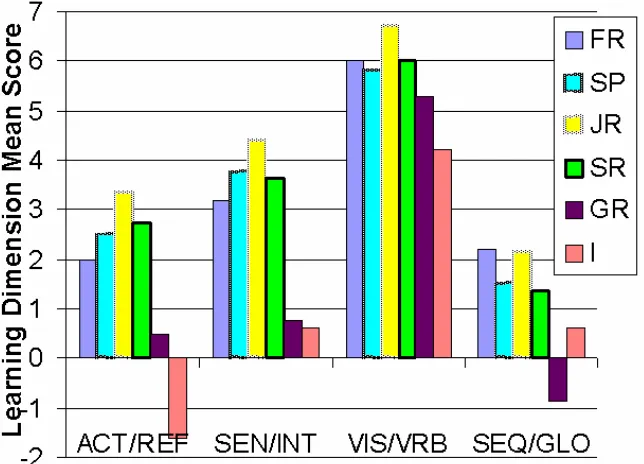
this may be due to the small sample size). The instructors are clearly closer to the students’ mean preferred learning style on the Visual/Verbal and Sequential/Global dimensions.
Figure 8: Learning Dimensions Mean Score By Group
Figure 8 also indicates an increasing trend in the Active/Reflective and Sensing/Intuitive
dimensions from the freshman to the junior year. This is most likely coincidental especially that this was not the same group of students tracked in a longitudinal fashion. Thus this trend is not necessarily a sign that the curriculum or instructors are causing this trend.
Preferred and Adopted Mode of Teaching
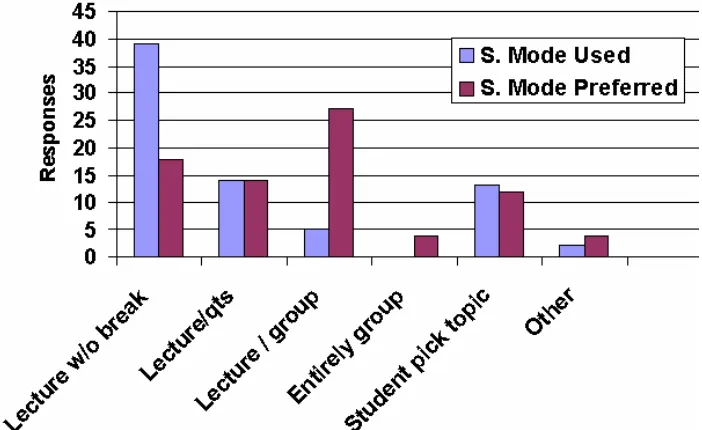
As explained earlier, students were asked to indicate their preferred primary and secondary teaching mode as well as classify the adopted primary and secondary teaching mode by the instructor. Figure 9 shows the responses of the freshman class to the question of preferred teaching mode and that adopted by the instructor.
Figure 9: Primary preferred teaching mode and the primary adopted mode (Freshman)
Similar to Figure 9, Figure 10 shows the secondary adopted and preferred teaching mode. It is evident from Figure 10 that, according to the student’s of course, the instructor uses lecture only as a secondary mode with only 17 out of 81 students preferring it. Figure 10 also shows that about 25 students prefer the lecture with group activity as a secondary mode but only 5 students classified this as a secondary adopted teaching mode.
Figure 10: Second preferred teaching mode and the second adopted mode (Freshman)
Adopted Teaching and Learning Motivation
To investigate the effect of using the same primary mode of teaching as that preferred by
students on the learning process, the students’ responses to whether they agreed that the adopted primary mode of teaching motivated and helped them learn were divided into the following four categories:
1. Students’ responses to the statement: “The primary teaching mode used in this class motivates me to learn” and the instructor’s adopted mode matched that preferred by the students.
2. Students’ responses to the statement: “The primary teaching mode used in this class motivates me to learn” and the instructor’s adopted mode did not match that preferred by the students.
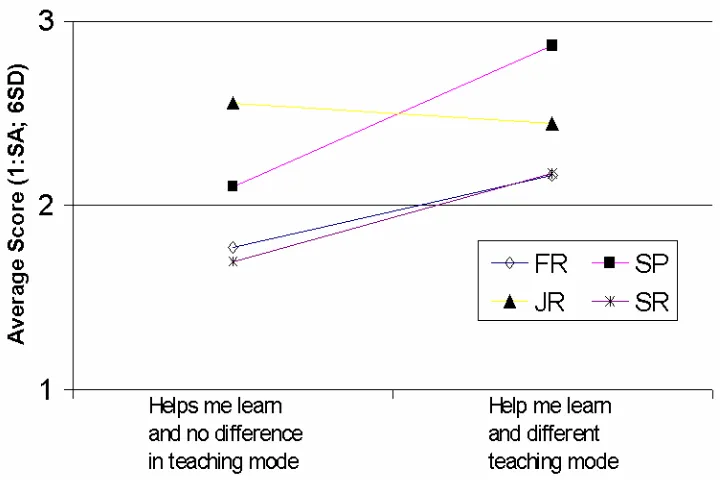
3. Students’ responses to the statement: “The primary teaching mode used in this class helps me learn” and the instructor’s adopted mode matched that preferred by the students. 4. Students’ responses to the statement: “The primary teaching mode used in this class helps
me learn” and the instructor’s adopted mode did not match that preferred by the students.
Table 2 lists students’ average responses resulting from this grouping as well as results of a two-sided t-test performed on the data. The null and alternative hypothesis were as follows: 1) Hο:
µ1 – µ2 = 0; 2) Ha: µ1 – µ2 ≠ 0. The results of the graduate students are not shown because the
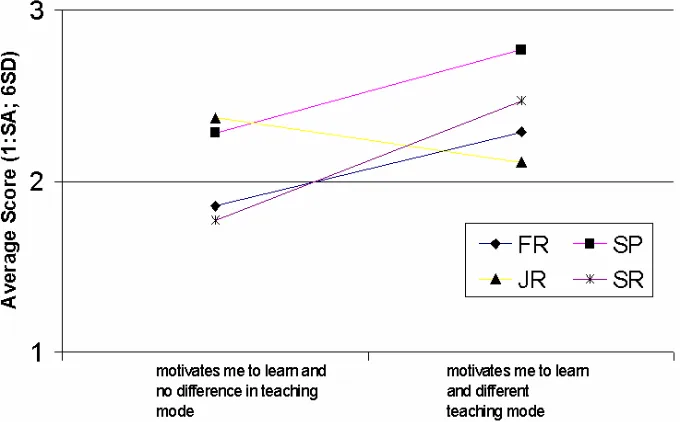
small sample size precluded meaningful statistical analysis. Figures 11 and 12 are a graphical representation of the data shown in Table 2. The x-axis of Figure 11 shows categories 1 and 2 (listed above) and that of Figure 12 shows categories 3 and 4. The y-axis of both Figures 11 and 12 shows the corresponding students’ average response.
With the exception of junior students, the t-test results shown in Table 2 (see p-values) confirms, with statistical significance, that students are motivated and helped to learn when the adopted teaching mode matches their preferred learning style. This is of course an expected result. However, this result does not seem to be affected by the learning-style disparity between instructors and students. Consider for example the senior class where the disparity was highest but the students gave similar responses, or trend at least, to those of the freshman and sophomore students where the disparity was small. Moreover, while the disparity in the junior class was less than that in the senior class, the junior students gave opposite responses compared to the senior class. Perhaps the reason lies with the students’ expectation from a particular mode of
instruction. In other words, the students may have a different expectation of how the teaching mode they prefer should be delivered.
An informal interview with 5 junior students revealed that the instructor was the main source of questions and not the students. While this is merely anecdotal evidence that supports the
Table 2
Average responses and t-test results for effect of primary teaching mode on learning
Statement Freshman Sophomores Juniors Seniors
Average
P-value* 0.017 (Significant) 0.04 (Significant) 0.35 (Not Significant) 0.06 (Significant)
The primary teaching mode used in this class helps me learn the material. (Adopted mode matched preferred)
µ1 = 1.77 µ1 = 2.10 µ1 = 2.56 µ1 = 1.69
The primary teaching mode used in this class helps me learn the material. (Adopted mode differed from
preferred)
µ2 = 2.16 µ2 = 2.87 µ2 = 2.44 µ2 = 2.18
P-value* 0.013 (Significant) 0.002 (Significant) 0.76 (Not Significant) 0.05 (Significant)
*(two-sided t-test with hypothesized zero mean difference)
Figure 12: Effect of adopted teaching mode in helping learning
Learning Styles and Preferred Mode of Teaching
As previously mentioned, a close association between preferred learning style and the preferred mode of instruction is assumed for the type of information presented as governed by the
visual/verbal, sensing/intuitive, and sequential/global dimensions (Felder and Silverman 1988). However, for the active/reflective dimension, Felder and Silverman (1988) state that active
participation is the best teaching style for both types of learners. With active participation probably affecting the entire classroom experience and, hence, the other three dimensions, it is not unfounded to surmise that active participation is superior to passive regardless of the preferential learning style.
To investigate this assumption, a student’s preferred learning style on each of the four dimensions measured by the index of learning styles survey were matched with the student’s self-declared preferred primary mode of instruction. For example, if a student’s ILS results indicated he/she preferred the active/sensing/visual/sequential styles of learning, this was matched to the preferential mode of teaching the student also indicated. The results of this analysis are listed in Table 3.
regardless of the preferential learning style. This is also another confirmation of the need to move towards the forms of learning advocated by proponents of active learning.
Table 3
Student Preferred learning and teaching mode
Teaching Mode*
* The figure in each cell represents the number of students selecting the corresponding teaching mode
Conclusions
This paper described the results of a research study designed to evaluate the teacher-learning style disparity at Michigan State University’s Construction Management Program. The Index of Learning Styles (ILS) model was used to determine the learning style preference of students and their teachers in the Construction Management Program at both the undergraduate and graduate levels (construction courses only). The study also investigated the relation between a student’s preferred learning style and associated preferred mode of instruction. Students were asked to indicate (self-declare) the primary and secondary teaching mode they preferred and to classify the adopted primary and secondary teaching mode by the instructor. The students were also asked whether the adopted primary mode of teaching motivated and helped them learn.
The results of the study reveal that, on average, students in the construction management program preferred the active, sensing, visual, and sequential learning styles. The results (see Table 1) also showed that the existence of disparity in teacher-student learning styles. Both instructors and students had a strong preference to the visual learning style. However, for both students and instructors, the variation in learning style preference along one dimension was quite high. The results also indicate that compared to the magnitude of learning style disparity the primary teaching mode adopted by the instructor had more effect on motivating and helping student learn. Therefore, instructors should solicit input from students on their preferred mode of teaching and work together to achieve it. While certainly only empirical, it was also found that irrespective of the preferred learning style, students preferred instruction with active participation as the primary mode of teaching.
understanding for content coverage. Consequently, a lecture mode is selected because it is less time consuming and deemed more efficient for large class sizes. Fortunately, the literature on active learning discusses remedies to both issues, limited time and large class sizes, at great detail (Johnson et al. 1991, Smith and Waller 1997, and Wankat 2001).
The results presented in this research are based on one of many learning styles evaluation tools. The results are also major-specific and to a large extent also instructor-specific. Replication of the study in similar majors or others should consider the following improvements that were naturally learned in retrospect:
• The teaching mode ‘Lecture with questions’ should be replaced with ‘Lecture with student-initiated questions’ and ‘Lecture with instructor-initiated questions’.
• The teaching mode ‘Lecture with individual activity’ should be added to the list of teaching modes.
• Investigate why students prefer one teaching mode to another, and how does it motivate or help them learn.
• Investigate the impact of matching students’ preferred learning styles and learning outcome (i.e., academic performance or learning efficacy).
• Investigate the impact of realizing one’s preferred learning style academic performance (formulation of successful learning strategies).
• Conduct a longitudinal study to investigate the change in preferred learning style over time.
It is critical to note that the Felder and Silverman model was only intended to provide a
framework to understand and gain insights to the learning style preferences of students and to the teaching style biases of instructors. This understanding helps both students and instructors to themselves improve the classroom learning experience and increase satisfaction with instruction. However, the Felder and Silverman model, as well as other learning style models, was not intended as a predictor of academic performance, which has a well-established correlation to ability (Ayersman 1996, Zywno and Waalen 2001). In other words, a change in the teaching style to accommodate the different learning styles of students does not guarantee that all students will necessarily score high grades. The change may engage and enthuse students more about the subject matter.
This research confirms that active learning is more desirable compared to passive learning as evident by the overwhelming number of students who preferred this style as the primary style of teaching. The research also provides a framework to tailor courses to the students’ preferred learning style and mode of instruction. Last but not least, the study definitely increased collegial discussions about enhancing teaching.
Acknowledgement
Bernuth, Director of the Construction Management program at MSU, for supporting the application to the Lilly Teaching Fellowship Program and for discussions that generated initial ideas for the research. The author also acknowledges with great gratitude the insights and directions that Dr. Steve Yelon provided in his capacity as a Lilly Fellow mentor. The author also benefited immensely from conversations with the 2002-2003 Lilly Teaching Fellows and Dr. Karl Smith and Dr. Cathy Bristow (Lilly Fellowship Program Leaders). The research would not have been possible without the participation and patience of the students and colleagues of the Construction Management Program. Thanks are also due to the three anonymous JCE reviewers for their generous assistance in improving the quality of this paper.
References
Anderson, L. W., Wittrock, M. C., Krathwohl, D. R., Mayer, R. E., & Pintrich, P. R. (2000).
Taxonomy for learning, teaching and assessing: A revision of Bloom's Taxonomy of Educational Objectives. Pearson Education.
Ayersman, D. J. (1996). Reviewing the research on hypermedia-based learning. Journal of Research on Computing in Education, 28 (4), 500-525.
Felder, R. M. & Silverman, L. K. (1988). Learning and teaching styles in engineering education.
Journal of Engineering Education, ASCE, 78 (7), 674–681.
Felder, R. M. (1988). How students learn: Adapting teaching styles to learning styles.
Proceedings, Frontiers in Education Conference,ASEE/IEEE, 489., Santa Barbara, CA.
Felder, R. M. (1993). Reaching the second tier: Learning and teaching styles in college science education. J. College Science Teaching, 23 (5), 286-290.
Felder, R. M. (1996). Matters of style. ASEE Prism, 6 (4), 18-23.
Felder, R. M. & Solomon, B. A. (2001). Learning styles and strategies [WWW document]. URL http://www.ncsu.edu/effective_teaching/ILSdir/styles.htm North Carolina State University.
Felder, R. M. (1993). Reaching the second tier: Learning and teaching styles in college science education. Journal of College Science Teaching, 23 (5), 286–290.
Felder, R. M. (1996). Matters of style. ASEE Prism, 6 (4), 18–23.
Grasha, A. (1996). Teaching with style: A practical guide to enhancing learning by understanding teaching and learning styles. Pittsburgh, PA: Alliance Publishers.
Kolb, D. A. (1984). Experiential learning: Experience as the source of learning and development. Englewood Cliffs, NJ: Prentice-Hall.
Lawrence, G. (1984). A synthesis of learning style research involving the MBTI. Journal of Psychological Type, 8, 2-15.
Lawrence, G. (1990). People types and tiger stripes, 3rd edition. Center for Applications of Psychological Type, Gainesville, FL.
Livesay, G., Dee, K., Felder, R. M., Hites, L., Nauman, E., & O’Neal, E. (2002). Statistical evaluation of the index of learning styles. Proceedings of the 2002 American Society for Engineering Education Annual Conference and Exposition, Montreal, Quebec, Canada.
Lyons, R. E., Kysilka, M. L., & Pawlas, G. E. (1999). The adjunct professor's guide to success: Surviving and thriving in the college classroom. Needham Heigths, MA: Allyn & Bacon.
McKeachie, W. (1980). Improving lectures by understanding students' information processing. In McKeachie, W.J. (Ed.), Learning, Cognition, and College Teaching. New Directions for Teaching and Learning, No. 2. San Francisco: Jossey-Bass Publishers.
Palmer, P. J. (1993). To know as we are known: A spirituality of education. New York: Harper Collins.
Palmer, P. J. (1997). The courage to teach: Exploring the inner landscape of a teacher's life.
New York: Jossey-Bass Publishers, Wiley.
Price, G.E. (1983). Diagnosing learning styles. New directions for continuing education, 19 49-55. San Francisco: Jossey-Bass, Inc.
Rosati, P. (1999). Specific differences and similarities in the learning preferences of engineering students. Proceedings of the 29th ASEE/IEEE Frontiers in Education Conference, (Session 12c1), San Juan, Puerto Rico.
Sarasin, L.C. (1998). Learning style perspectives: Impact in the classroom. Madison, WI: Atwood Publishing.
Schmeck, R. (1988), (Ed.). Learning strategies and learning styles. New York: Plenum Press.
Smith, K. A. & Waller, A. (1997). Afterward: New paradigms for college teaching. In Campbell, W. & Smith, K. (eds.), New Paradigms for College Teaching. Edina, MN: Interaction Book Company.
Tobias, S. (1990). They're not dumb, they're different: Stalking the second tier. Tucson, AZ: Research Corporation.
Van Zwanenberg, N., Wilkinson, L. J., & Anderson, A. (2000). Felder and Silverman’s index of learning styles and Hone and Mumford’s learning styles questionnaire: How do they compare and do they predict academic performance? Educational Psychology, 20 (3), 365-381.
Wankat, P. C., Felder, R. M., Smith, K. A., & Oreovicz, F. S (2002). The scholarship of teaching and learning engineering. In Huber, M. T. & Morreale, S. (Eds.), Disciplinary Styles in the Scholarship of Teaching and Learning: Exploring the Common Ground. Chapter 11. AAHE/Carnegie Foundation for the Advancement of Teaching, Washington, DC.
Wankat, P. C., & Oreovicz, F. (1993). Teaching engineering,New York: McGraw-Hill.
Wankat, P. C. (2001). The effective, efficient professor: Teaching scholarship and service. New York: Pearson Education.
Zywno, M. (2003). A contribution to validation of score meaning for Felder-Solomon’s index of learning styles. Proceedings of the 2003 American Society for Engineering Education Annual Conference and Expositio [WWW document]. URL http://www.ncsu.edu/effective_teaching/ ILSdir/Zywno_Validation_Study.pdf
Zywno, M. S. & Waalen, J. K. (2001). Analysis of student outcomes and attitudes in a
Appendix A
As shown in Figure 1, The ILS results are provided in the form of a four bipolar scales. A score is generated on each scale based on 11 questions with two possible mutually exclusive answers. The range of possible scores on any one dimension ranges from a +11 on one side of the dimension to a +11 on the other side. Take for example the Active/Reflective scale, the score can range form a +11 on the active side to a +11 on the reflective side. To calculate the mean score and standard deviation for a group of respondents, the possible range of scores has to be manipulated as follows:
1. For each dimension, tally the number of respondents that receive the same score 2. Create a table as that shown in Table A1.
3. Convert the possible scores on each dimension to range from a –11 on one side of the dimension to a +11 on the other side as shown in Table A2.
4. Find the mean and standard deviation using the following formula:
• Mean Score = ∑(no of Respondents receiving the same score) × Score) / (Total No. of respondents). For the example shown in Table A2, the mean score = [(0×−11 + 2×−10+…+ 1×5+…+0×11) / (0+2+0+4+…+2+5+5+0+…+0) = -2.71. Hence the mean is 2.71 on the active side).
• Variance = [∑(no of Respondents receiving the same score) * (Score – Mean)^2 / (Total No. of respondents)]. Then the standard deviation = (Variance)^(1/2). For the example shown in Table A2, the variance = [(0×(−11−(−2.71) ^2) + (2×(−10−(−2.71) ^2) +…+ (1×(5−(−2.71) ^2)+…+ (0×(11−(−2.71) ^2)] / (0+2+0+4+…+2+5+5+0+…+0) = 11.92. Hence the standard deviation is ± 3.45.
Table A1
Preparing group ILS results for mean and standard deviation calculation
Active / Reflective Dimension
11 10 9 8 7 6 5 4 3 2 1 0 1 2 3 4 5 6 7 8 9 10 11
Frequency* 0 2 0 4 0 6 11 1 16 1 6 2 5 5 0 3 1 0 0 0 0 0 0
*No. of Respondents receiving the same score
Group ILS results ready for mean and standard deviation calculation
Active / Reflective Dimension
-11 -10 -9 -8 -7 -6 -5 -4 -3 -2 -1 0 1 2 3 4 5 6 7 8 9 10 11
Frequency* 0 2 0 4 0 6 11 1 16 1 6 2 5 5 0 3 1 0 0 0 0 0 0