Optimization of Hydraulic Servo Parameter for
Semi-Solid Machine using Aerotech A3200
Fiqri Ibrahim Amien
1, Danny M. Gandana
2, Nasril
3, Dwi Astharini
4, Ahmad H. Lubis
51, 2, 3, 4, 5
Department of Electrical Engineering, Faculty of Science and Technology, University of Al Azhar Indonesia, Sisingamangaraja Street, Kebayoran Baru, Jakarta, 12110
Authors for Correspondence/E-mail: [email protected]
Abstract – Hydraulics machines are important parts in semi solid metal forging machine, to form the workpiece by pressing. Semi-solid machine positioning movements are required to have a high accuration, to get the high accuracy of the movement system a servo hydraulic control is added ,which consist of servo valve and digital controller (Aerotech A3200). The digital control parameters (kpos, kp, ki) are used to enhanced the hydraulic movement. To get the effect of the control parameters of the plant (hydraulic servo), a mathematical approach is used for simulation in matlab. In this research, study was done by optimize kp and ki parameters of the control system. Prior to the optimization, simulation was conducted using matlab. Where the simulated testing is using the input unit (step) and frequency (bode) to predict the circumstances that occurred to the plan which is then compared with experimental results. a step response was simulated in matlab to analyze the error of the hydraulic system. Having obtained the minimum error from adjusting kp and ki in matlab, a trend graphic error was used as a guideline to adjust parameter in actual system. The last step is to implement and adjust kp/ki in actual system and measure the real position error.Based on this research, it concluded that the error before adjustment are 0.6118-1.2642 mm for autotune parameter kp 3500000, ki 50000. The result of average error in this experiments after adjustment are 0.017-0.166 mm for parameter kp 250000, ki 10000.
Keywords - Hydraulic Servo, Aerotech A3200, Step response, Bode plot, Semi-Solid Machine.
INTRODUCTION
n most applications, the hydraulic system are widely used as moving heavy burden, as a tool of oppression and lifter. The industrial hydraulic systems of heavy equipment, such as lift trucks (dump truck), excavators, printing machines, press machines, flow forming machines, forklifts, cranes, and others, have used in every industry. In many heavy industries, the use of the hydraulic actuator system is a necessity. A hydraulic actuator is characterized by its ability to provide great strength at high speeds, require good dynamic performance control systems [1]. while trying produce good production quality and precision, industries might have problems with the system on a hydraulic servo position control. The position control system formed in a hydraulic servo
control system consist of a closed system position control, speed control, flow control, hydraulic piston and a linear scale sensor. Computers give commands to the servo amplifier system to open the hydraulic servo valve so as to drive the hydraulic piston to the commanded position. Linear scale sensor is used as a feedback sensor which provide hydraulic piston position data. System servo amplifiers maintain the position of the hydraulic piston by comparing the actual position of the sensor linear scale to the desired position in accordance with instructions from the computer, a servo amplifier perform error correction by adjusting the electrical current delivered to the system servo valve so that the hydraulic piston can achieve the commanded position
.
System Design & Mathematical Model
In this paper the mathematical modeling of the transfer function of hydraulic systems, aerotech a3200 and a linear scale sensor to be used in the analysis of the position error of the hydraulic piston movement. Positioning errors caused by hydraulic servo system is partly due to the response speed of the servo hydraulic piston hydraulic movement mechanism. The position error in transient and steady state conditions of the hydraulic piston movement is a result of a delay in the achievement of speed.
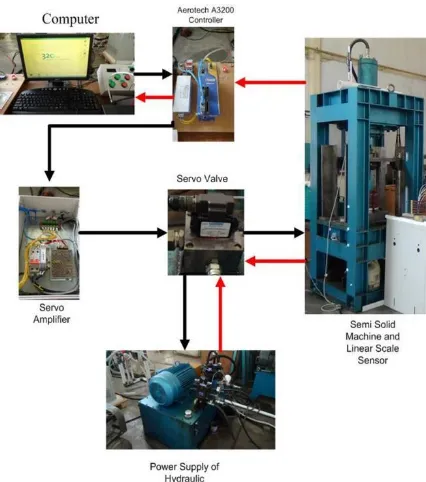
Figure 1. Design system of hydraulic machine
From the figure above there are two different line, red line and black line which the red line is ouput signal and the black line is input signal. The Figure 1. show that the computers give commands to the servo amplifier system to open the valve hydraulic servo piston hydraulic so that it can move to the commanded position. The hydraulic power supply will drain the oil to the servo valve for controlling the semi solid machine. Sensors linear scale is used as a feedback sensor which provides hydraulic piston position data. system servo amplifiers and servo system hydraulic guard position hydraulic piston by comparing the actual position of the linear sensor scale to the desired position in accordance with instructions from the computer and perform error correction by adjusting the electric current that is sent to the system servo valve so that the hydraulic piston can achieve the commanded position.
Figure 2. Block Diagram of Hydraulic servo
Figure above is the block diagram position of hydraulic servo , and the mathematical model below is transfer function of the plant plus controller a3200. This equation will be used in matlab simulation.
Simulation
Simulation of parameter Kp and Ki using matlab software. The result from simulation in matlab is figure close loop step response and bode plot. After that the make a program for calculate the minimum errors and make a trend graphic error for guideline in actual system. The results of simulation will be used to get the real error from the machine
Figure 3. Bode diagram from autotuning variable
Figure 4. Closed loop Step Response with P.I Parameters
The purpose of autotune process at previous chapter is to numerical simulation in matlab, which is using an autotune parameters to get the error area. The method for taking data from simulation obtained by changing or resetting each parameters. This parameter will be simulated with transfer function of Hydraulic system and controlled by KP and KI parameters. In Table 1 thus the method for changing or setting each parameter.
Table 1. Analyze Data in Simulation Method
Kp Ki
Change Fix
Fix Change
Change Change
After collecting the data in simulation, next step is determine the value of error area. error area which summed is the output from closed step response with KP and KI parameter. Figure 4. showns the results obtained from closed step response with KP = 3500000 and KI = 50000 from autotune process.
Trend error from KP
The simulation has adjust KP parameter each range until minimum error from system has obtained. And graphic from simulation obtained as trend, it yields:
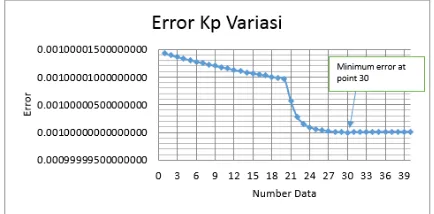
Figure 5. Trend of Kp = 3500000
Figure 5 show the minimum error area from adjusting Kp parameter have a result at point 30 with range = 500%; Kp = 21000000; Ki = 50000, and minimum error obtained in 0.001000000001567930. Trend graphic error as result from adjust KP parameter until have minimum error. It used as a guideline in adjusting actual system. Tuning KP parameter have a pattern, adjust KP parameter have stagnant graphic error.
Trend error from KI
Figure 6. Trend of Ki = 50000
Trend error from KP and KI
Figure 7. Trend of Kp = 3500000 and Ki = 50000
Figure 7 show the minimum error from adjusting Kp and Ki parameters have a result at point 30 with range = 500%; Kp = 21000000; Ki = 300000, and minimum error obtained in 0.00100000000156699. Trend graphic error as result from adjust KP and KI parameter until have minimum error. It used as a guideline in adjusting actual system. Tuning KP and KI parameter have a pattern, adjust KP and KI parameter have stagnant graphic error
EXPERIMENT & RESULT
Detects the error position of a semi-solid machine is an important part of this research. . in methods trial and error to take the data from the semi-solid machine is obtained by setting each of the parameters from autotune process and settings of the servo hydraulic pressure. The following table is the result of adjusting in actual system.
Table 2. Results of Adjusting Parameters on Actual System
The last parameter on adjusting parameter will be used to collect the error position on semi solid machine which controlled by the parameters Kp and Ki. The following figure is the comparison graphic of testing error
position in semi solid machine with two sets of parameters.
Graphic Results of Parameters Kp 3500000, Ki 50000
Figure 8. Graphic Result of Kp 3500000 , Ki 50000
For a value of Kp = 3500000 and Ki = 50000 on the Figure of 4.7 indicates that the default parameters of the experimental results lead to an unstable system conditions. captions on the figure explaining that the top graph is a command position, the middle graph shows the actual position, and the lower graph shows the error position .which the steady state occurs after the time 1640 ms. The y axis show the maximum error position reach to 20.919 mm.
Graphic Results of Parameters Kp 250000, Ki 10000
For a value of Kp = 250000 and Ki = 10000 on the Figure of 4.8 indicates that the default parameters of the experimental results lead to a stable system conditions. which the steady state occurs after the time 2460 ms. The y axis show the maximum error position reach to 0.029 mm.
Data Result
Having obtained the data of any change of control parameters will be discussed to see the effect of adjusting parameter with the system hydraulic servo. Where the effect of this will be known steps the right to improve the performance of the hydraulic servo movement. The result of data above can be summarized by table below.
Table 3. Result Summary
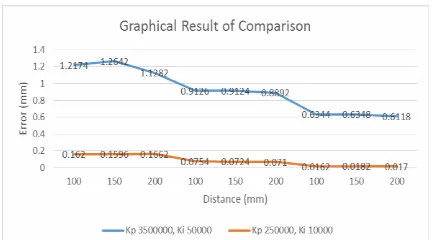
From Table 3 can be form to the graphic comparison to be analyzed as follow
Figure 10. Graphic Result of Comparison
CONCLUSION
1. From the Result and analysis that have been submitted the parameters on simulation and actual system which is used are . The value of adjust parameter in simulation is larger than on actual system adjusting. it can be concluded that simulation programs can be used to
predict the behavior of the system response the control parameter. But cannot predict the exact value of the system. This is because they are simply mathematical modeling the numerical simulation. Where not included modeling the motor servo valve and liquid properties such as bulk modulus and valve leakage factor which affect the movement of the system.
2. The purpose of this research to minimize the error position of hydraulic movement has been successfuly by using the adjusting parameter in actual system by trial and error method.
3. Before adjustment the error are 0.6118- 1.2642 mm for autotune parameter kp 3500000, ki 50000. The result of average error in this experiments after adjustment are 0.017-0.166 mm for parameter kp 250000, ki 10000.
4. Experimental tests showed that the performance and response of hydraulic system for position control is best when the pressure of the hydraulic oil is 135 bar compared with low pressure 70 bar.
REFERENCES
[1] Munaf F. Bader, “Position Control System of Hydraulic Cylinder Based on Microcontroller”, Journal of Engineering and Development, Vol. 12, No. 3, September 2008
[2] Ogata, katsuhiko .2010. “Modern Control Engineering”. Fifth edition. New jersey: Pearson
[3] Aerotech. 2000. A3200 Nview Help, Pittsburgh, USA.