Keywords:
Tourism; Marketing; Employment; Hoteleering; WorkersIntroduction
Tourism is a man-power intensive activity and increasingly provides direct and indirect employment both in the skilled and unskilled categories through various marketing services. he tourism industry covers a combination of various economic activities and industries like hospitality, transportation industry, travel arrangements and the like. It provides opportunities of employment to traders, cratsmen, musicians, artists, hoteliers, waiters, porters, and transport and tour operators. Several government departments are also involved in tourism promotion. hus, the employment content in tourism industry deserves a careful study.
Tourism and employment
Ministry of Tourism, Government of India has estimated that every Rs.10 lakhs invested in tourism created 47.5 jobs. he same amount if invested in agriculture and manufacturing sector can create only 44.7 and 12.6 jobs respectively. Today, the direct employment generated by tourism is estimated to be 164.5 lakhs. Indirect employment is much higher at 223.7 lakhs. A sample survey by the World Tourism Council, which uses a methodology called “Tourism Satellite Account” concludes that jobs generated by tourism could rise from today’s 2.4 per cent to 6.8 per cent in ten years which means 80 lakhs new jobs. Similarly, in respect of hotel industry, it is estimated that an investment of Rs.10 lakhs will give direct employment to 12 persons and ive rooms in a ive star hotel on an average give direct employment to eight
persons. he national development council had approved the 10th Five
Year (2002-2007) Plan on 21.12.2002, generates employment for ive crore persons, obviously, the tourism industry is bound to play a very signiicant role in the massive task [1].
Period of Study
he ield survey was conducted from September 2014 to June, 2015 for the collection primary data. he reference period of survey was 2014-2015.
Employment Potentials
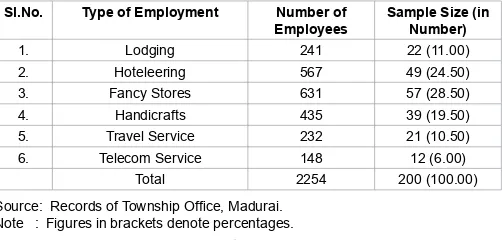
In this paper an attempt is made to study the employment potentials of tourism industry in Madurai region with a total of 200 sample employers drawn from the various sectors of the tourism
industry. he proportionate probability sampling technique has been adopted to select 200 employers from six sectors. his process has been carefully explained in Table 1.
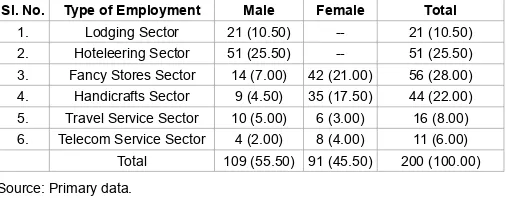
hese sample employers could be divided into males and females as shown in Table 2.
It is evident from the above table that among the 200 sample employers 54.50 per cent are males and 45.50 per cent are females. Out of 109 male employers (54.50 per cent) 21 are from the lodging sector, 51 are from the hoteleering sector, 14 are from the fancy stores, 9 are from the handicrats sector, 10 are from the travel agency sector and 4 are from the telecom service sector. Among the 91 female employers, 42 are from the fancy stores, 35 are from the handicrats sector, 6 are from the travel agencies sector and 8 are from the telecom service sector. hus it is clear that the tourism industry provides enormous opportunities for female employers too [2].
*Corresponding author: Selvaraj N, Assistant Professor of Commerce,
Saraswathi Narayanan College, Madurai, Tamilnadu, India, Tel: 09843727975; E-mail: [email protected]
Received November 09, 2015; Accepted March 11, 2016; Publish March 18, 2016
Citation: Selvaraj N (2016) Marketing of Tourism Services and Employment Generation in Madurai Region: A Study. J Account Mark 5: 162. doi: 10.4172/2168-9601.1000162
Copyright: © 2016 Selvaraj N. This is an open-access article distributed under the terms of the Creative Commons Attribution License, which permits unrestricted use, distribution, and reproduction in any medium, provided the original author and source are credited.
Marketing of Tourism Services and Employment Generation in Madurai
Region: A Study
Selvaraj N*
Assistant Professor of Commerce, Saraswathi Narayanan College, Madurai, Tamilnadu, India
Abstract
Tourism is a man-power intensive activity and increasingly provides direct and indirect employment both in the skilled and unskilled categories through various marketing services. Ministry of Tourism, Government of India has estimated that every Rs.10 lakhs invested in tourism created 47.5 jobs. The same amount if invested in agriculture and manufacturing sector can create only 44.7 and 12.6 jobs respectively. In Madurai region in all ive selected centers, tourism industry has in fact shaped along the lines of production oriented industries, in opening new vistas of employment opportunities to all categories of skilled and under skilled and educated and uneducated men and women. Several government departments are also involved in tourism promotion. Thus, the employment content in tourism industry deserves a careful study.
Sl.No. Type of Employment Number of
Employees
Sample Size (in Number)
1. Lodging 241 22 (11.00)
2. Hoteleering 567 49 (24.50)
3. Fancy Stores 631 57 (28.50)
4. Handicrafts 435 39 (19.50)
5. Travel Service 232 21 (10.50)
6. Telecom Service 148 12 (6.00)
Total 2254 200 (100.00)
Source: Records of Township Ofice, Madurai. Note : Figures in brackets denote percentages.
them 14 are from the lodging, 40 are from the hoteleering, 34 are from fancy stores, 30 are from the handicrats, 12 are from the travel agencies and 8 are from the telecom service.
Only 38 employers (19.00 per cent) are coming under the age group of 20-30 years. Among these, 5 from the lodging, 3 from the hoteleering, 18 from the fancy stores, 4 from the handicrat, 5 from the travel agency and 3 from the telecom service [4].
Finally 24 respondents (12.00 per cent) belong to the age group of above 50. Among them 3 is from the lodging, 6 are from the hoteleering, 5 are from the fancy stores, 5 are from the handicrats, 4 are from the travel agency and one is from telecom service.
hus, as it has already been pointed out earlier a sizeable percentage of the respondents came under the middle age group of 31-50 years [5].
Table 5 shows the educational status of the selected employers.
Table 5 depicts the educational status of selected employers in Madurai region. As it could be seen from it 72 employers have had only high school education. Among these 72 employers, 11 are from lodging, 23 are from hoteleering, 23 are from the fancy stores, 9 are from the handicrats, 2 are from the travel agency and 4 are from the telecom services [6].
Only 71 employers (35.50 per cent) belong to higher secondary level. Among them 2 are from the lodging, 14 are from the hoteleering, 20 are from the fancy stores, 23 are from the handicrats, 9 are from the travel agency and 3 are from the telecom service.
here are employers who belong to middle level as well. hey are found to be 34 in number. Among them 9 are from the lodging, 8 are from the hoteleering, 10 are from the fancy stores, 5 are from the handicrats and 2 is from travel agency [7].
Another signiicant point is that 16 employers (8.00 per cent) have had collegiate education. Among them one is from the hoteleering, 2 are from the fancy stores, 2 is from the handicrats, 8 are from the travel agency and 3 are from the telecom service.
here are 7 employers (3.50 per cent) with diplomas. Among such diploma holders, 3 are from the hoteleering, 2 are from the fancy stores and 2 are from the telecom service.
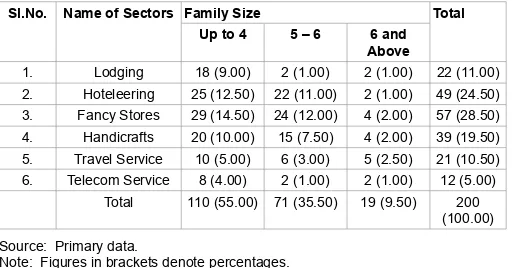
Family sizes of the selected employers are presented in Table 6.
Table 6 shows the size of the family of the selected employers in Another interesting thing is that a majority of the employers are
married. he following Table 3 shows how there exist simultaneously both married and unmarried employers in the tourism industry.
Table 3 shows the marital status of the employers in the tourism industry in Madurai region. he majority of the employers (59.50 per cent) are married. Only (40.50 per cent) are unmarried.
Among the 119 married employers, 18 are from the lodging sector, 31 are from hoteleering sector, 26 are from fancy stores, 25 from handicrats sector, 12 are from travel agency sector and 7 are from telecom service sector. Among the 81 employers who are unmarried, 4 are from lodging, 19 are from hoteleering, 35 are from fancy stores, 16 are from handicrats, 6 are from travel agency and 1 are from telecom service [3].
A study of the age-wise distribution of the selected employers is also possible. It is contained in Table 4.
he age-wise distribution of the selected employers is clearly explained in the Table 4. As it could be seen from the table 138 employers (69.00 per cent) belong to age group of 31-50 years. Among
Sl. No. Type of Employment Male Female Total
1. Lodging Sector 21 (10.50) -- 21 (10.50)
2. Hoteleering Sector 51 (25.50) -- 51 (25.50)
3. Fancy Stores Sector 14 (7.00) 42 (21.00) 56 (28.00)
4. Handicrafts Sector 9 (4.50) 35 (17.50) 44 (22.00)
5. Travel Service Sector 10 (5.00) 6 (3.00) 16 (8.00)
6. Telecom Service Sector 4 (2.00) 8 (4.00) 11 (6.00)
Total 109 (55.50) 91 (45.50) 200 (100.00)
Source: Primary data.
Note: Figures in brackets denote percentages.
Table 2: Sex-wise distribution of the selected employers.
Sl.No. Name of Sectors Married Unmarried Total
1. Lodging Sector 18 (9.00) 4 (2.00) 22 (11.00)
2. Hoteleering Sector 31 (15.50) 19 (9.50) 50 (25.00)
3. Fancy Stores Sector 26 (13.00) 35 (17.50) 61 (30.50)
4. Handicrafts Sector 25 (12.50) 16 (8.00) 41 (20.50)
5. Travel Service Sector 12 (6.00) 6 (3.00) 18 (9.00)
6. Telecom Service Sector 7 (5.88) 1 (1.23) 8 (4.00)
Total 119 (59.50) 81 (40.50) 200 (100.00)
Source: Primary data.
Note: Figures in brackets denote percentages.
Table 3: Marital status of the selected employers.
Sl. No. Type of
Employment
20-30 31-40 41-50 Above
50
Note: Figures in brackets denote percentages.
Table 4: Age-wise distribution of the selected employers.
Sl.
High HSS Degree Diploma Total
1. Lodging 9 (4.50) 11
(5.50)
2 (1.00) -- -- 22
(11.00)
2. Hoteleering 8 (4.00) 23
(11.50)
Note: Figures in brackets denote percentages.
Madurai region. he family size of 110 employers (55.00 per cent) is such that it does not exceed 4 members. Under these 18 are from the lodging, 25 are from the hoteleering, 29 are from the fancy stores, 20 are from the handicrats, 10 are from the travel agency and 8 are from the telecom service.
here are 71 employers (35.50 per cent) with families of 5 to 6 members. Among them 2 are from the lodging, 22 are from the hoteleering, 24 are from the fancy stores, 15 are from the handicrats, 6 are from the travel agency and 2 from the telecom service.
Finally, only 19 employers (9.50 per cent) belong to family size (6 and above). A sector wise break up of these igures is given in the third column.
he religion-wise distribution of the selected employers is presented in Table 7.
Table 7 shows religions to which the selected employers in Madurai region generally belong. Quite strongly enough only the sample employers 115 (57.50 per cent) are Hindu religion. Among them 10 are from the lodging, 31 are from the hot leering, 40 from the fancy stores, 18 are from the handicrats, 10 are from the travel agency and 6 are from the telecom service.
here are 52 employers (26.67 per cent) who belong to the Christian. Among them 6 are from the lodging, 10 are from the hoteleering, 9 are from the fancy stores, 18 are from the handicrats, 5 are from the travel agency and 4 are from the telecom service [8].
Among the sample employers the Muslim from the minority. hey are found to be only 33 in number. Among them 6 are from the lodging, 8 are from the hoteleering, 8 are from the fancy stores, 3 are from the handicrats, 6 are from the travel agency and 2 is from the telecom service.
Sl.No. Name of Sectors Family Size Total
Up to 4 5 – 6 6 and
Above
1. Lodging 18 (9.00) 2 (1.00) 2 (1.00) 22 (11.00)
2. Hoteleering 25 (12.50) 22 (11.00) 2 (1.00) 49 (24.50)
3. Fancy Stores 29 (14.50) 24 (12.00) 4 (2.00) 57 (28.50)
4. Handicrafts 20 (10.00) 15 (7.50) 4 (2.00) 39 (19.50)
5. Travel Service 10 (5.00) 6 (3.00) 5 (2.50) 21 (10.50)
6. Telecom Service 8 (4.00) 2 (1.00) 2 (1.00) 12 (5.00)
Total 110 (55.00) 71 (35.50) 19 (9.50) 200
(100.00)
Source: Primary data.
Note: Figures in brackets denote percentages.
Table 6: Size of the family of the selected employers.
Sl. No. Name of Sectors Religion Total
Hindu Christian Muslim
1. Lodging 10 (5.00) 6 (3.00) 6 (3.00) 22 (11.00)
2. Hoteleering 31 (15.50) 10 (5.00) 8 (4.00) 49 (24.50)
3. Fancy Stores 40 (20.00) 9 (4.50) 8 (4.00) 57 (28.50)
4. Handicrafts 18 (9.00) 18 (9.00) 3 (1.50) 39 (19.50)
5. Travel Service 10 (5.00) 5 (2.50) 6 (3.00) 21 (10.50)
6. Telecom Service 6 (3.00) 4 (2.00) 2 (0.83) 12 (6.00)
Total 115 (57.50) 52 (26.00) 33 (16.50) 200
(100.00)
Source: Primary data.
Note : Figures in brackets denote percentages.
Table 7: Religion-wise distribution of the selected employers.
A caste-wise distribution of the selected employers is given in Table 8.
Table 8 shows the caste wise distribution of selected employers in Madurai region. Caste has been classiied into three groups, namely Forward Caste (FC), Backward Caste (BC) and Scheduled Caste (SC). he majority of employers 111 (55.50 per cent) belong to backward community. Fity one employers (25.50 per cent) belong to forward community and only 38 employers (19.00 per cent) belong to scheduled caste. hus, backward communities play a role of predominant signiicance in tourism employment in Madurai region.
he family status of the selected employers is given in Table 9.
Table 9 reveals the family status of the selected employers in Madurai region. Families are classiied into joint families and nuclear families. A majority of the respondents 119 (59.50 per cent) came under the nuclear family. he remaining 81 respondents (40.50 per cent) belong to joint family.
Average annual income of the employers is given in Table 10.
Table 10 reveals the average annual income of the employers in Madurai region. 85 employers (42.50 per cent) earn a income ranging from Rs.100000 – 150000. Among these 10 from the lodging, 30 from the hoteleering, 26 from the fancy stores, 13 from the handicrats, 3 from the travel agency and 3 from the telecom service.
76 respondents (38.00 per cent) earn between Rs.50000-100000. Among these 13 from the lodging, 15 from the hoteleering, 25 from the fancy stores, 18 from the handicrats, 10 from the travel agency and 5 from the telecom service.
Only 19 respondents (9.50 per cent) earn income below Rs.50000. Among these 2 from the lodging, 2 from the hoteleering, 5 from the fancy stores, 5 from the handicrats, 3 from the travel agency and 2 from the telecom service.
Finally, 20 respondents (10.00 per cent) earn income between
Sl.No. Name of Sectors Caste Total
FC BC SC
1. Lodging 4 (2.00) 16 (8.00) 2 (1.00) 22 (11.00)
2. Hoteleering 9 (4.50) 38 (19.00) 2 (1.00) 49 (24.50)
3. Fancy Stores 15 (7.50) 32 (16.00) 10 (5.00) 57 (28.50)
4. Handicrafts 14 (12.00) 15 (7.50) 10 (5.00) 39 (19.50)
5. Travel Service 6 (3.00) 6 (3.00) 9 (4.50) 21 (10.50)
6. Telecom Service 3 (1.50) 4 (2.00) 5 (2.50) 12 (6.00)
Total 51 (25.50) 111 (55.50) 38 (19.00) 200
(100.00)
Source: Primary data.
Note: Figures in brackets denote percentages.
Table 8: Caste-wise distribution of the selected employers.
Sl.No. Name of Sectors Joint Family Nuclear
Family
Total
1. Lodging 2 (1.00) 20 (10.00) 22 (11.00)
2. Hoteleering 14 (7.00) 35 (17.50) 49 (24.50)
3. Fancy Stores 20 (10.00) 37 (18.50) 57 (28.50)
4. Handicrafts 24 (12.00) 15 (7.50) 39 (19.50)
5. Travel Service 12 (6.00) 9 (4.00) 21 (10.50)
6. Telecom Service 9 (4.50) 3 (1.50) 12 (6.00)
Total 81 (40.50) 119 (59.50) 200 (100.00)
Source: Primary data.
Note: Figures in brackets denote percentages.
Rs.150000-200000. Among these 7 from the lodging, 2 from the hoteleering, one from the fancy stores, 3 from the handicrats, 5 from the travel agency and 2 from the telecom service.
he details of the initial investment made by the selected employers in the study area are presented in Table 11.
Table 11 depicts the initial investment details of the selected respondents in Madurai region. here are 100 employers (50.00 per cent) having the initial investment between Rs.500000-700000. Among these, 3 from the lodging, 25 from the hoteleering, 32 from the fancy stores, 25 from the handicrats, 10 from the travel agency and 5 from the telecom service.
here are 62 respondents (31.00 per cent) having the investment between Rs.700000-1000000. Among these 12 respondents from the lodging, 16 respondents from the hoteleering and 15 from the fancy stores, 10 from the handicrats, 6 from the travel agency and 3 from the telecom services.
Only 26 respondents (13.00 per cent) are having the investment Rs.10 lakhs and above. Among these 5 from the lodging, 6 from the hoteleering, 7 from the fancy stores, 3 from the handicrats, 3 from travel agency and 2 from the telecom service.
Only 12 respondents (6.00 per cent) are having investment below Rs.500000. Among these 2 from the lodging, 2 from the hoteleering, 3
from fancy stores, one from handicrats, 2 from travel agencies and 2 from telecom service.
Diferent problems faced by the employers are depicted in Table 12.
Table 12 depicts the major problems faced by tourism employers in Madurai region. Out of 200 employers, 119 of them are facing the problem of non-uniformity in prices, 53 are faced with problems of inadequate water supply, and remaining 28 employers face both these problems simultaneously.
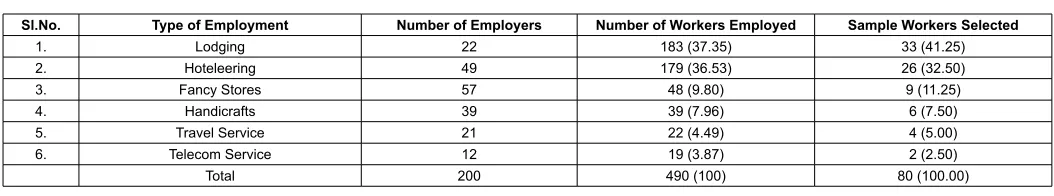
Workers Employed in Tourism
his section attempts to analyse the nature of employment opportunities available in the various sectors of the tourism industry. For this, 80 workers were randomly selected by adopting proportionate probability sampling technique. his selection process could be better understood from Table 13.
Table 13 reveals that the occupational distribution of workers employed in various sectors of the tourism industry in Madurai region. he table shows that the employers (183) are working in the lodging sectors, 179 are working in the hoteleering sectors, 48 are working in the fancy stores sectors, 39 are working in handicrats sectors, 22 are working in the travel agency sector and the remaining 19 are working in the telecom service sectors. hus there are persons are employed in the tourist industry in Madurai region.
Sl. No. Type of Employment Below Rs.50000 Rs.50000-100000 Rs.100000-150000 Rs.150000-200000 Total
1. Lodging 2 (1.00) 3 (1.50) 10 (5.00) 7 (3.50) 22 (11.00)
2. Hoteleering 2 (1.00) 15 (7.50) 30 (15.00) 2 (1.00) 49 (24.50)
3. Fancy Stores 5 (2.50) 25 (12.50) 26 (13.50) 1 (0.50) 57 (28.50)
4. Handicrafts 5 (2.50) 18 (9.00) 13 (6.50) 3 (1.50) 39 (19.50)
5. Travel Service 3 (1.50) 10 (5.00) 3 (1.50) 5 (2.50) 21 (10.50)
6. Telecom Service 2 (1.00) 5 (2.50) 3 (1.50) 2 (1.00) 12 (6.00)
Total 19 (9.50) 76 (38.00) 85 (42.50) 20 (10.00) 200 (100.00)
Source: Primary data.
Note: Figures in brackets denote percentages.
Table 10: Average annual income of the selected employers.
Sl.No. Type of Employment Below Rs.500000 Rs.500000-700000 Rs.700000-1000000 Rs.1000000 and above Total
1. Lodging 2 (1.00) 3 (1.50) 12 (6.00) 5 (2.50) 22 (11.00)
2. Hoteleering 2 (1.00) 25 (12.50) 16 (8.00) 6 (3.00) 49 (24.50)
3. Fancy Stores 3 (1.50) 32 (16.00) 15 (7.50) 7 (3.50) 57 (28.50)
4. Handicrafts 1 (0.50) 25 (12.50) 10 (5.00) 3 (1.50) 39 (19.50)
5. Travel Service 2 (1.00) 10 (5.00) 6 (3.00) 3 (1.50) 21 (10.50)
6. Telecom Service 2 (1.00) 5 (2.50) 3 (1.50) 2 (1.00) 12 (6.00)
Total 12 (6.00) 100 (50.00) 62 (31.00) 26 (13.00) 200 (100.00)
Source: Primary data.
Note: Figures in brackets denote percentages.
Table 11: Initial investment of the selected employers.
Sl.No. Type of Employment Non-Uniformity in Prices Less Drinking Water Facility Both Total
1. Lodging 11 (5.50) 7 (3.50) 4 (2.00) 22 (11.00)
2. Hoteleering 31 (15.50) 11 (5.50) 7 (3.50) 49 (24.50)
3. Fancy Stores 35 (17.50) 13 (6.50) 9 (4.50) 57 (28.50)
4. Handicrafts 22 (11.50) 13 (6.50) 4 (2.00) 39 (19.50)
5. Travel Service 11 (5.50) 7 (3.50) 3 (1.50) 21 (10.50)
6. Telecom Service 9 (4.50) 2 (1.00) 1 (0.50) 12 (6.00)
Total 119 (59.50) 53 (26.50) 28 (14.00) 200 (100.00)
Source: Primary data.
Note: Figures in brackets denote percentages.
he average annual income of the sample workers are given in Table 14.
Table 14 explains the average annual income of workers employed in various categories of employment in tourism in Madurai region. Out of 80 workers, 37 of them earn an annual income below Rs.10,000. And 35 workers earn an annual income of Rs. 10,000 to Rs.20,000, the remaining 8 workers are getting an annual income of Rs.20,000 to Rs.30,000. hus the majority of workers (72) earn the income range of below Rs.20,000 through various types of employment in the study area [9].
Table 15 clearly depicts the saving attitude of the workers in various employments in tourism.
Table 15 reveals the saving attitude of workers of diferent categories of employment in the tourism industry in Madurai region. he investigator could see that among her sample workers 53 inclined towards saving at least a very small portion of their income. Of these 53 workers, the lodging sector covers 21 workers, the hoteleering sector covers 18 workers, fancy stores covers 6, handicrats covers 4, travel agencies covers 3 and telecom services cover the remaining one worker.
hus it is clear that the tourism industry while providing opportunities of employment for people in lower income brackets
as well, has signiicantly paved the way for the growth of the socio-economic conditions of people in the lowest rung of the social ladder.
Summary
As this is the objective of the present investigation, the investigator has collected a huge mass of primary data to show how tourism has been responsible for the growth of micro and macro employers all over the district. From the analysis of such data, it becomes evident that these two categories of employers are centered around the hotel industry, the handicrafts industry, tourist promotion industry, transport industry and telecommunication services. These employers who have registered a mushroom growth over the years have been responsible for generating employment opportunities for both men and women in various age groups as shown. At the close of the present study the investigator contends that in Madurai region in all ive selected centres, tourism industry has in fact shaped along the lines of production oriented industries, in opening new vistas of employment opportunities to all categories of skilled and under skilled and educated and uneducated men and women.
Recommendations
The researcher recommends the following programmes for a still greater growth of the tourism industry in the years ahead:
1. Attractive lodges and hotels with eastern architecture and western convenience should come up very fast along sea shores and places of scenic beauty.
2. An environmental study of places of tourist attraction should be held quite systematically as a prelude to bringing into existence more and more places of tourist centers.
Sl.No. Type of Employment Number of Employers Number of Workers Employed Sample Workers Selected
1. Lodging 22 183 (37.35) 33 (41.25)
2. Hoteleering 49 179 (36.53) 26 (32.50)
3. Fancy Stores 57 48 (9.80) 9 (11.25)
4. Handicrafts 39 39 (7.96) 6 (7.50)
5. Travel Service 21 22 (4.49) 4 (5.00)
6. Telecom Service 12 19 (3.87) 2 (2.50)
Total 200 490 (100) 80 (100.00)
Source: Primary data.
Note: Figures in brackets denote percentages.
Table 13: The problems encountered by employers in the tourist industry.
Sl.No. Type of Employment Below Rs.10000 Rs.10000-20000 Rs.20000-30000 Total
1. Lodging 13 (16.25) 16 (20.00) 4 (5.00) 33 (41.25)
2. Hoteleering 14 (17.50) 11 (13.75) 1 (1.25) 26 (32.50)
3. Fancy Stores 4 (5.00) 3 (3.75) 2 (2.50) 9 (11.25)
4. Handicrafts 3 (3.75) 2 (2.50) 1 (1.25) 6 (7.50)
5. Travel Service 2 (2.50) 2 (2.50) -- 4 (5.00)
6. Telecom Service 1 (1.25) 1 (1.25) -- 2 (2.50)
Total 37 (46.25) 35 (43.75) 8 (10.00) 80 (100.00)
Source: Primary data.
Note: Figures in brackets denote percentages.
Table 14: Average annual income of workers (in rupees).
Source: Primary data.
Note: Figures in brackets denote percentages.
Table 15: Saving attitude of workers.
Sl.No. Type of Employment Savings No Savings Total
1. Lodging 21 (26.25) 12 (15.00) 33 (41.25)
2. Hoteleering 18 (22.50) 8 (10.00) 26 (32.50)
3. Fancy Stores 6 (32.50) 3 (3.75) 9 (11.25)
4. Handicrafts 4 (5.00) 2 (2.50) 6 (7.50)
5. Travel Service 3 (3.75) 1 (1.25) 4 (5.00)
6. Telecom Service 1 (1.25) 1 (1.25) 2 (2.50)
References
1. (2011-2012)Tourism Policy Note.
2. (2014) Tourism Marketing.
3. Markgraf B,Media D (2016) Eight P’s in Marketing Tourism.
4. Srinivasan Kannan(2009)Tourism Marketing: A Service Marketing perspective.
5. (2010) TOUR7010 - Tourism Services Marketing.
6. Zhenhua Liu (2000) Internet Tourism Marketing: Potential and Constraints.
7. (2016) Business and Economic Development, North west Territories industry, Tourism and investment.
8. (2016) Marketing Plans & Strategies, Tourism - We Get It.
9. (2016) Inbound Tourism, Japan Tourism Marketing Co.
Citation: Selvaraj N (2016) Marketing of Tourism Services and Employment Generation in Madurai Region: A Study. J Account Mark 5: 162. doi: 10.4172/2168-9601.1000162
OMICS International: Publication Benefits & Features Unique features:
• Increased global visibility of articles through worldwide distribution and indexing • Showcasing recent research output in a timely and updated manner • Special issues on the current trends of scientiic research Special features:
• 700+ Open Access Journals • 50,000+ editorial team • Rapid review process
• Quality and quick editorial, review and publication processing • Indexing at major indexing services
• Sharing Option: Social Networking Enabled
• Authors, Reviewers and Editors rewarded with online Scientiic Credits • Better discount for your subsequent articles