Development Funds to Dependent Regions
Surrounding the U.S. DOE’s Major Nuclear
Weapons Sites
Michael Frisch, Laura Solitare, Michael Greenberg, and Karen Lowrie,Rutgers University
Using an interregional econometric simulation model, a comparative analysis was made of the economic impacts of providing funds for environmental management, education, and infrastructure to the regions surrounding four of the United States Department of Energy’s massive former nuclear weapons sites in Idaho, Tennessee, South Carolina, and Washington. Infrastructure funds were used to build sewers, water lines, roads, bridges, and maintain existing infrastructure. Education funds were invested in higher education, primary and vocational schools, books, and libraries. Environmental management funds were invested in on-site remediation. Education produced the most jobs and personal income per dollar of investment, followed by environmental management. Infrastructure, by far, produced the least impact. An important reason for these results is that the relatively small regional economies surrounding these sites are unable to supply the goods and services required for major expansions. Hence, there is considerable leakage of investments to other regions. The limitations of these models to capture feedbacks from investments is emphasized. 2001 Society for Policy Modeling. Published by Elsevier Science Inc.
Address correspondence to Dr. M. Greenberg, Rutgers University, E.J. Bloustein School of Planning and Public Policy, Suite 100, 33 Livingston Avenue, New Brunswick, NJ 08901-1958. E-mail address: [email protected].
The authors would like to thank Charles Powers, Bernard Goldstein, Gilbert Omenn, Jack Moore, Arthur Upton, and our other colleagues for encouraging this work. We would like to thank Christopher Noah of the Westinghouse Savannah River Company for his comments. This project was supported by a cooperative grant to the Consortium for Risk Evaluation with Stakeholder Participation (CRESP) from the U.S. Department of Energy, Instrument DE-FC01-95EW 55084. The observations, conclusions, and interpretations are solely the responsibility of the authors, and should not in any way be interpreted as representing the views of the U.S. Department of Energy, its contractors, or any other members of CRESP.
Received March 1998; final draft accepted March 1998.
Journal of Policy Modeling22(7):801–819 (2000)
1. INTRODUCTION
In 1989, the U.S. Department of Energy (DOE) acknowledged responsibility for environmental contamination at its former nu-clear weapons sites by creating an Office of Environmental Man-agement (EM). The DOE’s environmental manMan-agement budget is the most expensive program aimed at remediating hazardous waste problems in the world. Measured by budget, the DOE program is larger than the U.S. Environmental Protection Agency’s Superfund program, the U.S. Department of Defense’s program, and all the other U.S. federal and state agency hazardous waste management programs (Russell, Colglazier, English, 1991; Office of Environmental Management, 1995a). The current EM budget is about $6 billion a year. The DOE estimates a total expenditure of $230 billion during the period 1995–2070, with a range of $200 to $350 billion for environmental remediation (Of-fice of Environmental Management 1995a, 1995b; U.S. Depart-ment of Energy, 1995, 1996, 1997a). Whatever one thinks about the DOE’s past behavior regarding the pollution it created, the amount of money currently allocated and projected to be allocated for EM purposes represents an enormous national commitment to deal with the local environmental legacy of nuclear weapons. In stark contrast, the DOE has a tiny economic transition pro-gram. During the years 1995 and 1996, the DOE spent $72 million at its major sites (U.S. Department of Energy, 1997b). This com-pares to about $12 billion spent on environmental management: 167 times as much was spent on environmental management.
and Environmental Laboratory, or INEEL), South Carolina (Sa-vannah River), Tennessee (Oak Ridge), and Washington (Han-ford) exemplify the pairing of economic dependency and environ-mental contamination. (See footnote for brief site descriptions.1) As context for economic dependency, in 1994, federal spending (in terms of consumption and investment) accounted for 7.4 percent of the gross domestic product of the United States. DOE accounted for an average of 1.1 percent of federal spending. Therefore, DOE accounted for 0.08 percent of G.D.P. So any region where DOE spending accounts for more than 0.08 percent of gross regional product should be considered to have a concentration of DOE expenditures. All four regions far exceed the average. Analyses of DOE funding and gross regional product data show that 16, 19, 14, and 16 percent, respectively, of the gross regional products in the areas immediately surrounding the Hanford, INEEL, Oak Ridge, and Savannah River sites were directly attributable to DOE funds. In some cities, towns, and boroughs, more than half of the population is supported by the DOE facility (Lancaster, 1984; Gerber, 1992; Mavrides, 1995; Schill, 1996; Greenberg et al., 1997). Substantial economic growth occurred in these four regions during the cold war buildup that began in the middle of the 1970s (Greenberg et al., 1997). But in 1989, the cold war ended, the major nuclear weapons buildup stopped, and the DOE began to dismantle its weapons complex.
While the nuclear weapons mission was ending, an environmen-tal management mission started. The budget for the DOE’s envi-ronmental management program at the four sites grew from $1.5 billion in 1990 to 3.2 billion in 1996 (in constant 1992$). Indeed,
1TheHanfordsite is located in south-central Washington just north of the confluence
The primary purpose of this paper is to examine the local eco-nomic impacts of providing off-site place-based funding to the regions surrounding the four major economically dependent and environmentally contaminated nuclear weapons sites. The second purpose is to compare these off-site economic impacts with those from the application of the same amount of on-site environmental remediation funds. The two research questions associated with these purposes were as follows: 1) what is the local impact mea-sured by jobs and personal income of providing funds for typical types of off-site economic development? 2) How do the economic impacts of off-site funds compare with those of on-site environ-mental management projects?
Before proceeding, the reader should know that this research was funded by the U.S. DOE under a cooperative grant to explore issues of importance to local and national stakeholders. It is the concern of the regions, rather than the DOE, which prompted this study. For the record, the DOE did not request this study nor in any other way influence the research question, design, or interpretations of the results.
2. METHODS AND THEIR LIMITATIONS
An econometric model developed by Regional Economic Mod-eling Inc. (REMI) was constructed for the research. The model uses national forecasts developed by the U.S. Department of Labor as national estimates (Saunders, 1993). The county is the building block for the regions in the model. The model is a dynamic repre-sentation of the economic relationships among capital stock, final demand, labor supply, output, prices, profits, and wages from the period 1969–94. The forecasts include measures of economic output, interindustry detail, multiregional effects, and a demographic ele-ment (Grimes, Fulton, and Bonardelli, 1992; Treyz, 1993).
Other sites were also considered for inclusion in the analysis. The Rocky Flats site in Colorado annually receives more than $400 million in environmental management funds from the DOE. But Rocky Flats is located in the Denver metropolitan region, which has a population of over two million. The DOE funds are important to the local county, but account for less than 1 percent of the gross regional product of the Denver Metropolitan area. Therefore, the Rocky Flats region was not included. DOE funds account for more than 14 percent of the gross regional product (GRP) of the collective of Los Alamos and Sandia regions in New Mexico. But these sites receive much less environmental management funding, so they were not included. In short, the four regions we chose should be the best places to examine the impact of off-site economic redevelopment funds in regions with a major environmental legacy and also heavily dependent on DOE funds.
The second decision about regions was how to define the precise boundaries of the regions. The DOE facilities in the four study regions were originally located in rural areas. Over the years, urbanization has moved from the nearest cities toward each of the sites. Oak Ridge is now part of a major metropolitan region of 600,000 people. Knoxville, its major city, has a population of 167,000. Smaller metropolitan regions exist at the other three sites. The combined population of the largest cities at the other three sites, Kennewick (Hanford site), Idaho Falls (INEEL), and Au-gusta (Savannah River), is less than Knoxville. Microeconomic theory suggests that the greater urbanization at the Oak Ridge site will translate into a greater ability to capture indirect and induced effects of federal investments. In other words, the Idaho, South Carolina, and Washington regions were expected to lose more of the investments to outside areas than the Oak Ridge region.
Table 1: Definition of Nuclear Weapons Site Regions Used in the Study
Region; state; county
1. Hanford; Washington (WA); Adams, Benton, Franklin, Grant, Yakima 2. Idaho National Environmental Engineering Laboratory (INEEL); Idaho (ID);
Bingham, Bonneville, Butte, Clark, Jefferson
3. Oak Ridge; Tennessee (TN); Anderson, Blount, Knox, Loudon, Morgan, Roane 4. Savannah River (SRS); Georgia (GA); Burke, Richmond; South Carolina (SC);
Aiken, Allendale, Barnwell
5. Other major DOE sites; includes 43 counties near 14 other weapons sites. The 14 sites are Burlington (IO), Fernald (OH), Kansas City (MO), Lawrence Livermore (CA), Los Alamos (NM), Mound (OH), Nevada Test Site (NV), Paducah (KY), Pinellas (FL), Portsmouth (OH), Rocky Flats (CO), Sandia (NM), Waste Isolation Plant (NM), Weldon Spring (MO)
6. Rest of U.S.; Includes almost 3,000 counties1
1The DOE has over 130 sites. Facilities in over 100 of these 3,000 receive some
DOE EM funding.
a distance is that it provides a consistent definition and allows us to measure how off-site effects vary by region over a fixed distance. The third decision about regions was to build a model that could capture transactions that occur between the major DOE regions. Conversations with staff at the Savannah River Site implied that there are formal transactions between the site regions. In other words, when the DOE builds or remediates at the Savannah River site some flow of dollars occurs at the other sites. We needed a model capable of capturing transactions between the Savannah River site and Hanford, INEEL, and Oak Ridge. In 1996, as previously noted, the four sites received 55 percent of the DOE’s environmental management funding. In addition, the DOE has 14 other weapons sites that also have received 28 percent of EM funding from the DOE (office of Environmental Management 1995a, 1995b). We expected that some of these sites, which include Los Alamos and Sandia (NM), and Lawrence Livermore (CA), might also interact with the four major sites. Consequently, the third design decision was to build a model that contains the four regions, an aggregate for these 14 other DOE site regions, and the rest of the United States. Table 1 shows the final set of regions and counties included in the analysis.
with REMI or any simulation model are dubious. Therefore, we chose the year 2010 as the end of our forecasting period.
The extent of interindustry detail was a fifth design decision. The model we used has 14 economic sectors: durable products manufacturing; nondurable products manufacturing; mining; con-struction; transport and public utilities; finance, insurance and real estate; retail trade; wholesale trade; services; agricultural services; state and local government; federal civilian; federal military; and farm. The U.S. Bureau of Economic Analysis, which prepared the data used in REMI, characterizes employment at these DOE sites by the business of the site contractor. Thus, when DuPont was operating contractor fo the Savannah River site, employment at the site was assigned to the inorganic chemical industry, or in the case of our model to nondurable manufacturing. Nondurable manufacturing is also the industrial sector of the major contractors at the other three sites. Hence, in our model nondurable manufac-turing is where nearly all of the DOE jobs have been located at the Hanford, INEEL, Oak Ridge, and Savannah River sites. The limitation of the classification used in our simulation model is that there is some nondurable manufacturing unrelated to the DOE site in these regions, and the equations in our models are doubt-lessly distorted by mixing the transactions of the DOE in with them. The only way of avoiding this problem is to develop a model with much greater business sector detail. In the case of REMI, a 53-sector and 172-sector model could have been developed. Either would have reduced this problem. However, cost was prohibitive. Specifically, the model we used costs about $20,000. The 53-sector model cost about three times as much, and the 172-sector model costs about seven times as much.
albeit small difference between the compensated and uncompen-sated runs.
The seventh decision was to rely on published DOE reports to distribute EM funds for the period 1997–2010 (U.S. Department of Environmental Protection, 1995, 1996, 1997a). Historical data for the period 1990–96 show some changes occur in EM alloca-tions. However, lacking an alternative source or rationale for allocations, we relied on the DOE’s internal documents.
The eighth decision was to choose infrastructure and education as the off-site economic development opportunities to test. This pair was chosen based on the literature, interviews in communities and media reports (Employment Research Associates, 1988; Aschauer, 1989; Anderson, Bischak, and Oden 1991; National Research Council, 1995; PH Fantus, 1995; Murnane and Levy 1996; Levy and Murnane, 1997). Infrastructure was allocated in the following proportions: one-half to water and sanitation, including combined services; and one-half to state and local highways.
Education was allocated in two ways. One, called “education,” allocated one-third of the investment to colleges and universities, one-third to elementary and secondary schools, and one-third to libraries, vocational, and other schools. The second, which we called “education/building,” allocated one-half to building educa-tion facilities, one-sixth to college and universities, one-sixth to elementary and secondary schools, and one-sixth to libraries, voca-tional, and other schools.
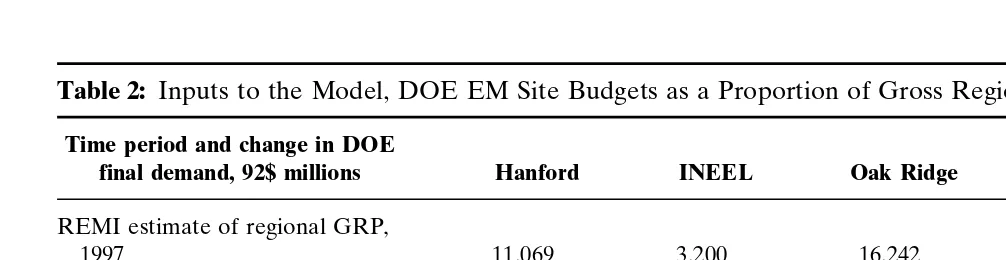
The actual amount of funding allocated among the four sites was arbitrarily set at 10 percent of the average amount of EM funding allocated to the four sites during the period 1990–96. Changes of 10 percent or more are common at the sites, and budget increases of 50 percent have occurred during the last quar-ter century. Yet 50 percent seemed unrealistically high for a U.S. government regional economic assistance program during the pe-riod of time when government spending is carefully scrutinized. Table 2 shows that the annual average EM funds for the four sites is $2.64 billion. We allocated 10 percent of that total, or $264 million dollars to the four sites during the period 1997–2010 in direct proportion to the allocations recorded during the period 1990–96. This means that each year Hanford, Savannah River, INEEL, and Oak Ridge regions received 43, 27, 15, and 15 percent, respectively, of the $264 million.
Infrastructure, education, and environmental management illus-trate economic investment options that theory predicts would have different economic impacts on these four regions. Building bridges, roads, sewer lines and water mains, and other types of infrastructure has historically been touted as a way of injecting money into a region. Yet, as a method of bringing jobs and personal income, infrastructure has limitations in relatively small rural re-gions. Specifically, a good deal of every dollar spent goes to materi-als and machines purchased from outside the region. The people who are hired to build often must be brought in from other regions. In contrast, investing in education means hiring teachers, teacher assistants, buying paper and books, and some construction. Teach-ers’ salaries are also less than construction workers. Most of the people are local or will become local residents. At the national scale, we used our econometric model to estimate the cost to add an additional education and infrastructure worker. It cost 50 percent more to add an infrastructure job than an education job. Therefore, we expected investments in education to produce more jobs and personal income than infrastructure. We developed the education/building option to test the impacts of a 50-50 combina-tion of funding educacombina-tion practices and building new facilities for education.
3. RESULTS
3A. Preliminary Tests
DEVELOPMENT
FOR
U.S.
DOE
REGIONS
811
Table 2: Inputs to the Model, DOE EM Site Budgets as a Proportion of Gross Regional Product, 1997–2010
Time period and change in DOE
final demand, 92$ millions Hanford INEEL Oak Ridge Savannah River Total of four sites
REMI estimate of regional GRP,
1997 11,069 3,200 16,242 9,729 40,240
2010 13,870 4,097 21,039 12,332 51,338
DOE EM final demand, baseline
annual average 1990–96 1,141 402 387 712 2,642
1997 percent of Region GRP 10.3 12.6 2.4 7.3 6.6
2010 percent of Region GRP 8.2 9.8 1.8 5.8 5.1
Ten percent of DOE final demand 114.1 40.2 38.7 71.2 264.2
1997 percent of Region GRP 1.03 1.26 0.24 0.73 0.66
compensation from other federal programs. The uncompensated computer runs assume that the additional budgetary resources come from another source outside the model. The compensated computer runs assume that every one of the $264 million added to the off-site economic development or on-site DOE EM program comes out of another federal government program. As expected, there were only small differences between the compensated and uncompensated analyses in our four regions of interest. During the period 1997–2000, change in employment decreased an average of less than 10 percent. The difference between the compensated and uncompensated results decline to less than 5 percent by the end of the simulation period. Because the compensated and un-compensated runs are strongly correlated, it is unnecessary to present both sets of results. We present the uncompensated ones and note that the compensated runs produce fewer jobs and less increase in personal income.
3B. Question 1: Regional Economic Impacts of Changes in Infrastructure and Educational Investments
In the baseline forecast from 1997 to the year 2010, the model implicitly continues current DOE funding patterns levels into the future. We estimated what would happen if 10 percent more money was added to the region for off-site infrastructure or educa-tion. That is, $264 million is added every year. Changes were modeled to occur between 1996 and 1997, and then to continue throughout the study period. Therefore, the biggest economic impacts are in 1997, which is the first year of the simulations. These impacts decrease during the study period. For example, the gross regional product (GRP) of the Savannah River region is estimated to increase from $9.7 billion in the year 1997 to $12.3 billion in the year 2010 (Table 2). The average annual DOE EM budget for the period 1990–96 at the site was $712 million. The baseline scenario continued $712 billion as the budget for the entire study period. Hence, the DOE proportion of the regional GRP decreased from 7.3 percent in 1997 to 5.8 percent in the year 2010. In addition to this expected growth and continuation of DOE EM funding, we added another 10 percent of the DOE EM total, or $71.2 million to the regional GRP in the form of infra-structure or education spending.
Table 3: Estimated Impact of Adding 10 Percent of DOE EM Budgets to Off-Site Activities on Four Site-Regions, 1997–2010
Oak Savannah Total of Investment strategy/site region Hanford INEEL Ridge River four sites
Employment baseline, 1997 263,086 81,071 378,503 236,022 958,682 Personal income baseline,
1997, $ millions 10,213 2,771 14,657 8,510 36,151 Infrastructure
Employment
1997 2,242 777 1,232 1,447 5,698
2010 1,702 501 798 1,027 4,028
Personal income, $ millions
1997 67 20 36 37 160
2010 105 25 45 52 227
Education Employment,
1997 4,014 1,429 2,190 2,932 10,565
2010 3,666 1,206 1,846 2,585 9,303
Personal income, $ millions
1997 111 39 61 63 274
2010 218 64 102 119 503
Education/building Employment,
1997 3,143 1,113 1,710 2,175 8,141
2010 2,818 912 1,387 1,898 7,015
Personal income, $ millions
1997 91 30 49 50 220
2010 174 49 78 91 392
Environmental management Employment,
1997 3,366 1,163 2,082 2,353 8,964
2010 2,991 896 1,836 1,985 7,708
Personal income, $ millions
1997 106 34 70 64 274
2010 187 50 114 103 454
a site creates jobs and personal income in the local region. Some funds purchase goods and services outside the regions. In addition, when some of the money is spent locally, it pays the salaries of local employees. This, in turn, further stimulates purchases of goods and services both locally and outside the region. Table 3 presents the net increases in jobs and personal income in the years 1997 and 2010.
Table 4: Investments to Create a Local Job, 1997 ($1,000s)
Oak Savannah
Additions to: Hanford INEEL Ridge River
Education 28.1 28.4 17.7 24.3
Education/building 36.1 36.3 22.6 32.7
Infrastructure 49.3 50.3 30.4 48.2
Environmental management 33.9 34.5 18.6 30.3
and 4,000 jobs and $227 million in personal income in the year 2010. In contrast, the same increase in education adds 10,600 jobs and $274 million in income in 1997 and 9,300 jobs and $503 million in personal income in the year 2010. In other words, in the year 1997, 85 percent more jobs and 71 percent more personal income is generated by education than by infrastructure. By the year 2010, this difference is 131 percent for jobs and 122 percent for personal income.
The biggest differences in jobs and personal income between infrastructure and education are at the Savannah River and IN-EEL sites. In 1997, the same investment in education produces about double the number of jobs and almost double the personal income.
The impacts of a combination of education/building falls be-tween the education and infrastructure ones, somewhat closer to education than infrastructure.
3C. Question 2: Comparison of On-Site Environmental Management and Off-Site Options
Table 3 shows that in 1997 the expansion of on-site environmen-tal management activities produces about 15 percent fewer jobs than education but more than 50 percent more jobs than infrastruc-ture. Regarding personal income, EM produces the same personal income as education in 1997 and about 10 percent less in 2010.
region that produces the most jobs per dollar of investment, has the largest nearby city. INEEL, the least urbanized location, has the lowest job creation per dollar of investment. The other two sites fell between Oak Ridge and INEEL in urban/rural mix.
Time series of the economic impacts shows the importance of job and income leakage out of these relatively rural regions. The maximum impact at every site occurs in the year 1997. Thereafter, the DOE investment becomes a smaller share of the regional economy. Figure 1 shows that the decline of job impacts slows down and reverses toward the end of the study period. Specifically, looking at the four sites as a single aggregate, the model shows that indirect and induced effects associated with education stop the decline of jobs by the year 2006. Jobs rise between 2006 and 2007. By the year 2010, they are estimated to be at the same level as the year 2003. The decline of direct job impacts from investments in environmental management stop in the year 2008 and start to increase again in 2009 and 2010 as the multiplicative impact of new jobs starts to become obvious. In contrast, infra-structure job impacts decline throughout the study period because too much of the investment occurs outside the region.
Regarding individual sites, Oak Ridge, the most urbanized, clearly has an advantage in capturing external investments. The
Oak Ridge economy captures a sufficient share of the infrastruc-ture investment to stop the job impact decline by the year 2008. By the year 2010, the number of jobs added equals the number in the year 2006. Indirect and induced effects do not balance the losses in direct effects at Hanford and SRS until the year 2010. At INEEL, the least urbanized region, infrastructure continues to decline throughout the study period to the extent that it over-shadows slight rebounding at the other three.
4. CONCLUSIONS
The finding that off-site investments in education and on-site investments in environmental management produce more jobs and personal income than off-site investments in infrastructure is consistent with theory, as is the finding that the largest metropoli-tan region, Oak Ridge, captures more of the investments than the other three sites. These results must be not be accepted at face value because of the limitations of the data and methods. In this research, we relied on a model that has somewhat limited abilities to capture interindustry differences. We think a model with many more economic sectors would yield more reliable estimates. As part of our ongoing research, a model has been constructed for the Savannah River site that includes 53 business sectors rather than the 14 used in this study. We assume that the more detailed model will produce more accurate and precise estimates.
journal are well aware, follow-up studies are needed to determine how investments in infrastructure, education, and environmental management can be used to stimulate new business growth. We have begun such a study at the four sites and the Rocky Flats (Colorado) site. That study includes an empirical analysis of the types of businesses that are currently found in the region compared to the types of businesses found in regions with similar economic and population characteristics and growth rates during the period 1970–94. The second phase of that study, which will be based on interviews, will focus on the ability of business leaders in the regions to organize coalitions required to compete for new busi-ness or grow new busibusi-ness. In other words, we want to determine how prepared the regions are to use effectively off-site investments in infrastructure or education to build viable regional economies. Furthermore, no model can predict the noneconomic but more political responses of regional leaders to address this substantial regional resource drain. It some cases, elected officials, business, and other leaders have responded with increased governmental lobbying and industrial recruitment to fill the gap left by the decrease in environmental management and other DOE funds. In other words, these economic impacts are not occurring in a political vacuum. These data themselves will become part of the political process.
A fourth limitation of the present study is that we chose educa-tion, infrastructure, and on-site environmental management. Each region and jurisdiction within it doubtlessly have their own ideas of how they want to rebuild their economy. Documents from literature and from the regions show that infrastructure and educa-tion are at or near the top of priority lists. However, there are exceptions, and as noted above, it is essential that objectives stud-ies evaluate the reality of the success of education, infrastructure, and other investments in stimulating economic growth. For exam-ple, there is considerable public support in the Savannah River region for building facilities that would produce tritium and man-age plutonium, in other words, to continue the region’s historical nuclear mission. Expansion of recreation is another popular alter-native at some sites. Given our role to assist stakeholders, we are prepared to test the economic impacts of these alternatives, as well as those tested in this study.
and there is already a massive literature, some of which was cited earlier in the paper, that argues for and against government pro-grams to aid defense-dependent regions. Our feeling is that credi-ble empirical studies are needed to provide regional interests and federal officials with some idea of what is likely to happen if a government investment program is launched. Overall, our view is that these state-dependent regions need to form a consensual process that will guide them to a realistic image of an economic future. We firmly believe that a necessary step in that evolution is assessing a variety of plausible economic investment strategies with simulation models capable of assessing a wide variety of options. The simulations reported here are the first of a series aimed at examining the broad advantages and disadvantages of different strategies.
REFERENCES
Anderson, M., Bischak, G., and Oden, M. (1991)Converting the American Economy.
Lansing, MI: Employment Research Associates.
Aschauer, D. (1989) Is Public Expenditure Productive?Journal of Monetary Economics
23:177–200.
Brauer, J. (1995) U.S. Military Nuclear Production Sites: Do They Attract Or Reject Jobs?
Medicine and Global Survival2:35–44.
Employment Research Associates, Inc. (1988)A Shift in Military Spending to America’s Cities. Washington, DC: Report for the United States Conference of Mayors. Gepfert, K. (1996) Savannah River’s Prosperous Past May Be Undermining Its Future.
Wall Street JournalMay 22: S1.
Gerber, M. (1992)On the Home Front: the Cold War Legacy of the Hanford Nuclear Site. Lincoln, NE: University of Nebraska Press.
Greenberg, M., and Simon, D. (1995) Demographic Characteristics of Counties Adjacent to the Savannah River, Hanford, and Other Major U.S. Department of Energy Sites. Report 1 to CRESP, New Brunswick, NJ.
Greenberg, M., Isserman, A., Frisch, M., Krueckeberg, D., Lowrie, K., Mayer, H., Simon, D., and Sorenson, D. (1997) Major nuclear weapons sites: Economic impacts, 1970– 1994. New Brunswick, NJ: Report 10 to CRESP.
Grimes, D., Fulton, G., Bonardelli, M. (1992) Evaluating Alternative Regional Planning Models.Growth and Change23:516–520.
Halliburton NUS, Inc. (1992)Socioeconomic Characteristics of Selected Counties and Com-munities Adjacent to the Savannah River Site, update of chapters 1–4. Aiken, SC: U.S. DOE.
Hooks, G., and Getz, V. (1996) Federal investments and economic stimulus at the end of the Cold War: The influence of federal installations on employment growth, 1970–1990. Paper presented at Rutgers University, December.
Lancaster, J. (1984) Aiken, S.C.—Town that Lives by the Bomb.Atlanta Constitution
Levy, F., and Murnane, R. (1997) With What Skills Are Computers a Complement?
American Economic Review86:258–262.
Mavrides, M. (1995) Housing Cools Off in Washington,New York TimesOctober 29:7, 33. Murnane, R., and Levy, F. (1996)Teaching the New Basic Skills: Principles for Educating
Children to Thrive in a Changing Economy. London: Free Press.
National Research Council (1995)Measuring and Improving Infrastructure Performance. Washington, DC: National Academy Press.
Office of Environment Management, U.S. Department of Energy. (1995a)Estimating the Cold War Mortgage.Springfield, VA: NTIS, DOE/EM-0230, 2 vols.
Office of Environment Management, U.S. Department of Energy. (1995b)Closing the Circle on Splitting the Atom. Washington, DC: U.S. DOE.
PH Fantus, Consultants. (1995) Economic Development Consulting Assistance, for Metro Augusta Chamber of Commerce and Economic Development Partnership, Augusta. Russell, M., Colglazier, E., and English, M. (1991)Hazardous Waste Remediation: The Task Ahead. Knoxville, TN: Waste Management Research and Evaluation Institute, University of Tennessee.
Russell, M. (1997) Toward a productive divorce: Separating DOE cleanups from transition assistance. Knoxville, TN: The Joint Institute for Energy and the Environment. Saunders, N. (1993) The U.S. Economy: Framework for BLS Projections.Monthly Labor
ReviewNovember: 11–30.
Schill, K. (1996) SRS Losses Mount.The Augusta ChronicleMarch 20:1.
Treyz, G. (1993)Regional Economic Modeling: A Systematic Approach to Economic Forecasting and Policy Analysis. Boston, MA: Kluwer Academic Publishers. U.S. Department of Energy (1995)Baseline Environmental Management Report.
Washing-ton, DC: U.S. Government Printing Office.
U.S. Department of Energy (1996)1996 Update, Baseline Environmental Management Report.Washington, DC: U.S. Government Printing Office.
U.S. Department of Energy (1997a)Linking Legacies. Washington, DC: U.S. Government Printing Office.
U.S. Department of Energy (1997b)Contractor Work Force Restructuring in the U.S. Department of Energy: Fiscal Year 1995 and 1996. Washington, DC: U.S. Govern-ment Printing Office. January.