Summary Data collected from four distinct canopy positions from each of 39 Abies balsamea (L.) Miller trees were used to construct models to describe the cumulative leaf area distribu-tion within the crown and to predict the needle mass of indi-vidual branches, the average branch angle, branch diameter, branch length, and crown radius per whorl, and the average number of living branches per whorl. We tested the hypotheses that regression models are equal among canopy positions and that a model to predict branch needle mass is valid at the northern and southern extremes of the central climatic zone of Maine. Canopy position had an effect on the models con-structed to predict needle mass, branch angle, branch diameter, branch length, crown radius, and the number of living branches per whorl. However, compared with an expanded model that incorporated parameters calculated for each crown class, there was only a small loss in model precision when a general model constructed from data pooled from all crown classes was used to predict needle mass, branch angle, and branch diameter. Regression equations unique to each crown class were needed to predict crown shape and leaf area distribution in the crown satisfactorily. Our branch needle mass model, which was con-structed from data collected at the southern extreme of the central climatic zone of Maine, consistently underestimated needle branch mass when applied to the northern extreme of the central climatic zone.
Keywords: balsam fir, branch angle, crown shape, foliage distribution, Maine, needle mass, projected leaf area.
Introduction
Morphological distinctions in the crown architecture of forest-grown trees are used as criteria in formulating silvicultural prescriptions during various stages of stand development (Smith 1986). In describing crown architecture, however, it is not practical to measure every branch on each tree. Thus, information from models that predict crown radius and needle mass for individual branches is used in the construction of other models that describe crown shape, vertical distribution of leaf area within the crown, and foliage/sapwood area relation-ships. Numerous model forms have been used to describe crown attributes. Although additional model forms can be conceived, it may be more useful to explore the applicability
of model forms that have been documented in previous studies of crown architecture and modify them as required. The aim of this study was to use the best model from published studies of crown architecture to construct regression equations that pre-dict the needle mass of individual branches, the average branch angle, branch diameter, branch length, and crown radius per whorl, and the average number of living branches per whorl, and to describe the cumulative leaf area distribution within the crown. We also tested the hypothesis that selected equations were equal among four distinct canopy positions for Abies balsamea (L.) Miller.
Materials and methods
Study area
Individual trees were selected from the University of Maine Dwight B. Demeritt Forest and the Penobscot Experimental Forest, both of which are within a 10-km radius of Orono (44°54′ N, 68°38′ W) and border the central and southern climatic zones of Maine (Briggs and Lemin 1992). Soils devel-oped on a parent material of glacial origin (Rourke et al. 1978) are variable, but are predominantly classified as coarse loamy, mixed, frigid, Aquic or Typic Haplorthods (Soil Survey Staff 1990), or Gleyed or Orthic Ferro-Humic Podzols (Canadian Soil Survey Committee 1978). Soil drainage class consistently bordered between poorly drained and moderately well drained (Maine Association of Professional Soil Scientists 1990). Abies--Picea stands were even aged, with A. balsamea being the primary species. Basal area ranged from 2 to 38 m2 ha−1; average quadratic diameter at breast height (dbh; measured at 1.3 m above the ground) ranged from 5.7 to 19.0 cm, and relative density (Curtis 1982) ranged from 4.6 to 11.3 (metric scale). Sites were rated intermediate in productivity (Briggs and Lemin 1994), with site index varying from 15 to 20 m at a breast height (bh) index age of 50 years (Steinman 1992). Data collection
Stem analysis data were collected from 39 A. balsamea trees having nearly symmetrical crowns characteristic of four crown classes (open-grown (OG), codominant (CD), intermediate (IT) and suppressed (SP), Tables 1 and 2) in July and August of 1992 and 1993, two or more weeks after bud set. Branch
Crown architecture of
Abies balsamea
from four canopy positions
DANIEL W. GILMORE
1and ROBERT S. SEYMOUR
21
Canadian Forest Products Limited, Postal Bag 100, Grande Prairie, Alberta T8V 3A3, Canada
2
Department of Forest Ecosystem Science, College of Natural Resources, Forestry and Agriculture, University of Maine, Orono, ME 04469-5755, USA
Received August 4, 1995
basal diameter (BDIA, cm), average branch length per whorl (BL, m), branch angle (BANG, degree), and depth in the crown (L, m) were measured for each branch (Figure 1), and the number of living branches per whorl (NBW) was counted for all whorls for each tree. The crown radius (CR, m) was deter-mined, and the base of the live crown (BLC, m) was defined as the lowest whorl having three living branches. All of the whorl branches from five open-grown and seven suppressed trees were sampled. For the remaining trees (four OG, ten CD, ten IT, three SP), one branch was randomly selected for sampling from the sixth whorl, as counted from the tree top down (Figure 1), from the BLC, and from the whorl midway between the sixth whorl and BLC. All sample branches were oven-dried at 65 °C for two days. Needles were separated, needles and branches were re-dried, and the oven-dry branch needle mass (BNM, g) was determined. The fresh mass for interwhorl branches was determined in the field and a composite sample of interwhorl branches collected from throughout the crown was oven-dried to obtain an oven-dry/fresh interwhorl mass ratio per tree. A needle/total branch mass ratio was calculated from the whorl branches sampled for each tree and used to estimate the needle mass of the interwhorl branches from their fresh mass. The average percentage (range in parentheses) of oven-dry foliage mass in interwhorl branches for each crown class was: OG 33% (12--67%); CD 33% (17--71%); IT 16% (0--24%); and SP 13% (0--35%). In an earlier study (Gilmore et al. 1995), we found that between-tree variation in specific leaf area (SLA, projected fresh leaf area per kg oven-dry foliage) was greater than within-tree variation in SLA, and demonstrated that the use of an average SLA per tree to
Table 2. Summary statistics for average branch attributes by crown class.
Variable1 Crown class
Open-grown Codominant Intermediate Suppressed
n Mean SE n Mean SE n Mean SE n Mean SE
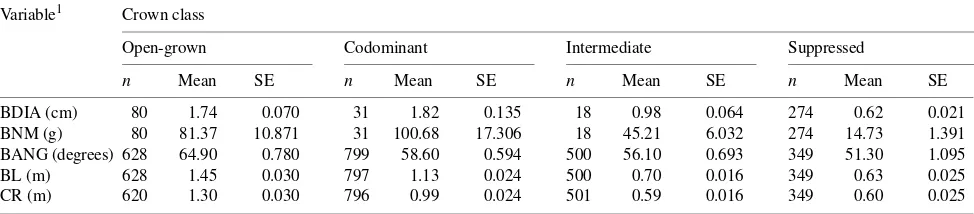
BDIA (cm) 80 1.74 0.070 31 1.82 0.135 18 0.98 0.064 274 0.62 0.021
BNM (g) 80 81.37 10.871 31 100.68 17.306 18 45.21 6.032 274 14.73 1.391 BANG (degrees) 628 64.90 0.780 799 58.60 0.594 500 56.10 0.693 349 51.30 1.095
BL (m) 628 1.45 0.030 797 1.13 0.024 500 0.70 0.016 349 0.63 0.025
CR (m) 620 1.30 0.030 796 0.99 0.024 501 0.59 0.016 349 0.60 0.025
1
Variables are: BDIA = branch basal diameter; BNM = branch needle mass; BANG = branch angle; BL = average branch length per whorl; CR = crown radius.
Table 1. Morphological characteristics of sample trees from each canopy position. Ranges of data are shown in parentheses.
Crown class n dbh1 (cm) Height (m) Total age (years) bh age1 (years) Live crown ratio (%)
Open-grown 9 15.2 (5.7--30.5) 9.3 (4.4--16.6) 53 (20--81) 27 (11--60) 85 (76--89) Codominant 10 20.2 (9.5--29.7) 16.6 (7.6--19.6) 592 (25--84) 47 (18--65) 47 (31--71) Intermediate 10 10.8 (5.3--14.5) 12.7 (7.2--16.0) 502 (22--79) 42 (18--62) 29 (16--43) Suppressed 10 6.2 (2.5--10.2) 7.6 (4.0--12.8) 422 (17--63) 33 (10--47) 21 (9--43)
1
Measured at 1.3 m.
2
Total age data not available for one tree because of decayed heartwood.
Figure 1. Schematic diagram of branch length (BLi) and crown radius
(CRi) predictor variables. H = tree height, Li = branch basal distance
determine the total projected leaf area of a tree was statistically valid. Therefore, an average SLA for each tree was calculated from two 10-needle samples collected from each of five foliage age classes (current-year, 1-year-old, 2-year-old, 3-year-old and 4-year-old-plus) for each randomly selected branch per tree.
To test the applicability of the BNM prediction model at the northern extreme of the central climatic zone of Maine, data were collected from 36 branches from 12 codominant A. bal-samea trees fom a 23-year-old fir--spruce stand in Bald Moun-tain Township, Maine during the third week of August 1993. The study site was located approximately 100 km northwest of Orono in the northern portion of the central climatic zone of Maine (Briggs and Lemin 1992) and is fully described else-where (Newton et al. 1989, 1992).
Model formulation
Several published model forms were screened in their original and mathematically modified forms to predict BNM, BANG, NBW, BDIA, BL, and crown radius (CR). Models to predict BL and CR were fit to the average measurements per whorl collected from the tree top down to the widest portion of the crown. Needle mass was predicted from BDIA for all whorls, and the needle mass for all interwhorl branches was estimated from the oven-dry/fresh interwhorl mass ratio for each tree. Mean branch diameters (cm, ± SE) used to predict needle mass for trees of each crown class were: OG 1.91 ± 0.033, CD 1.69 ± 0.024, IT 0.97 ± 0.015, and SP 0.63 ± 0.022. Total projected leaf area (TOTLA, m2) for each tree was calculated by multi-plying the average SLA for each tree by the total estimated needle mass per tree.
A cumulative distribution function was fit by nonlinear least squares regression to describe the relative leaf area distribution within the crown. For each tree, projected leaf area (PLA, m2) was summed for each of 10 equally spaced crown sections from the tree top down to the lowest living branch. According to our definition of live crown base, it was possible to have living branches below the BLC. The relative leaf area for each crown section (LAi/TOTLA, where i = crown section) was
obtained by dividing the leaf area per crown section by TOTLA per tree; therefore, the cumulative leaf area distribution for each tree was equal to one.
Model selection
Model selections were based on scatterplots of residuals versus predicted values in combination with a modified likelihood criterion that was equal to the root mean squared error from unweighted and untransformed equations, and to a rescaled root mean squared error from weighted and transformed equa-tions (Furnival 1961). Coefficients of determination (R2) were not used as selection criteria when transformations were per-formed on the dependent variables. Because an adjustment for logarithmic bias should be considered when applying results from logarithmically transformed models (Finney 1941, Snowdon 1991), the ratio estimator correction factor for loga-rithmic bias (Snowdon 1991) was applied to all estimates used
in subsequent analyses and in calculations of bias (bias = (observed − predicted)/n) in the original units of measure. Parameter estimation
Analysis of covariance (ANOCOVA, Zar 1984) was used to test the hypothesis that a general model applicable to each crown class would adequately describe a relationship. When warranted, regression with indicator variables (Neter et al. 1990) was used to construct an expanded equation applicable to each crown class. The completely expanded model can be thought of as a combination of four equations with the parame-ter estimates for the CD, IT, and SP crown classes depicting their respective differences from the OG class. The results of these analyses can be defined by two extremes. If canopy position had no effect on a model, a single equation would adequately describe the relationship. Conversely, a separate equation would be required for each crown class if pronounced differences for a given relationship existed among canopy positions. In this paper, only the parameter estimates in their reduced form are presented for the models having the best fit to describe a particular relationship. Parameter estimates, fit statistics for the completely expanded and intermediate mod-els, and an explicit statement of the hypotheses tested during the construction of the final models are provided in Gilmore (1995). All statistical analyses were done using SYSTAT (SYSTAT, Inc. 1992, Evanston, IL).
Results
The selected models, their parameter estimates, and their re-spective indices of fit are presented in Table 3. The models having best indices of fit, and thus best satisfying the assump-tion of least squares regression while accounting for differ-ences in scale (Furnival 1961) are marked with an asterisk.
Branch needle mass prediction
The selected BNM prediction model was a logarithmic trans-formation of a model presented by Ek (1979) (Table 3). We rejected the hypothesis (P < 0.001) that a common BNM prediction model could be used for all crown classes. However, comparison of the fit statistics for the general and expanded versions of this model revealed only a small sacrifice in overall precision for the general model compared with the expanded model (Table 4). Therefore, because of its simplicity, we re-commend Model 1 (Table 5) over the expanded model. Rela-tive to the upper canopy positions (OG and CD), bias for the modeling data was greatest for the prediction of needle mass of branches from IT trees and small branches from SP trees (Table 5, Figure 2a).
Branch angle prediction
We explored the use of the model presented by Colin and Houllier (1992) (Table 5), to predict BANG. Although we rejected the hypothesis that a general model adequately
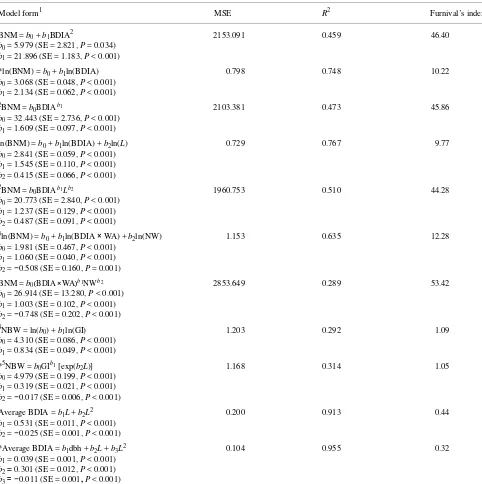
de-scribed the BANG relationship for each crown class, we pre-sent only a general model (Model 2) because, as a result of the variation in our data and the mathematical complexity of the model, we were not able to fit a model with indicator variables to obtain parameters for each crown class. Predicted values for Table 3. Models screened to predict branch needle mass, number of branches per whorl, and branch diameter. Standard errors and probability values of parameter estimates are shown in parentheses; selected models are marked with an asterisk.
Model form1 MSE R2 Furnival’s index
BNM = b0 + b1BDIA2 2153.091 0.459 46.40
b0 = 5.979 (SE = 2.821, P = 0.034)
b1 = 21.896 (SE = 1.183, P < 0.001)
*ln(BNM) = b0 + b1ln(BDIA) 0.798 0.748 10.22
b0 = 3.068 (SE = 0.048, P < 0.001)
b1 = 2.134 (SE = 0.062, P < 0.001) 2BNM = b
0BDIAb1 2103.381 0.473 45.86
b0 = 32.443 (SE = 2.736, P < 0.001)
b1 = 1.609 (SE = 0.097, P < 0.001)
ln(BNM) = b0 + b1ln(BDIA) + b2ln(L) 0.729 0.767 9.77
b0 = 2.841 (SE = 0.059, P < 0.001)
b1 = 1.545 (SE = 0.110, P < 0.001)
b2 = 0.415 (SE = 0.066, P < 0.001) 2BNM = b
0BDIAb1Lb2 1960.753 0.510 44.28
b0 = 20.773 (SE = 2.840, P < 0.001)
b1 = 1.237 (SE = 0.129, P < 0.001)
b2 = 0.487 (SE = 0.091, P < 0.001) 3ln(BNM) = b
0 + b1ln(BDIA × WA) + b2ln(NW) 1.153 0.635 12.28
b0 = 1.981 (SE = 0.467, P < 0.001)
b1 = 1.060 (SE = 0.040, P < 0.001)
b2 = −0.508 (SE = 0.160, P = 0.001)
BNM = b0(BDIA×WA)b1NWb2 2853.649 0.289 53.42
b0 = 26.914 (SE = 13.280, P < 0.001)
b1 = 1.003 (SE = 0.102, P < 0.001)
b2 = −0.748 (SE = 0.202, P < 0.001) 4
NBW = ln(b0) + b1ln(GI) 1.203 0.292 1.09
b0 = 4.310 (SE = 0.086, P < 0.001)
b1 = 0.834 (SE = 0.049, P < 0.001)
*5NBW = b0GIb1 [exp(b2L)] 1.168 0.314 1.05
b0 = 4.979 (SE = 0.199, P < 0.001)
b1 = 0.319 (SE = 0.021, P < 0.001)
b2 = −0.017 (SE = 0.006, P < 0.001)
Average BDIA = b1L + b2L2 0.200 0.913 0.44
b1 = 0.531 (SE = 0.011, P < 0.001)
b2 = −0.025 (SE = 0.001, P < 0.001)
*Average BDIA = b1dbh +b2L+b3L2 0.104 0.955 0.32
b1= 0.039 (SE = 0.001,P < 0.001)
b2 = 0.301 (SE = 0.012,P < 0.001)
b3 = −0.011 (SE = 0.001, P< 0.001)
1
BNM = branch needle mass (g), BDIA = branch basal diameter (cm), L = distance from branch base to tree top (m), H = total tree height (m), dbh = diameter at breast height (cm, measured at 1.3 m), WA = whorl age, NW = total number of whorls in the crown.
2 From Ek (1979). 3
From Kleinschmidt et al. (1980).
4 From Powell (1977). 5
BANG increased as branches aged and their mass increased with the accumulation of branchwood and needle mass (Ta-ble 5). Whorl age (WA, years) was the varia(Ta-ble with the highest correlation with BANG (r = 0.62, P < 0.001 and r = 0.63, P < 0.001 with average and maximum BANG, respectively). Other variables, such as dbh, depth into the crown (L), crown length (CL, m), tree height (H), whorl height and branch length (BL) had weak correlations (r < 0.48) with average or maxi-mum BANG, and when included in various forms of the model, their parameter estimates did not differ from zero.
Number of branches per whorl prediction
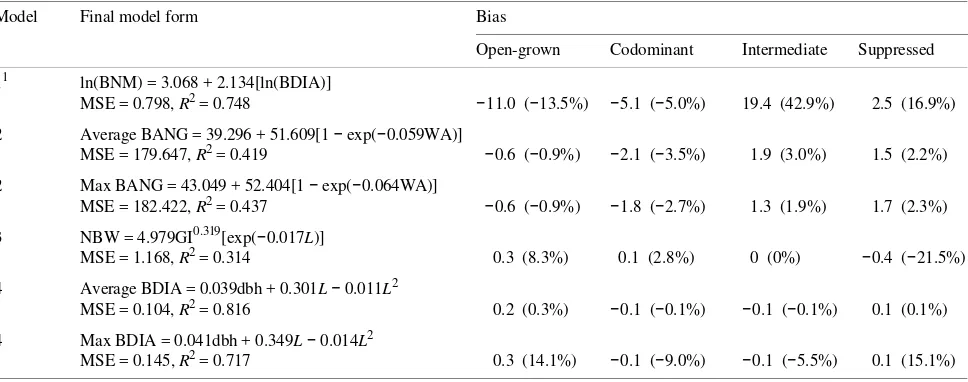
A variation of the model originally presented by Maguire et al. (1994) to predict NBW had the best index of fit (Table 3). Because the precision with which the model (Model 3, Ta-ble 5) predicted NBW was low (R2 = 0.314), we did not attempt to obtain parameter estimates for each crown class with indi-cator variables. The absolute bias for the general NBW predic-tion model for each crown class was also low, however, and bias expressed as a percentage of the mean was less than 10% for all but the SP crown class (Table 5). Additional condition-Table 5. Parameter estimates and bias (expressed as a percentage of the mean for each crown class in parenthesis) among crown classes for final models to predict branch needle mass (BNM), branch angle (BANG), the number of branches per whorl (NBW), and branch diameter (BDIA) for
Abies balsamea. Other abbreviations: WA = whorl age; and L = depth into the crown.
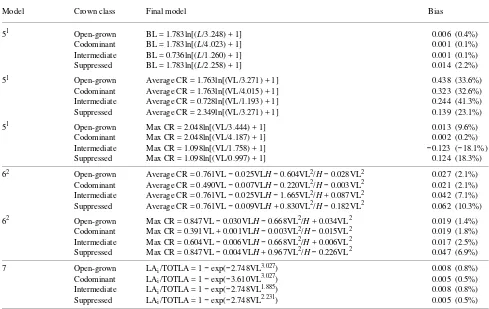
Model Final model form Bias
Open-grown Codominant Intermediate Suppressed
11 ln(BNM) = 3.068 + 2.134[ln(BDIA)]
MSE = 0.798, R2 = 0.748 −11.0 (−13.5%) −5.1 (−5.0%) 19.4 (42.9%) 2.5 (16.9%) 2 Average BANG = 39.296 + 51.609[1 − exp(−0.059WA)]
MSE = 179.647, R2 = 0.419 −0.6 (−0.9%) −2.1 (−3.5%) 1.9 (3.0%) 1.5 (2.2%) 2 Max BANG = 43.049 + 52.404[1 − exp(−0.064WA)]
MSE = 182.422, R2 = 0.437 −0.6 (−0.9%) −1.8 (−2.7%) 1.3 (1.9%) 1.7 (2.3%) 3 NBW = 4.979GI0.319[exp(−0.017L)]
MSE = 1.168, R2 = 0.314 0.3 (8.3%) 0.1 (2.8%) 0 (0%) −0.4 (−21.5%) 4 Average BDIA = 0.039dbh + 0.301L− 0.011L2
MSE = 0.104, R2 = 0.816 0.2 (0.3%) −0.1 (−0.1%) −0.1 (−0.1%) 0.1 (0.1%) 4 Max BDIA = 0.041dbh + 0.349L− 0.014L2
MSE = 0.145, R2 = 0.717 0.3 (14.1%) −0.1 (−9.0%) −0.1 (−5.5%) 0.1 (15.1%)
1
Ratio correction factor for logarithmic bias = 1.144.
Table 4. Comparison of fit statistics for general prediction models applied to the pooled data for each crown class and expanded models where parameters were calculated for each crown class. Abbreviations: BNM = branch needle mass; BANG = branch angle; BDIA = branch basal diameter; BL = average branch length per whorl; CR = crown radius; LA/TOTLA = crown section relative leaf area; GI = previous year height increment; dbh = diameter at breast height; L = depth in to the crown; VL as defined in Figure 1; and H = tree height.
Model Dependent Predictor General Expanded General Expanded
variable variables R2 R2 MSE MSE
1 BNM BDIA 0.7481 0.754 0.7981 0.799
2 BANG average Whorl age 0.419 na2 179.647 na2
2 BANG maximum Whorl age 0.437 na2 182.422 na2
3 NBW GI, L 0.314 na2 1.168 na2
4 BDIA average dbh, L 0.8161 0.819 0.1031 0.102
4 BDIA maximum dbh, L 0.7971 0.798 0.1451 0.144
53 BL L 0.831 0.8871 0.068 0.0461
53 CR average VL 0.811 0.8601 0.072 0.0541
53 CR maximum VL 0.826 0.8661 0.091 0.0641
64 CR average L, H 0.789 0.8751 0.069 0.0491
64 CR maximum L, H 0.795 0.8731 0.091 0.0611
7 LA/TOTLA VL 0.884 0.9111 0.015 0.0121
1
Denotes the form (general or expanded) of the model selected for presentation.
2
An expanded model was not fit with indicator variables for reasons discussed in text.
3
From Mitchell (1975) model form.
ing of the NBW prediction model with predictor variables to represent tree size parameters such as dbh, H, and CL did not improve precision.
Branch diameter prediction
We rejected the hypothesis (P < 0.001) that a common BDIA prediction model could be used for all crown classes. Because differences in fit statistics between the general and expanded models were minor (Table 4), we present the general model constructed from data pooled from all four canopy positions. The equations constructed to predict average and maximum BDIA from L and dbh had low bias among crown classes (Table 5).
Branch length and crown radius prediction
We rejected the hypotheses (P < 0.001) that a common BL or CR prediction model could be used for all crown classes. The expanded forms of the models of Mitchell ((1975), Model 5) and Honer ((1971), Model 6) to predict CR produced similar R2 values and MSEs (Table 4). A comparison of the models using the maximum CL (8 m) for a hypothetical open-grown tree (Figure 4) indicated that crown radius estimates obtained from Honer’s and Mitchell’s models were identical, but the bias of Honer’s model was less (Table 6). Each of these model
forms predicted crown radii within 0.5 m of those predicted with Honer’s (1971) original coefficients (Figure 4). Mitchell’s model ((1975), Model 5) is simpler, requiring only one inde-pendent variable, but CR will always be predicted to increase with increasing L because of the logarithmic transformation incorporated into the model (Figure 5a). Honer’s model ((1971), Model 6) is more complex, requiring two independent variables and the calculation of several interaction terms. Both model forms behave rationally when applied to values within the range of data from which they were constructed (Table 2, Figures 4 and 5).
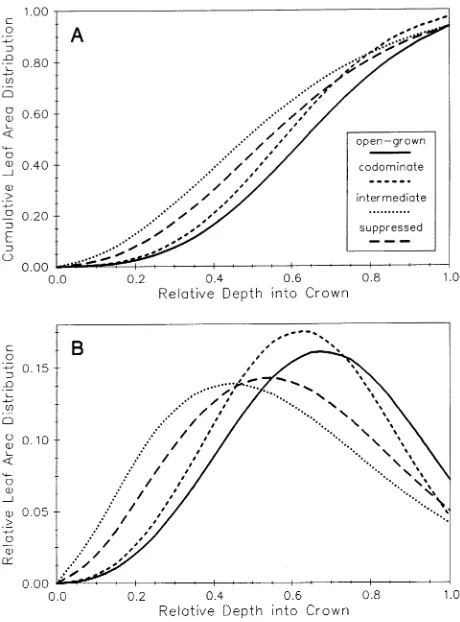
Leaf area distribution
We rejected the hypothesis (P < 0.001) that a common cumu-lative leaf area distribution model could be used for all crown classes (Table 6, Figure 6a). The cumulative leaf area distribu-tion for each tree was always one, but because there was considerable variation in the cumulative leaf area distribution at relative depths into the crown among trees, Model 7 never predicted a value of one for cumulative leaf area. To visualize the predicted relative leaf area distribution for each crown class, Figure 6b was constructed by predicting the cumulative leaf distribution with Model 7 (Table 6) and subtracting the predicted leaf area distribution in the upper crown sections from each progressively lower crown section. The leaf area distribution in the crown at the lowest living branch, as illus-trated by Figure 6b, could not be zero.
Discussion
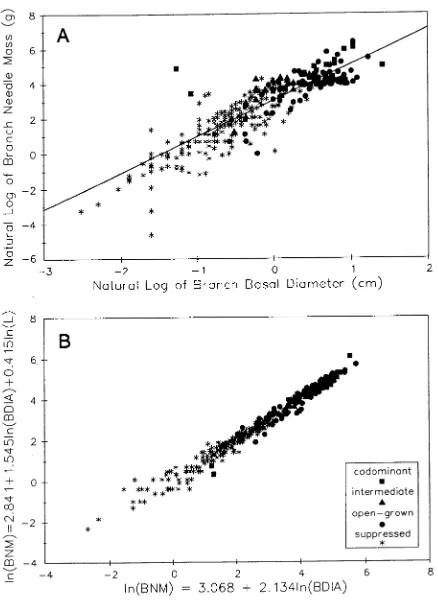
Several studies have suggested that the inclusion of depth in the crown (L) in a BNM prediction model improves precision (Ek 1979, Gillespie et al. 1994). We found that BDIA and L were highly correlated (r = 0.81, P < 0.001), and therefore, to avoid multicollinearity, L was not included in Model 1. A scatter plot of predicted values of ln(BNM) from Model 1 Figure 2. (A) Log-log plot of needle mass (BNM, g) versus branch
diameter (BDIA, cm) and the predictive function ln(BNM) = 3.068 + 2.134 ln(BDIA). (B) Estimates of ln(BNM) from Model 3 using ln(BDIA) as the sole predictor versus results from the model: ln(BNM) = 2.841 + 1.545 ln(BDIA) + 0.415 ln(L).
versus predicted values of ln(BNM) from a model incorporat-ing ln(BDIA) and ln(L) as predictor variables revealed that ln(L) has a minimal effect on predicted values. The greatest
divergence in predicted values between the two models was for small branches from the SP crown class (Figure 2b).
Many early branch-level biomass prediction models have not been tested with data collected outside of the geographic location from which they were constructed (Attiwill 1962, Loomis et al. 1966, Ek 1979). For A. balsamea, no differences in parameter estimates among data collection points were detected between New Brunswick, Canada and New Hamp-shire, USA during the construction of a branch-level biomass prediction model (Kleinschmidt et al. 1980). However, differ-ences in parameter estimates among research plantations were detected for branch-level biomass prediction models con-structed for Pseudotsuga menziesii (Mirb.) Franco (Kurz 1989), suggesting that branch-level biomass prediction models should be verified with independent data collected from out-side their region of construction. Our inability to validate Model 1 across a narrow latitudinal gradient contrasts with the results from a study of A. balsamea by Kleinschmidt et al. (1980) who concluded that their BNM prediction model was applicable in New Hampshire, USA and New Brunswick, Canada. However, when applied to our data, their model form had a poor fit relative to our BNM prediction model (Table 3). Kleinschmidt et al. (1980) did not sample trees from the
Table 6. Parameter estimates and bias (expressed as a percentage of the mean for each crown class in parenthesis) by crown class for the final models to predict branch length (BL) and crown radius (CR), and to describe the cumulative foliage distribution in Abies balsamea. Variable VL is as defined in Figure 1. Other variables: H = tree height; and LAi/TOTLA = relative leaf area for each crown section.
Model Crown class Final model Bias
51 Open-grown BL = 1.783ln[(L/3.248) + 1] 0.006 (0.4%)
Codominant BL = 1.783ln[(L/4.023) + 1] 0.001 (0.1%)
Intermediate BL = 0.736ln[(L/1.260) + 1] 0.001 (0.1%)
Suppressed BL = 1.783ln[(L/2.258) + 1] 0.014 (2.2%)
51 Open-grown Average CR = 1.763ln[(VL/3.271) + 1] 0.438 (33.6%)
Codominant Average CR = 1.763ln[(VL/4.015) + 1] 0.323 (32.6%) Intermediate Average CR = 0.728ln[(VL/1.193) + 1] 0.244 (41.3%) Suppressed Average CR = 2.349ln[(VL/3.271) + 1] 0.139 (23.1%)
51 Open-grown Max CR = 2.048ln[(VL/3.444) + 1] 0.013 (9.6%)
Codominant Max CR = 2.048ln[(VL/4.187) + 1] 0.002 (0.2%)
Intermediate Max CR = 1.098ln[(VL/1.758) + 1] −0.123 (−18.1%) Suppressed Max CR = 1.098ln[(VL/0.997) + 1] 0.124 (18.3%)
62 Open-grown Average CR = 0.761VL − 0.025VLH− 0.604VL2/H− 0.028VL2 0.027 (2.1%) Codominant Average CR = 0.490VL − 0.007VLH− 0.220VL2/H− 0.003VL2 0.021 (2.1%) Intermediate Average CR = 0.761VL − 0.025VLH− 1.665VL2/H + 0.087VL2 0.042 (7.1%) Suppressed Average CR = 0.761VL − 0.009VLH + 0.830VL2/H − 0.182VL2 0.062 (10.3%) 62 Open-grown Max CR = 0.847VL − 0.030VLH− 0.668VL2/H + 0.034VL2 0.019 (1.4%)
Codominant Max CR = 0.391VL + 0.001VLH− 0.003VL2/H− 0.015VL2 0.019 (1.8%) Intermediate Max CR = 0.604VL − 0.006VLH− 0.668VL2/H + 0.006VL2 0.017 (2.5%) Suppressed Max CR = 0.847VL − 0.004VLH + 0.967VL2/H− 0.226VL2 0.047 (6.9%) 7 Open-grown LAi/TOTLA = 1 − exp(−2.748VL3.027) 0.008 (0.8%)
Codominant LAi/TOTLA = 1 − exp(−3.610VL3.027) 0.005 (0.5%)
Intermediate LAi/TOTLA = 1 − exp(−2.748VL1.885) 0.008 (0.8%)
Suppressed LAi/TOTLA = 1 − exp(−2.748VL2.231) 0.005 (0.5%) 1
Model 5 = Mitchell (1975) model form.
2 Model 6 = Honer (1971) model form.
intermediate or suppressed crown classes. Kershaw (1993) found differences in a BNM model constructed for Tsuga heterophylla (Raf.) Sarg. among research plantations estab-lished in central Washington, USA and speculated that these differences were attributable to differences in needle mass of trees between regions. Herbicide trials (Newton et al. 1989, 1992) may have reduced competition enough to influence branch density (number of branches per unit crown length) in the trees used to test the applicability of our model to a different region. Additionally, site quality may have influenced the performance of the BNM prediction model outside of the study region. Potential site productivity for A. balsamea in Bald Mountain Township, Maine is less than that of our study area (R.D. Briggs, personal communication). Because of the poor performance of the BNM prediction model outside our study area, we conclude that branch-level biomass prediction models should be verified before widespread application.
Colin and Houllier (1992) had difficulties predicting BANG for plantation-grown Picea abies Karst., and suggested that unmeasured factors, such as site quality and genetics, may influence branch angle. Although we took care to sample trees from sites of comparable quality, sampling from a naturally regenerated population precludes control over genetic vari-ation among trees.
Maguire et al. (1994) included relative stand dbh as a pre-dictor variable in their original version of Model 3 to predict
NBW to account for social position. Crown class influenced Model 3, but parameter estimates for other variables (dbh, H) included in the model to represent tree size did not differ from zero. Previous-year height increments (GI, m) characteristic to each crown class may have contributed to our inability to expand Model 3 mathematically.
Large diameter trees were predicted to have greater BDIAs relative to small diameter trees. Inspection of the quadratic term for each Model 4 indicates that BDIA will eventually decrease with depth into the crown. This is consistent with results reported by Colin and Houllier (1992) and Maguire et al. (1994) for plantation-grown Picea abies and Pseudotsuga menziesii, respectively. Branch basal diameter (BDIA) growth in the lower portion of the crowns of forest-grown trees would be expected to slow as a result of increased mutual shading and as branches lose their vigor and the non-foliated lower portion of the crown becomes larger (Mitchell 1975, Jack and Long 1992). At the same time, branches in the upper portion of the crown would be expected to retain their vigor, and their accu-mulated BDIA growth would eventually be greater than that in the lower portions of the crown.
Leaf area of the understory crown classes was concentrated in the upper 45% of the crown (Figure 6b). Morphologically, this would increase the ability of understory trees (IT and SP) to produce photosynthate at the low irradiances that charac-terize their canopy position. Crowns of SP trees were also Figure 6. Predicted (A) cumulative and (B) relative leaf area distribu-tion within the crown of Abies balsamea by crown class.
found to be flat relative to other crown classes, with only small tufts of foliage on their lower branches (Figure 5) and most of their leaf area concentrated in the upper portion of the crown (Figure 6). In contrast, leaf area of trees in the OG and CD crown classes was concentrated in the lower 60% of the crown. By definition (Smith 1986), OG and CD trees have adequate growing space; therefore, one would expect older branches in the lower portion of the crown to have greater leaf area than younger branches higher in the crown. Crown shape morphol-ogy for each canopy position conformed to the Massart model of crown architecture (Hallé et al. 1978). Kohyama (1980) also observed patterns of crown architecture in OG and SP Abies mariesii Mast. saplings that conform to the Massart model.
Measures of crown geometry can be incorporated into so-phisticated growth and yield prediction models, such as The Tree and Stand Simulator (TASS, Mitchell 1975), that use crown size as a measure of competition, into ecosystem-based models, such as those derived from JABOWA (Botkin et al. 1972), and into nutrient cycling models (Kimmins 1988) that use a stratified leaf area distribution in the crown to model growth efficiency.
Acknowledgments
Financial support for this project was provided by a grant from the Maine Agricultural and Forest Experiment Station to R.S. Seymour and by the University of Maine Cooperative Forestry Research Unit. Appreciation is extended to Michael P. Auger, Kelley A. Brackley, Neil A. Brackley, Douglas S. Campbell, Anne L. Coyle, Michael E. Day, Christina Epperson, James Frohn, Stuart W. Gardner, Jason D. Moore, James T. Murray, Stephen W. Murray, Francine Natale, Andrew L. Rotch, Perry S. Sawyer, II, Brian D. Tift, David G. Ray, Dale R. Whitlock, and Kurt E. Zschau for field and laboratory assistance. Data from Bald Mountain Township were courtesy of Russell D. Briggs, Richard J. Dionne, Ronald C. Lemin, Jr., and Maxwell L. McCor-mack, Jr. This manuscript benefited from reviews by Russell D. Briggs, Marie R. Coyea, Michael S. Greenwood, William A. Halte-man, Douglas A. Maguire, and Alan S. White. Publication 2003 of the Maine Agricultural and Forest Experiment Station.
References
Attiwill, P.M. 1962. Estimating branch dry weight and leaf area from measurements of branch girth in Eucalyptus. For. Sci. 8:132--141. Botkin, D.B., J.F. Janak and J.R. Wallis. 1972. Some ecological
con-sequences of a computer model of forest growth. J. Ecol. 60:849--872.
Briggs, R.D. and R.C. Lemin, Jr. 1992. Delineation of climatic regions in Maine. Can. J. For. Res. 22:801--811.
Briggs, R.D. and R.C. Lemin, Jr. 1994. Soil drainage class effects on early response of balsam fir to precommercial thinning. Soil Sci. Soc. Am. J. 58:1231--1239.
Canadian Soil Survey Committee. 1978. The Canadian system of soil classification. Can. Dept. Agric., Ottawa, 164 p.
Colin, F. and F. Houllier. 1992. Branchiness of Norway spruce in northeastern France: predicting the main crown characteristics from usual tree measurements. Ann. Sci. For. 49:511--538.
Curtis, R.O. 1982. A simple index for stand density for Douglas-fir. For. Sci. 4:540--551.
Ek, A.R. 1979. A model for estimating branch weight and branch leaf weight in biomass studies. For. Sci. 25:303--306.
Finney, D.J. 1941. On the distribution of a variate whose logarithm is normally distributed. J. Roy. Stat. Soc. Suppl. VII:155--161. Furnival, G.M. 1961. An index for comparing equations used in
con-structing volume tables. For. Sci. 7:337--341.
Gillespie, A.R., H.L. Allen and J.M. Vose. 1994. Amount and vertical distribution of foliage of young loblolly pine trees as affected by canopy position and silvicultural treatment. Can. J. For. Res. 24:1337--1344.
Gilmore, D.W. 1995. Crown structure, stem form development, and foliage:sapwood area relationships for balsam fir in Central Maine. Ph.D. Diss., Univ. Maine, Orono, 137 p.
Gilmore, D.W., R.S. Seymour, W.A. Halteman and M.S. Greenwood. 1995. Canopy dynamics and the morphological development of
Abies balsamea: Effects of foliage age on specific leaf area and secondary vascular development. Tree Physiol. 15:47--55. Hallé, F., R.A.A. Oldeman and P.B. Tomlinson. 1978. Tropical forest
trees. Springer-Verlag, New York, 441 p.
Honer, T.G. 1971. Crown shape in open- and forest-grown balsam fir and black spruce. Can. J. For. Res. 1:203--207.
Jack, S.B. and J.N. Long. 1992. Forest production and the organization of foliage within crowns and canopies. For. Ecol. Manage. 49:233--245.
Kershaw, J.A. 1993. Crown structure and stem form development in young stands of western hemlock. Ph.D. Diss., Univ. Washington, Seattle, 241 p.
Kimmins, J.P. 1988. Community organization: methods of study and prediction of the productivity and yield of forest ecosystems. Can. J. Bot. 66:2654--2672.
Kleinschmidt, S., G.L. Baskerville and D.S. Solomon. 1980. Foliage weight distribution in the upper crown of balsam fir. USDA For. Serv. Res. Pap. NE-455, 9 p.
Kohyama, T. 1980. Growth patterns of Abies mariesii saplings under conditions of open-grown and suppression. Bot. Mag. Tokyo 93:13--24.
Kurz, W.A. 1989. Net primary production, production allocation, and foliage efficiency in second growth Douglas-fir stands with differ-ing site quality. Ph.D. Diss., Univ. British Columbia, Vancouver, 226 p.
Loomis, R.M., R.E. Phares and J.S. Crosby. 1966. Estimating foliage and branchwood quantities in shortleaf pine. For. Sci. 12:30--39. Maguire, D.A., M. Moeur and W.S. Bennett. 1994. Models for
de-scribing basal diameter and vertical distribution of primary branches in young Douglas-fir. For. Ecol. Manage. 63:23--55. Maine Association of Professional Soil Scientists. 1990. Guidelines
for Maine certified soil scientists for soil identification and map-ping, 2nd Edn. Maine Assoc. of Professional Soil Scientists, Orono, ME, 37 p.
Mitchell, K.J. 1975. Dynamics of simulated yield of Douglas-fir. For. Sci. Monogr. 17:1--39.
Neter, J., W. Wasserman and M.H. Kutner. 1990. Applied linear statis-tical models, 3rd Edn. Irwin, Homewood, IL, 1181 p.
Newton, M., E.C. Cole, R.A. Lautenschlager, D.E. White and M.L. McCormack, Jr. 1989. Browse availability after conifer release in Maine’s spruce--fir forests. J. Wildl. Manage. 53:643--649. Newton, M., E.C. Cole, D.E. White and M.L. McCormack, Jr. 1992.
Young spruce--fir forests released by herbicides. I. Response of hardwoods and shrubs. North. J. Appl. For. 9:126--130.
Powell, G.R. 1977. Patterns of development in Abies balsamea crowns and effects of megastrobilus production on shoots and buds. Can. J. For. Res. 7:498--509.
Smith, D.M. 1986. The practice of silviculture, 8th Edn. John Wiley, New York, 527 p.
Snowdon, P. 1991. A ratio estimator for bias correction in logarithmic regressions. Can. J. For. Res. 21:720--724.
Soil Survey Staff. 1990. Keys to soil taxonomy, 4th Edn. SMSS technical monograph No. 6., Blacksburg, VA, 422 p.
Steinman, J.R. 1992. A comprehensive evaluation of spruce-fir growth and yield in Maine as related to physical and chemical soil proper-ties. Ph.D. Diss., Univ. Maine, Orono, 124 p.