Validation of a Non-Specific Dye Real-Time PCR Assay
for Porcine Adulteration in Meatball Using ND5 Primer
Tri Joko Raharjo
*, Ery Nourika Alfiraza, Esti Enjelina, and Deni Pranowo
Department of Chemistry, Faculty of Mathematics and Natural Sciences, Universitas Gadjah Mada,Sekip Utara, PO BOX BLS 21, Yogyakarta 55281, Indonesia
Received March 1, 2017; Accepted April 5, 2017
ABSTRACT
Porcine adulteration in meatball samples were analyzed using real-time polymerase chain reaction (RT-PCR), based on the ND5 primer obtained by previous study. This work consisted of three stages which were annealing temperature optimization, method validation, and application. DNA template was extracted using phenol-CIAA (chloroform-iso amyl alcohol) method. The optimum annealing temperature for ND5 primers (forward primer 5'-CATTCGCCTCACTCACATTAACC-3' and reverse primer 5'-AAGAGAGAGTTCTACGGTCTGTAG-3') was 58.0 °C, obtained after testing annealing at 50.5 to 59.5 °C gradient temperature with 5 °C interval. Melting curve analysis was done at 65.0 to 95.0 °C, with increasing temperature for 0.5 °C per 2 sec. Method was validated for its specificity, precision and limit of detection. RT-PCR method with ND5 primers produced 227 bp DNA fragment with 78.50 °C Tm value. From eight commercial meatball samples, one was detected containing porcine. The methods showed high specificity and precision, with experimentally determined limits for porcine were no less than 1%.
Keywords:meatballs; porcine DNA; method validation; ND5 primer; real-time PCR
ABSTRAK
Telah dilakukan analisis kontaminasi babi pada bakso dengan real time polymerase chain reaction (RT-PCR) berdasarkan perbedaan urutan DNA mitokondria. Penelitian yang dilakukan meliputi 3 tahapan yakni optimasi, validasi, dan aplikasi metode, diawali dengan isolasi DNA menggunakan fenol-KIAA (kloroform-iso amil alkohol). Optimasi metode RT-PCR dilakukan dengan menguji gradien temperatur (50,5–59,5 °C) untuk memperoleh temperatur annealing (Ta) optimal dari primer ND5 forward (5’-CATTCGCCTCACTCACATTAACC-3’) dan primer ND5 reverse (5’-AAGAGAGAGTTCTACGGTCTGTAG-3’). Kondisi PCR yang digunakan berupa pre-denaturasi pada temperatur 95 °C selama 30 detik, denaturasi pada temperatur 95 °C selama 2 detik dan annealing pada Ta optimal selama 5 detik serta melting curve analysis pada temperatur 65,0–95,0 °C. Metode divalidasi dengan menentukan spesifisitas, presisi dan batas deteksi. Aplikasi metode dilakukan dengan menguji sampel produk bakso di pasaran. Hasil RT-PCR dengan primer ND5 berupa fragmen DNA dengan Tm (titik leleh) sebesar 78,5 °C dengan ukuran fragmen 227 pb. Ta optimal untuk PCR adalah 58,0 °C. Metode memiliki spesifisitas dan presisitas yang tinggi dimana primer ND5 hanya mengamplifikasi DNA babi dan tidak terbentuk amplikon pada kontrol negatif serta hasil yang konsisten setelah 10 kali pengulangan pada waktu isolasi yang berbeda untuk masing-masing kontrol positif dan negatif. Metode masih dapat mendeteksi sampai dengan 1% kontaminasi babi. Analisis RT-PCR terhadap 8 sampel bakso berhasil mendeteksi 1 sampel dari pasar tradisional yang positif terkontaminasi babi.
Kata Kunci:bakso; DNA babi; validasi metode; primer ND5; real-time PCR
INTRODUCTION
The increased awareness of consumers regarding the composition of foods has resulted in the need to verify the labelling statements. The incorrect labelling of foods represents a commercial fraud, considering the consumer acquisition. It is very important to establish that species of high commercial value are not substituted, partial or entirely, by other lower value species [1].
Meatball, or known as ‘bakso’ in Indonesia, is processed comminuted meat which can be classified as restructured meat and is very popular throughout the world. They can be formulated using beef, chicken, porcine, and fish muscle. However, the beef meatball is very popular and widely found in markets [5]. Substitution of beef in meatball formulations with lower valued meats such as porcine frequently takes place to coup up with market competition and also to earn economic gain [6].
The need for accurate and reliable methods for species identification in foods has increased steadily in the past few years [7]. Recently, a range of analytical approaches has been developed broadly based on detecting either protein or DNA molecules. Among the first, immunoassays are the most widely used techniques. The main advantages of the applied immunoassays are the good sensitivity along with a capability of a high sample throughput. A major problem seemed to be its limitation when trying to identify the species in highly processed foods since proteins are denaturated during heat-treatments, high pressures and other processing technologies [8]. For this reason, immunological analyses have been replaced by DNA-based methods. DNA has the advantage of being a relatively stable molecule, hence it is more able to withstand heat and pressure processing, and its sequence is conserved within all tissues of an individual [9].
The PCR amplification is based on the hybridization of specific oligonucleotides (primers) and synthesis, in vitro, of millions of copies flanked by those primers [10]. Conventional PCR has been succeeded to detect porcine contamination in meatball [11]. However the use of a real-time PCR approach is recommended for more accurate quantitative information and to increase specificity. The simplest, least expensive and most direct fluorescent system adapted to real-time PCR detection such as the SYBR Green has the advantage of being a more flexible method without the need for individual probe design. To verify the specificity of amplified products, DNA melting curves can distinguish false positive signals due to non-specific amplification or primer-dimers [12]. Real-time PCR based assays have previously been reported by some researcher for the identification of animal-derived material in meat mixtures by amplifying mtDNA genes as 12 S rRNA [15], cytochrome b gene [3,16-19,], ND2, ND5 and ATP 6-8 [20], and 18S rRNA [3].
From the above discussion, it is concluded that a reliable method is necessary for the precise results for the accurate identification of fraudulent practices in meat control systems. In this work, an SYBR green real-time PCR approach is proposed as a simple, fast, sensitive
and reliable method for porcine meat detection. The method was validated and subsequently applied to detecting the presence of porcine meat in meatball products available commercially.
EXPERIMENTAL SECTION
Materials
Materials used in this study were: ingredients needed to make meatball such as porcine meat, tapioca, eggs, salt, pepper and garlic, all from Yogyakarta local market. Commercially meatball sample was collected from the supermarket and local market (halal-labeled and non-labeled). Chemicals used were Tris base (Sigma-Aldrich), ethidium bromide (Sigma-Aldrich), hydrochloric acid (Merck), ethylenediaminetetraacetic acid (Merck), sodium dodecyl sulphate (Merck), sodium chloride (Merck), phenol (Merck), chloroform (Merck), isoamyl alcohol (Merck), 2-propanol (Merck), ethanol absolute (Merck), proteinase-K (Invitrogen), DNA marker 100 bp (Invitrogen), SsoFast EvaGreenTM Supermix (Bio-Rad), agarose (Spain), loading buffer (Vivantis), primer forward ND5: 5’-CAT TCG CCT CAC TCA CAT TAA CC-3’ and primer reverse ND5: 5’-AAG AGA GAG TTC TAC GGT CTG TAG-3’ (1st BASE), sterile aquabidest (LPPT-UGM), DNAse and RNAse free water (Gibco TM).
Instrumentation
Instruments used in this study were: RT-PCR CFX96 (Bio-Rad), spectrophotometer UV-1700 (1024E) 230VCE (Shimadzu), Sorvall Legend Micro 17R centrifugation (Thermo Scientific), electrophoresis [Bio-Rad (Wide minisub[p] cell GT)], digital balance (Denver AA-250), micropipettes (Gilson), UV light (Bio-Rad), water bath (OSK Seiwa Reiko), vortex (Termplyne), Incubator EM-200T (Sakura), microwave (Sanyo), and digital camera (Kodak easyshare Z650).
Procedure
Samples preparation
Table 1.Reference meatball sample used for this study
Sample Porcine meat (g) Cattle meat (g) Total weight (g)
Porcine meatball 0% 0 100 100
Porcine meatball 1% 1 99 100
Porcine meatball 10% 10 90 100
Porcine meatball 100% 100 0 100
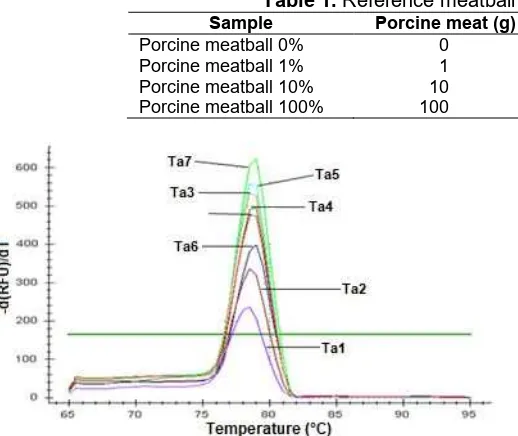
Fig 1.Melting curve analysis for Ta optimization
DNA extraction
DNA was extracted using the phenol-CIAA (chloroform-iso amyl alcohol) method. Briefly, 200 mg of ground sample was mixed with 2 mL buffer lysis. The mixture was then transferred to a microtube, followed by addition of 30 µL proteinase-K. After incubation in water bath at 37 °C for 24 h, the suspension was vortexes for 2 min and transferred into a new microtube. Phenol-CIAA was added to the suspension with the same volume (1:1) and mixed by shaker at 80 rpm for 30 min. Separation was performed by centrifuge (5 min, 12000 rpm, 4 °C) and supernatant was mixed with phenol-CIAA with the same volume as supernatant (1:1) for 5 min. The mixture was centrifuged again (5 min, 12000 rpm, 4 °C) and 500 µL of supernatant was precipitated with the addition of 500 µL 2-propanol (1:1) followed by incubation at -20 °C for 30 min. Extracted DNA was separated by centrifugation (5 min, 12000 rpm, 4 °C), the pellet was collected and washed with 500 µL ethanol 70% and centrifugation (5 min, 12000 rpm, 4 °C). After disposing the ethanol and drying the extracted DNA, extracted DNA was mixed with 30 µL tris-EDTA to a new microtube. This suspension was stored at -20 °C for further use. The quality of extracted DNA was analyzed by electrophoresis on a 1% agarose gel in TBE buffer 0.5x for 30 min at 50 V. The agarose gel was visualized under UV light, and a digital image was obtained using a digital camera.
DNA quantification
Extracted DNA was quantified by spectrophotometer UV-Vis. The DNA concentration was determined by absorbance at 260 nm (1 absorbance unit
correspond to 50 ng/µL of dsDNA) [21]. The purity of the extract was evaluated based on the ratio of the absorbance at 260 and 280 nm, and values between 1.7 and 2.0 were obtained [22].
Real-time PCR optimization
Annealing Temperature (Ta) Optimization for real-time PCR was carried out in 20 µL containing 10 μL SsoFast EvaGreenTM supermix, 1 μL primer forward ND5, 1 μL primer reverse ND5, 50 ng DNA sample (reference meatball sample containing porcine meat) and DNAse and RNAse free water. The real-time PCR assays were performed using following condition: 95 °C for 30 sec (predenaturation), 35 cycles of denaturation at 95 °C for 2 sec and annealing at various temperature (50.5; 51.1; 52.3; 54.0; 56.2; 58.0; 59.0; and 59.5 °C). For melting curve analysis, the temperature was increased by 0.5 °C per 2 sec from 65.0 to 95.0 °C.
Detection of porcine meat using real-time PCR Amplification by real-time PCR were carried out in 20 µL total reaction volume containing 10 μL SsoFast EvaGreenTM supermix, 1 μL primer forward ND5, 1 μL primer reverse ND5, 50 ng DNA sample and DNAse and RNAse free water using following condition: 95 °C for 30 sec (predenaturation), 35 cycles of denaturation at 95 °C for 2 sec and annealing at optimal temperature. For melting curve analysis, the temperature was increased by 0.5 °C/2 sec from 65.0 to 95.0 °C. Amplified fragments were analyzed using electrophoresis on a 2.0% agarose gel with the addition of 4 μL ethidium bromide in TBE buffer for 30 min at 100 V. The result was visualized under UV light, and a digital image was obtained using a digital camera.
Validation method of real-time PCR
temperature was increased by 0.5 °C/2 sec from 65.0 to 95.0 °C. The amplified fragments were analyzed by electrophoresis in a 2.0% agarose gel with addition of 4 μL ethidium bromide in TBE buffer for 30 min at 100 V. Agarose gel was visualized under UV light and a digital image was obtained using a digital camera.
Precision test. Precision test was performed by repetition of detection method for 10 positive controls and 10 negative controls. Every repetition held in different time for contamination prevention.
Limit of detection determination. Limit of detection (LOD) determination was performed with various porcine contamination in meatballs: 0%, 1%, and 10% (w/w%). Each was treated with the same detection method in the same time.
Application. The validated method was applied to the various commercial meatball samples. Eight meatball samples were picked randomly, 4 samples from the supermarket (halal labeled), and 4 samples from traditional market (non-labeled).
RESULT AND DISCUSSION
Real-time PCR Optimization
The ND5 mitochondrial gene was chosen as a target for porcine DNA detection because PCR assays based on mitochondrial genes show improved sensitivity when compared to single or low copy nuclear DNA targets. The primers used in this study are primer forward ND5: 5’-CAT TCG CCT CAC TCA CAT TAA CC-3’ and primer reverse ND5: 5’-AAG AGA GAG TTC TAC GGT CTG TAG-3’ obtained from previous study by Kesmen et al. [23].
Optimization methods were performed to determine the optimum annealing temperature (Ta). A total of 8 positive control samples containing porcine DNA (porcine meatball 100%) were used for Ta optimization with various Ta ranged from 50.5 to 59.5 °C. Based on the results of the optimization Ta amplification curves (Table 2), the overall positive controls that were tested yielded varies cycle number threshold (Ct) between 17.71 to 19.62 as presented in Table 2. Highest relative fluorescence units (RFU) were shown for Ta 51.1 °C. ND5 mitochondrial DNA primers has melting point at 60.6 °C and 61.0 °C for the forward and reverse primer, respectively. Consider this fact, the optimum annealing temperature should be about 55.6 °C. Therefore, instead of Ta 51.1 °C, the Ta used for this study was 58.0 °C, because it produced low Ct, high RFU and could prevent primer mispriming due to low Ta (Table 2).
Further analysis were done by heating the PCR amplicon at the end of the reaction by raising the temperature from 65.0 °C to 95.0 °C to melt the double-stranded DNA into a single strand, and the difference in
Table 2. Ct and RFU value for various annealing temperature
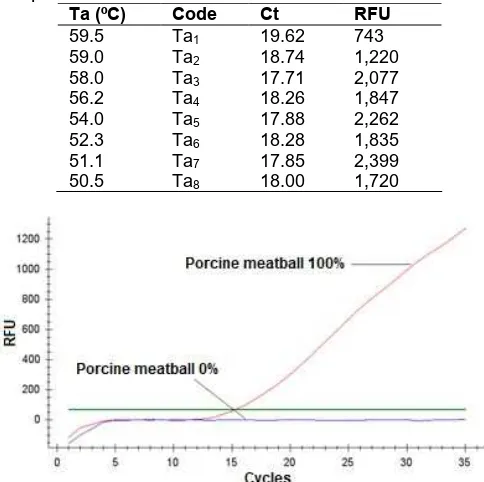
Fig 2.Amplification pattern for specificity test: positive control (red line), negative control (blue line) and threshold (green line)
the fluorescence signal was measured. At the melting point, the two strands of DNA amplification product were separated and intensity of fluorescence decreased significantly. Melting curve analysis (MCA) describes the rate of change of the RFU as the first negative derivatization of fluorescent signal versus time divided by temperature (T) (d(RFU)/dT). Positive controls containing porcine DNA with different Ta showed similar curves which rose above the threshold 182.51 with melting temperature (Tm) at 78.5 °C and 79.0 °C (Fig. 2). Tm is the temperature at which 50% of the DNA amplicon is in a double-stranded configuration. The Tm depends on various factors including the amplicon length and the nucleotide sequence, which is specific for each amplicon [24]. From Kesmen et al. [25], 78.5 °C is known as the Tm of PCR products of ND5 primers. With this method, a sample was declared containing porcine DNA when the analysis in the porcine specific RT-PCR system with ND5 primer produced an amplification product with melting temperature 78.5 °C, corresponds to sequence-specific hybridization between the primers and the homologous porcine DNA sequence.
Table 3.RT-PCR result for sample C1-C4
Sample Code Ct RFU Melting
point (ºC)
Peak height
Traditional market meatball 1 C1 - -17.1 -
-Traditional market meatball 2 C2 34.94 21.1 -
-Traditional market meatball 3 C3 - -8.95 -
-Traditional market meatball 4 C4 25.35 750 78.5 353.45
Porcine meatball 100% + 16.19 2,037 78.5 589.45
Porcine meatball 0% - - -6.79 -
-Fig 3. Specificity test electroforegram: positive control (P), DNA marker 100 bp (M), and negative control (N)
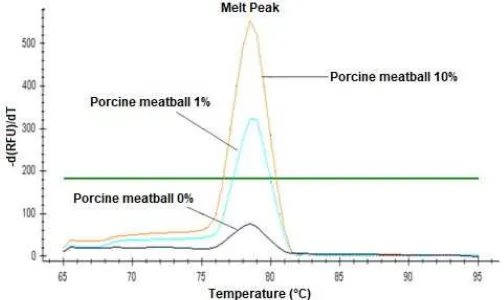
Fig 4. Melting curve analysis for LOD determination: porcine meatball 10% (orange line), porcine meatball 1% (blue line), porcine meatball 0% (purple line) and threshold (green line)
specific amplicon produced by amplification with ND5 primers.
Assay Validation
Specificity test
Assay specificity of developed RT-PCR was confirmed when amplification in the sample containing no porcine in the same matrix was not detected. To demonstrate specificity, positive (100% porcine meat)
and negative control (100% cattle meat) were compared in this test.
From Fig. 2, positive control showed the increasing amount of the RFU above the threshold line, indicating the occurrence of the amplification process, while negative control produced no amplification. The positive control showed a peak above the threshold 106.10 for MCA, had Tm value 78.5 °C and produced a 227 bp band on electroforegram (Fig. 3), while the negative control did not produce any peak for MCA and did not produce any band on electroforegram (Fig. 3).
Precision test
The precision test was aimed to evaluate the influence of analysis time with the result. All of the detection methods were done for ten positive controls and ten negative controls at different time. All of the positive controls extracted at different times showed a uniform curve above the 51.14 threshold and give Ct values varying between 13.63 to 23.52 with a total value of amplicon between 456 to 2309. The standard deviation (SD) of the positive controls precision test was 2.87 with 18.07% relative standard deviation (RSD). The RSD value meet the criteria for pression of RT-PCR method which should not exceed 25% [26] Further analysis by MCA gave the same result with melting point at 78.5 °C. All of the positive controls showed amplification, although the peak heights were varying between 289.73 to 709.92. According to the analysis of DNA fragments by electrophoresis, all of the amplicons for positive controls also showed uniform clear 227 bp band.
For the negative controls, RFU showed a line below the threshold 139.13, therefore the negative controls did not have a Ct value with a relatively low RFU. Same result also given from the MCA and electrophoresis analysis, which all of the negative controls did not produce any peak and any band. This result implicated that this method has a great precision.
LOD determination
Fig 5. Amplification pattern for samples purchased from traditional market
Fig 6. Melting curve analysis for meatball samples purchased from traditional market
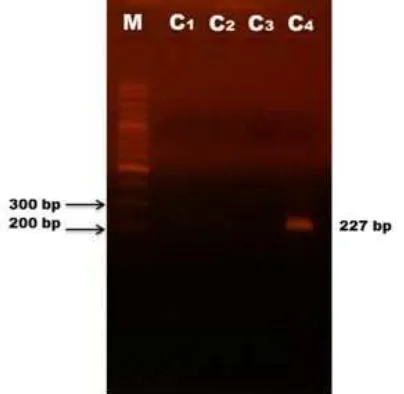
Fig 7. Electroforegram: DNA marker 100 bp (M), meatball samples from traditional market (C1-C4)
porcine meatballs were all amplified with Ct value 25.48 and 21.52, respectively. MCA also showed peaks above the threshold 183.35 with the Tm value of 78.5 °C, with peak height 324.11 for 1% porcine meatball and 554.34 for 10% porcine meatball (Fig. 4). Same result was shown by electroforegram, in which 1% porcine meatball and 10% porcine meatball produced a 227 bp band, while negative control did not produce any. According to these result, the RT-PCR with ND5 primers method proved to be a sensitive method, which could detect no less than 1% porcine contamination.
Detection of porcine meat using real-time PCR
The optimized PCR conditions were subsequently applied to the commercial samples to detectify the presence of porcine meat and the compliance with label statements. Analysis of the samples meatballs from supermarket brand A (SA), brand B (SB), brand C (SC) and brand D (SD) were detected by RT-PCR
amplification showed no increase in the curve with a low Ct value and RFU intensity, while the positive control showed a rose of the curve above the threshold 67.46 with Ct value 24.12 and RFU 1122. For MCA, no peak was produced by all four. These result indicated that no amplification were achieved with all four samples. This result was also confirmed by electrophoresis analysis. Compared with DNA marker 100 bp, all of the DNA samples did not show any band. Therefore, all supermarket brand samples were not contain porcine.
Furthermore, the test was also done for unlabelled samples from traditional market (sample C1-C4). Based on Fig. 5, the positive control showed a rise above threshold line at 72.94, with Ct value 16.19 and RFU 2037, respectively. Sample with code C1, C2, and C3 did not produce amplicon, while sample C4 did, with Ct value 25.35 and RFU value 750. This result was also confirmed by MCA (Fig. 6) which sample C4 showed a peak at Tm 78.5 °C and electrophoresis analysis (Fig. 7). This result implied that from the eight tested samples, one sample was positive containing porcine meat. Porcine DNA was not detected in all of halal labeled samples.
CONCLUSION
bodied and quality control for food labelling or Halal verification and certification.
ACKNOWLEDGEMENT
The authors wish to express their gratitude to the help of Mrs. Istini and Mr. Radjiman for sample preparation at LPPT-UGM, Yogyakarta Indonesia.
REFERENCES
[1] EUR-Lex-32003L0089, 2003, Directive 2003/89/EC of the European Parliament and of the Council of 10 November 2003 amending Directive 2000/13/EC as regards indication of the ingredients present in foodstuffs,OVJ Eur. Union L 308, 15–18.
[2] Cheftel, J.C., 2005, Food and nutrition labelling in the European Union,Food Chem., 93 (3), 531–550. [3] Soares, S., Amaral, J.S., Oliveira, M.B., and Mafra,
I., 2013, A SYBR Green real-time PCR assay to detect and quantify porcine meat in processed poultry meat products,Meat Sci., 94 (1), 115–120. [4] Mafra, I., Ferreira, I.M.P.L.V.O., and Oliveira,
M.B.P.P., 2008, Food authentication by PCR-based methods, Eur. Food Res. Technol., 227 (3), 649–665.
[5] Rohman, A., Sismindari, Erwanto, Y., and Che Man, Y.B., 2011, Analysis of porcine adulteration in beef meatball using fourier transform infrared (FTIR) spectroscopy,Meat Sci., 88 (1), 91–95.
[6] Ali, M.E., Hashim, U., Mustafa, S., and Che Man, Y.B., 2011, Swine-specific PCR-RFLP assay targeting mitochondrial cytochrome b gene for semiquantitative detection of porcine in commercial meat products, Food Anal. Methods, 5 (3), 613–623.
[7] Teletchea, F., Maudet, C., and Hänni, C., 2005, Food and forensic molecular identification: Update and challenges, Trends Biotechnol., 23 (7), 359–366.
[8] Chen, F.C., Hsieh, Y.H.P., and Bridgman, R.C., 2004, Monoclonal antibody-based sandwich enzyme-linked immunosorbent assay for sensitive detection of prohibited ruminant proteins in feedstuffs,J. Food Prot., 67 (3), 544–549.
[9] Lanzilao, I., Burgalassi, F., Fancelli, S., Settimelli, M., and Fani, R., 2005, Polymerase chain reaction-restriction fragment length polymorphism of mitochondrial cytb gene from species of dairy interest,J. AOAC Int., 88 (1), 128–135.
[10] Fajardo, V., González, I., Martín, I., Rojas, M., Hernández, P.E., García, T., and Martín, R., 2008, Differentiation of European wild boar (Sus scrofa scrofa) and domestic swine (Sus scrofa domestica) meats by PCR analysis targeting the mitochondrial
D-loop and the nuclear melanocortin receptor 1 (MC1R) genes,Meat Sci., 78 (3), 314–322.
[11] Raharjo, T.J., Cahyaningtyas, W., Surajiman, Istini, and Pranowo, D., 2012, Document validation of PCR-RFLP testing method to detect porcine contamination in chicken nugget, Indones. J. Chem., 12 (3), 302–307.
[12] Farrokhi, R., and Joozani, R.J., 2011, Identification of porcine genome in commercial meat extracts for Halal authentication by SYBR green I real-time PCR,Int. J. Food Sci. Technol., 46 (5), 951–955. [13] Maryam, S., Sismindari, S., Raharjo, T.J., Sudjadi,
and Rohman, A., 2016, Determination of porcine contamination in laboratory prepared dendeng using mitochondrial D-Loop686 and cyt b gene primers by real time polymerase chain reaction source of the document international, J. Food Prop., 19 (1), 187–195.
[14] Rahmawati, Sismindari, Raharjo, T.J., Sudjadi, and Rohman, A., 2016, Analysis of pork contamination in Abon using mitochondrial D-Loop22 primers using real time polymerase chain reaction method, Int. Food Res. J., 23 (1), 370–374.
[15] Terzi, V., Infascelli, F., Tudisco, R., Russo, G., Stanca, A.M., and Faccioli, P., 2004, Quantitative detection of Secale cereale by real-time PCR amplification, LWT Food Sci. Technol., 37 (2), 239–246.
[16] Rodriguez, M.A., García, T., González, I., Hernández, P.E., and Martín, R., 2005, TaqMan real-time PCR for detection and quantitation of porcine in meat mixtures, Meat Sci., 70 (1), 113–120.
[17] Ali, M.E., Kashif, M., Uddin, K., Hashim, U., Mustafa, S., and Che Man, Y.B., 2012, Species authentication methods in foods and feeds: the present, past, and future of halal forensics, Food Anal. Methods, 5 (5), 935–955.
[18] Chisholm, J., Conyers, C., Booth, C., Lawley, W., and Hird, H., 2005, The detection of horse and donkey using real-time PCR, Meat Sci., 70 (4), 727–732.
[19] Dooley, J.J., Paine, K.E., Garrett, S.D., and Brown, H.M., 2004, Detection of meat species using TaqMan real-time PCR assays, Meat Sci., 68 (3), 431–438.
[20] Hird, H., Chisholm, J., and Brown, J., 2005, The detection of commercial duck species in food using a single probe-multiple species-specific primer real-time PCR assay, Eur. Food Res. Technol., 221 (3), 559–563.
Harbor, New York, Cold Spring Harbor Laboratory Press.
[22] Glasel, J.A., 1995, Validity of nucleic acid purities monitored by 260 nm/280 nm absorbance ratios, Biotechniques, 18 (1), 62–63.
[23] Kesmen, Z., Gulluce, A., Sahin, F., and Yetim, H., 2009, Identification of meat species by TaqMan-based real-time PCR assay, Meat Sci., 82 (4), 444–449.
[24] Martín, I., García, T., Fajardo, V., Rojas, M., Pegels, N., Hernández, P.E., and Martín, R, 2009, SYBR-green real-time PCR approach for the detection and
quantification of porcine DNA in feedstuffs, Meat Sci., 82 (2), 252–259.
[25] Kesmen, Z., Yetim, H., and Şahin, F., 2010, Identification of different meat species used in sucuk production by PCR assay, GIDA, 35 (2), 81–87.