DETERMINATION OF LEVEL OF FOOD ADDITIVES IN Labisia pumila (LP)
BEVERAGES CONSUMED IN KUANTAN, MALAYSIA
Ade Chandra Iwansyah
1, Mashitah Mohammad Yusoff
2, Faridah Kormin
31Center for Appropriate Technology Development, Indonesian Institute of Sciences, Jl. K. S. Aipda Tubun No.5 Subang 41213,
West Java, Indonesia
2Faculty of Industrial Sciences and Technology, University Malaysia Pahang, Jl. Lebuhraya Tun Razak, Gambang 26300,
Pahang-Malaysia
3Department of Research and Innovation, University Malaysia Pahang, Gambang, 26300, Pahang, Malaysia
Email: [email protected] or [email protected]
ABSTRACT
The content levels of several food additives (gallic acid, benzoic acid and caffeine) in commercial Labisia pumila (LP) beverage samples in Kuantan, Malaysia were determined by high performances liquid chromatography (HPLC). These analytical measurements were undertaken primarily to assess the compliance of content levels of the investigated food additives and their daily intake doses with permissible levels. The results obtained from this study indicated that the average levels of GA, caffeine and benzoic acid in the analyzed beverages were 37.62-229.35 ppm, 43.46 -168.00 ppm and 98.10-241.13 ppm, respectively. In addition, the concentrations of these food additives have been converted into daily intake doses based on beverage consumption. It was estimated that the mean daily intake of GA, caffeine and benzoic acid by the adult population of Kuantan through the consumption of the analyzed beverages were 0.39 mg/ kg body weight/day for GA, 0.59 mg/kg body weight/day for caffeine (19.6 % ADI) and 0.43 mg/kg body weight/day for benzoic acid (8.6%ADI). None of the analyzed beverage sample was found to violate the current legal limits as stipulated in Malaysian food regulation.
Keywords: beverages, daily intake, food additives, Labisia pumila
INTRODUCTION
Food additives play a vital role in modern food industry, and are generally used for maintaining food quality and its characteristics as well as promoting food safety. Since the consumption of soft drinks and beverages is a widespread habitt all aroun the world, hence such food products are considered of great importance, economically and socially.
Benzoates one of food additives and preservatives most often used for beverages such as soft drink (Wen, Wang and Feng, 2007). Benzoic acid inhibits bacterial development and preservative against molds and yeasts (Dong and Wang, 2006). These preservatives are allowed by legislation that establishes the maximum permitted concentration in each type of food. However, their presence at levels higher than permitted safety levels can be harmful to human health, such as metabolic acidosis, convulsions, hyperpnoea, allergic reaction in experimental animals and in human are described (Wen, Wang and Feng, 2007).
Caffeine, a trimethylated xanthine, is added as fl avour agent, to approximately 70% of soft drinks (Pena, Lino and Silveira, 2005). Nawrot et al. (2003), moderate amounts of caffeine are not harmful to human health, the possibility that caffeine consumption can have adverse effects on human health was assesed based on results of published human studies.
Gallic acid is a trihydroxybenzoic acid, an organic acid also known as 3,4,5-trihydroxybenzoic acid, found in tea leaves and other plants. Gallic acid is commonly used as antioxidant additives in both food and pharmaceutical industries. According Yusoff and Wan Mohamud (2011), reported that aqueous extract of L.pumila var. alata contained gallic acid. LP or “Kacip fatimah” became a popular supplement in the Malaysian functional food and beverage market.
techniques for determination of food additives in various food products can be found in literature with the most popular being liquid chromatography (HPLC) methods. Unfortunately, there are relatively few sources of published analytical information concerning the determination of the content levels of these food additives in food products consumed in Malaysia. No doubt, with the analytical data generated by this study about content levels of food additives in consumed beverages, we hope to assess the food safety status for food products consumed by a small population in Kuantan. The aim of research are to assess the compliance of the concentration levels of some food additives in various LP commercial beverage avalaible in Kuantan and to estimate the daily intake (EDI) of these food additives.
The rest of this paper is organized as follow. Section 2 describes material and methods of this study which consist of preparation and determination of GA in lyophilized plant extract, preparation of analytes, validation method and estimated dietary intake (EDI) of food additives. Section 3 describes results and discussion of determination of GA, caffeine and benzoic acid in LP beverage consumed and its estimated daily intake (EDI). Finally the conclusion of this study is described section 4.
MATERIAL AND METHODS
Material
Fresh Labisia pumila var.alata leaves were collected from Raub, Pahang (LPR). LPC was commercial product ingredient obtained from a manufacturer in Kuala Lumpur, Malaysia. Available samples of LP beverage (eight sample), include four beverages in can packaging (SPKF, OKKF, PKOKF and PKKF) and four in powder form (NESKF, DEKF, SPPKF, and KCKF) were taken by purposive sampling method in Kuantan, Malaysia. For chemical materials, gallic acid (GA); caffeine, and benzoic acid were purchased from Sigma-Aldrich. Reagents were of analytical grade. HPLC grade acetonitrile, H3PO3, acetic acid and methanol were used for high performance liquid chromatography and purchased from Merck, Germany. Liquid chromatography grade (LC) solvents were fi ltered and degassed prior to use
Methods
Preparation of freeze-dried extract and quantifi cation GA in raw material. LP leaves were rinsed to remove debris, dried at 40oC for 3 days and ground into small pieces. After
soaking in ultrapure water (1:6) overnight, it was extracted for 6 hours (twice) by Soxhlet. The fi ltrates were consolidated and lyophilized in a freeze dryer. For analysis, 0.06 g of
freeze dried material was weighed into a centrifuge tube, to which was added 10 mL of ultra pure water. The sample was shaken for 15 minutes and then centrifuged. The supernatant was then transferred into a 10 ml volumetric fl ask, diluted to the mark with ultra pure water and mixed well by shaking for 15 minutes.
Quantification of GA was examined by liquid chromatography. Instrumental parameters used were as described by Yusoff and Wan Mohamud (2011). A HPLC (Agilent 1260) system comprising vacuum degasser, quaternary pump, auto-sampler and diode array detector. Separation was performed on stationary phase: Octadecylsilyl silica gel for reversed (C18), Zorbax column (250 mm x 4.6 mm x 120 °A). Mobile phase: acetonitrile (A), 0.25% phosphoric acid (B), and methanol (C). 0-19 minutes: A/B = (1/99); 20-29 minutes: A/B = (5/95); 30-54 minutes: A/B/C = (12/85/3); 55-59 minutes: A/B/C = (1/97/2); 60-80 minutes: A/B = (1/99). Injection sample volume was 50 μL with temperature of column was ambient. Flow rate was 1.0 mL/min, pressure 400 bar and detection wavelength was 254 nm.
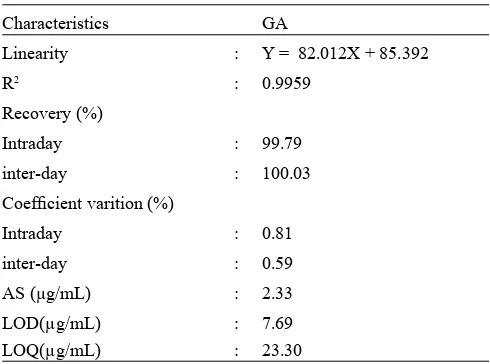
Table 1. Performance characteristics of method
Characteristics GA
HPLC assay. The separation was performed on stationary phase: Octadecylsilyl silica gel for reversed (C18), Poroshell column (50 mm x 4.6 mm x 120 °A). Mobile phase: 15% acetic acid. The temperature of the column oven was 30°C. The fl ow rate was 1.0 mL/min, pressure 400 bar and detection wavelength was 254 nm. Sample injection volume was 5 μL (Tarter, 1980).
Validation method. Validation of analytical methods was carried out according to the International Conference on Harmonization guideline (ICH, 2002). The method was validated for linearity, analytical sensitivity, and accuracy, limit of detection (LOD) and limit of quantization (LOQ).
Estimated daily intake (EDI). The estimated daily intake (EDI) for the food additives by the general Malaysian population was calculated from the following equation (1), where ΣC is the sum of additive concentration in the analyzed samples (mg/L), C is the annual intake estimated per Malaysian inhabitant (assumption) for soft drinks, N is the total number of analyzed samples, D is the number of days in a year, and K is the mean body weight, which was considered 70 kg (mean of body weight of the Malaysian population) (Lino and Pena, 2010).
....(1)
RESULTS AND DISCUSSION
Determination of GA Content in Raw Material
In order to determine GA content in the lyophilized plant extract, a HPLC method based on Yusoff and Wan Mohamud (2011) was used. Average content of GA in lyophilized plant extracts are shown in Table 2. Table 2 shows that GA of lyophilized plant extracts of LPR and LPC were 0.12% (w/w) and 0.72% (w/w).
Table 2. Average GA value (%w/w) in lyophilized plant extract
Sample Gallic acid, GA %(w/w) Raub, Pahang-Malaysia (LPR) 0.12
Commercial extract-geographic region is unknown (LPC)
0.72
Validation Method
The analytical methodology revealed good linearity, accuracy (recovery), and sensitivity. The performance characteristics of method are shown in Table 3.
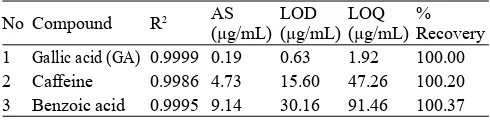
Table 3. Performances characteristics of method
No Compound R2 AS 1 Gallic acid (GA) 0.9999 0.19 0.63 1.92 100.00 2 Caffeine 0.9986 4.73 15.60 47.26 100.20 3 Benzoic acid 0.9995 9.14 30.16 91.46 100.37
Table 3 shows correlation coeffi cients (R2) were 0.9999
for GA, 0.9986 for caffeine and 0.9995 for benzoic acid. Table also shows the accuracy measurements of GA, caffeine and benzoic acid were 100.00%, 100.20% and 100.37%, respectively. Based on these results, it can be concluded that for analysis performed were satisfactorily low. According to AOAC (2002), the recovery value ranged over 80-120% indicates a method having good accuracy. The performance characteristics of limit of detection (LOD) to be 0.63 μg/ mL for GA, 15.60 μg/mL for caffeine and 30.16 μg/mL for benzoic acid. Meanwhile, the limit of quantization (LOQ) of GA, caffeine and benzoic acid were 1.92 μg/mL, 47.26 μg/ mL and 91.46 μg/mL, respectively (Table 3). Based on these results, the limits are low enough to determine analytes in the sample LP beverage.
Chemical Profi ling
Benzoic acid has been acknowledged as important food preservatives and contaminants that must be monitored and controlled in beverages. Excessive quantities of these acids cause serious hazards for consumers and they must be strictly controlled (JECFA, 2004). Gallic acid is known to have anti-infl ammatory, anti mutagenic, anticancer, and antioxidant activity. A HPLC connected to a UV-vis DAD was employed to profi le and quantify GA, caffeine and benzoic acid in samples of commercial LP beverage. Concentrations were determined by calculating the HPLC peak areas which are proportional to the amount of analyze in a peak. Chromatograms of authentic standard gallic acid, caffeine and benzoic acid (Fig. 1) are shown. Instrumental parameters used were as described by Tarter (1980) with modifi cation.
Figure 1. HPLC chromatogram containing GA (RT:0.66), caffeine (RT: 2.15) and benzoic acid (RT:5.18) (λ = 254 nm)
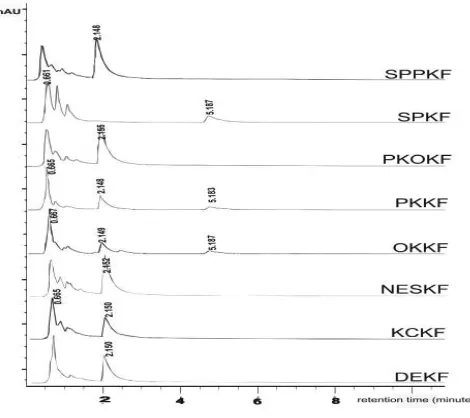
GA, caffeine and benzoic acid had been identifi ed in commercial of LP beverage according to its retention time against those of the standard, as well as by spiking the samples with the standard GA, caffeine and benzoic acid (Fig. 2).
Figure 2. HPLC chromatogram GA (RT: 0.66 min), caffeine (RT:2.15), and benzoic acid (RT:5.18) (λ = 254 nm) of samples LP
beverage
Determination of Level of Food Additives in Commercial LP Beverage
In order to determine concentration levels of GA, caffeine and benzoic acid compounds in beverages, a HPLC method was developed. The content of GA, caffeine and benzoic acid in beverages were shown in Table 4.
Table 4. Average content of compounds of commercial LP beverages
Sample Type GA (ppm)
Caffeine (ppm)
Benzoic acid (ppm) Brand 1 (SPKF) Liquid (can
packaging)
37.62 n.d 98.10 Brand 2 (PKOKF) n.d 52.00 n.d Brand 3 (PKKF) 141.19 165.10 150.64 Brand 4 (OKKF) 229.35 168.00 241.13 Brand 5 (SPPKF) Powder
(instant)
n.d 96.84 n.d Brand 6 (NESKF) n.d 60.36 n.d Brand 7 (KCKF) 38.19 43.46 n.d Brand 8 (DEKF) n.d 81.20 n.d
n.d = not detected at = 254 nm
Table 4 showed that LP beverages consumed of GA content were ranged over 37.62 – 229.35 ppm, caffeine (43,46 -168.00 ppm), and benzoic acid (98.10 – 241.13 ppm). Based
on the results, all samples of LP beverages contained c affeine and benzoic acid at levels below the maximum permitted (350 ppm for benzoic acid) by Malaysian Food Regulatory Agency.
Estimated Daily Intake (EDI)
The daily intakes of these investigated food additives through beverages consumption rely mainly on both the content levels of these food additives in the drinks and the amounts consumed of these drinks. Due to the fact that the amounts of the consumed foodstuffs depend on the food habits, in particular, population group, and in order to estimate the daily intake of these food additive in Malaysia, the following assumptions have been put forward: on average, one to two bottles or can of the drink are consumed daily by every adult person. However, the size of the drink can be varied considerably (125 ml-330 ml), hence, daily consumption rate of 500 ml of the drink and also an average adult body weight of 70 kg was also assumed. According to JECFA (2004), recommended that the maximum acceptable limit per day for sodium benzoate food preservative is 5 mg/ kg body weight and for caffeine is 200 mg days.
Estimated daily intake (EDI) for the food additives by the general Malaysian population was calculated from the following equation (1). Estimated average intakes of benzoic acid, and caffeine were below the acceptable daily intakes (ADIs). The EDI’s for LP beverage consumed were 0.39 mg/ kg body weight/ day for gallic acid, 0.59 mg/kg body weight/ day for caffeine (representing 19.6% of ADI’s), and 0.43 mg/ kg body weight/day for benzoic acid (representing 8.6% of ADI’s). Although the number of drink samples analyzed is still small, the data presented in this study gave a preliminarily outline about the content levels in a foodstuff LP beverages frequently consumed by Kuantan inhabitants.
CONCLUSION
ACKNOWLEDGMENT
The authors are grateful to Research Management Center (RMC), University Malaysia Pahang for fi nancial assistance (GRS090312) and to Faculty of Industrial Sciences and Technology, Universiti Malaysia Pahang (UMP) and Indonesian Institute of Sciences (LIPI) for providing access and technical support.
REFERENCES
Association of Official Analytical Chemists. (2002). Guidelines of validation of qualitative and quantitative food microbiological offi cial methods of analysis. Washingthon, DC. USA [4 February 2011].
Dong, C., & Wang, W. (20Headspace solid-phase micro extraction applied to the simultaneous determination of sorbic and benzoic acid in beverages. Analytica Chimica Acta562: 23-29.
International Conference on Harmonization (ICH). (2002). Guidelines on analytical method validation, in: proceeding of international convention on quality for the pharmaceutical industry, September, Toronto, Canada.
Joint FAO/WHO Expert Committee on Food Additives (JECFA). (2004). General Standard for Food Additives, Codex Stan 192-1995 (Revised 5-2004): 79.
Lino, C.M., and Pena, A. (2010). Occurrence of caffeine, saccharin, benzoic acid and sorbic acid in soft drink and nectars in Portugal and subsequent exposure assessment. Food Chemistry121: 503-508.
Nawrot, P., Jordan, S., Eastwood, J. Rotstein, J., Hugenholtz, A., and Feeley, M. (2003). Effects of caffeine on human health. Food Additives and Contaminants20: 1-30.
Pena, A., Lino, C. M, and Silveira, I. n. (2005). Survey of caffeine levels in retail beverages in Portugal. Food Additives and Contaminants22: 91-96.
Tarter, J. E. (1980). Determination of saccharin, sodium benzoate and caffeine in carbonated beverages by HPLC, Ontario Regional Laboratory, Scarborough, Ontario.
Wen, Y., Wang, Y., and Feng, Y.Q. (2007). A simple and rapid method for simultaneous determination of benzoic and sorbic acids in food using in-tube solid-phase microextraction coupled with high-performance liquid chromatography. Analytical and Bioanalytical Chemistry388: 1779-1787.