A SUSTAINABLE SUPPLY CHAIN MODEL OF
RELATIONSHIP BETWEEN WOOD SUPPLIER AND
FURNITURE INDUSTRY IN INDONESIA
Muh. Hisjam
Department of Industrial Engineering, Faculty of Engineering Sebelas Maret University
Adi Djoko Guritno
and
Shalihuddin Djalal Tandjung
Doctoral Study Program of Environmental Science,Graduate School Gadjah Mada University
ABSTRAK
Industri furnitur kayu merupakan sektor industri penting di Indonesia, karena kesejahteraan banyak orang bergantung pada sektor industri dan industri ini memiliki dampak sosial dan lingkungan yang besar. Banyak industri furnitur kayu di Indonesia, khususnya di Provinsi Jawa Tengah menghadapi masalah terkait dengan keberlanjutan. Hubungan antara pemasok kayu dan industri furnitur dipelajari dalam makalah ini. Sebuah model rantai pasokan yang berkelanjutan manajemen (s-SCM) diusulkan sebagai pendekatan untuk solusi masalah.
Pendekatan ini dipilih karena karakteristik masalah yang berkaitan dengan masalah ekonomi, sosial, dan lingkungan. Tujuan makalah ini adalah untuk menentukan berapa banyak pasokan kayu jati harus disediakan oleh PP untuk memenuhi permintaan industri furnitur, berapa kapasitas produksi yang harus ditingkatkan dan seberapa luas hutan yang harus ditanam untuk mencapai tujuan lingkungan dan sosial tanpa terlalu mengorbankan tujuan ekonomis. Goal Programming (GP) dipilih untuk memecahkan masalah, karena tujuan adalah untuk memaksimalkan keuntungan total, meminimalkan kerugian total dan mengantisipasi konflik antara tujuan. Percobaan numerik berdasarkan pengamatan di industri furnitur kayu jati di Jawa Tengah digunakan untuk menggambarkan temuan kami. Dengan menggunakan prinsip pareto efisien, model ini dapat memenuhi semua tujuan yang harus dicapai. Hasil numerik dapat digunakan oleh pengambil keputusan di industri kayu jati untuk menganalisis trade-off di antara sejumlah solusi alternatif.
Kata Kunci: pemasok kayu, industri furnitur kayu, keberlanjutan, SCM berkelanjutan.
ABSTRACT
(s-SCM) model is proposed as an approach for solutions for the problems. The approach is chosen due to the characteristics of the problems that related to economic, social, and environmental problems. This aim of this paper is to determine how much supply teak wood must be provided by PP to satisfy furniture industry demand, how much production capacity that must be increased and how large forest area that must be planted in order to achieve environmental and social goals without sacriicing economical goals much. Goal programming (GP) is chosen for solving the problems, because the goals are to maximize the total beneit, minimize the total loss and anticipate the conlicts between goals. Numerical trial based on observation in teak wooden furniture industry in Central Java was used to illustrate our indings. Using pareto eficient principle, the model can satisfy all goals that need to be achieved. Numerical results can be used by decision makers in teak wood industry to analyze the trade-off among several set of alternative solutions.
Keywords: wood supplier, wooden furniture industry, sustainability, sustainable SCM
INTRODUCTION
Teak (Tectona grandis L.f.) is the main raw material for high quality export-oriented furniture because it is easily processed, strong, durable, and more importantly has aesthetic aspects (Pandey and Brown, 2000; Simon, 2006; 2008). For Central Java province, teak furniture industry has strategic role because it produces more than 30% of total furniture exports in Indonesia, creates employment opportunities, and improves the welfare of society (REDI, 2007; CRDCCP, 2010; CJPFO, 2011). However, recently, the industry faces many obstacles in maintaining its continuity and growth, which is reflected in the decreasing number of small and medium enterprises in teak furniture from year to year (CJPFO, 2005).
The main reason behind the production decline is due to the lack of teak wood supply. Perum Perhutani (PP), a state owned company for teak forest management, supplies good quality of teak wood for furniture industry. More than forty percent of teak inventory managed by PP has been depleted in only ten
years (PPU2, 2011). For illustration, there were approximately 36.2 million m3 of teak inventory
in 1998, 27.5 million m3 in 2003, and only 18.9
million m3 in 2007. Hence in conducting its
core business as teak supplier, PP is restricted by the principle of forest sustainability, i.e. the certain boundaries of forest areas, the success of forest regeneration system, and guarantee that logging is not excessive because the PP should also be tasked to preserve the forests (Simon, 2010). As a consequence, PP can provide only a small portion of teakwood supplies for domestic demand. Unfortunately, this policy causes raw material shortage for furniture manufacturers since eighty percent of furniture industry use teak as the main raw material (Ewasechko, 2005).
Furniture manufacturers also experience production inefficiency. This condition brings negative impacts on manufacturing cycle as most companies have a less efficient production processes, labor with low productivity, and produce low quality products (Effendi and Dwiprabowo, 2005). Furniture industry that has no well-trained human resources and modern organizations generally cannot penetrate to global market although wood furniture demand in global market is very high (Loebis and Schmitz, 2005). Global markets need not only cheap products with a high variation, but also that manufactured by companies that promote health and safety environment, employment equality, and environmental sustainability in which importers can conduct more stringent oversight (Posthuma, 2003). In addition, there is an increasing attention to green products which consider clean production and environment friendly (D’Souza, 2004, do Paço et al., 2009).
Sustainable Supply Chain Model
Discussing sustainable supply chain is not complete without defining sustainable development and sustainable supply chain management (s-SCM). Generally, sustainable development can be defined based on the definition from The Brundtland Commission (WCED 1987), which defined as development that ‘‘meets the needs of the present without compromising the ability of future generations to meet their own needs”. About the definition of s-SCM, Seuring and Mueller (2008) defines s-SCM as “the management of material, information and capital flows as well as cooperation among companies along the supply chain while taking goals from all three dimensions of sustainable development, i.e., economic, environmental and social, into account which are derived from customer and stakeholder requirements”.
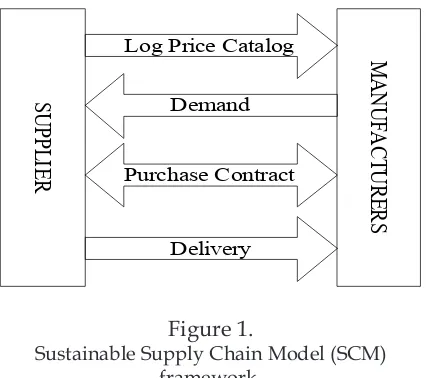
Sustainable supply chain (s-SC) that considered in this paper is based on a framework in Hisjam et al. (2011). This model consists of two entities namely supplier and manufacturers as depicted in Fig. 1. Supplier gives log price catalog to manufacturers in the first period. This catalog contains all products, which can be categorized by the quality and dimension. Manufacturers then calculate the log required to satisfy furniture demand.
Log Price Catalog
SU
PP
LIE
R
Demand
Delivery Purchase Contract
M
AN
UF
AC
TU
RE
[image:3.595.76.289.509.698.2]RS
Figure 1.
Sustainable Supply Chain Model (SCM) framework.
Based on the prices offered by supplier and furniture’s demand, manufacturers determine how many teak logs must be purchased. Supplier collects demand data from all manufacturers, and then compares the aggregate demand with its production capacity. Decision will be made whether to increase production capacity in order to satisfy manufacturers’ demand or to retain its production capacity. Wood supplier has to produce teak log to supply manufacturers. For the next discuss, wood supplier will be mentioned as supplier. The next section will briefly describe supplier and manufacturers activities in the s-SCM and also goal programming (GP) method as a suitable tool to solve and analyze the multi-objectives in the s-SCM.
Sustainable Production Activity by
Supplier
Supplier’s activities contain the two main production stages: harvesting and planting. There are several concepts that can be helpful to describe planting and harvesting in forest management, such as simple forest model (Amacher et al., 2009), whole stand growth model (Vanclay, 1994), even aged-stand and rotation time (Bettinger et al., 2009).
The planting and harvesting conducted by supplier as follows. In period t supplier harvest the teak forest in order to fulfill manufacturers’ demand D. In the next period supplier must plants the harvested area in order to keep forest sustainability and comply with the government regulation. Currently, area of the forest managed by supplier has not satisfied this regulation. As a consequence, supplier must plant not only forest stand in the amount of the previous harvested area, but also additional amount of forest area to close the regulation gap. Thus supplier must determine the how many logs that must be harvested and planted while preserving forest sustainability.
manufacturers’ demand. For example, consider in period t demand from manufacturers is greater that supplier’s production capacity. Supplier must determine whether to increase its capacity by purchasing and investing equipment and also hiring new labors or to retain its production capacity. If supplier decides to increase its capacity, additional cost incurred from equipment investment and labor cost but additional revenue increase by log selling and job opportunities for community is wider. In contrast, if supplier determines to retain its capacity no additional gain from log selling and no job opportunities provide by supplier to community. Thus supplier must determine which decision must be made which gives maximum not only economical aspects but also social aspects.
Sustainable Production Activity by
Manufacturer
In s-SCM, manufacturers produce furniture to fulfill export demand. As previously discussed above, importers seek green product, i.e. production process to manufacture products must be environmentally benign. In order to satisfy this, manufacturers face several notable problems: log supply from supplier, production waste, energy consumption, and factory utilization.
First consider that furniture demand D in period t. Suppose that teak log supply from supplier doesn’t suffice the furniture demand. In order to cover furniture demand, manufacturers can purchase teak log from foreign importer. However, this will bring cost increase. In addition, more furniture production brings more production waste. Furthermore, energy consumption will also rise if manufacturers decide to fulfill all furniture demand. Fortunately, if manufacturers choose to increase furniture demand fulfillment, this will bring greater revenue. In contrast, if furniture demand is smaller revenue will be lower, however the environmental aspects much more safe to
guarantee. Thus, the manufacturers must determine the amount of furniture produced that maximizes not only economical aspects but also environmental and social aspects.
Goal Programming (GP)
From the previous discussion above, both supplier and manufacturer in s-SCM have many objectives that must be satisfied. However, these objectives are often conflicted. In order to analyze the trade-off between these objectives, suitable tool is required and GP has proven to be appropriate to give decision makers set of alternative solutions that satisfy the objectives. GP was fistly proposed by Charnes and Cooper (1961). Since its inception until now, there seems to be an increasing use of GP in the academic publications (Jones and Tamiz, 2010).
The common terminologies used in GP are as follows. Goal refers to criterion which decision makers must be achieved. Target level is the numeric value of a goal criterion. Deviational variables measure the difference between target level and actual value of solutions. A generic form of GP can be described below
(1)
( )
∑
( )
=
=
gi i
g
f
g
f
1
Min
where g denotes number of goals, f(g) denotes achievement function that must be minimized, f(g)i and denotes achievement function in goal- g. Denote that f(g)i contains the weight and deviational variables that must be minimized. A goal or criterion can also be called soft constraints. A goal formulation can be formulated as follows.
(2)
fg( )
x +dg+ −dg− =ω
gwhere fg(x) denotes the function of goal g that must be achieved, d+
g and d-g denote the
positive and negative deviational variables of goal g , and ωg denotes the target level set by
Model Formulation
[image:5.595.71.290.205.520.2]In this section, the development sustainable supply chain model for teak wood supplier-manufacturer relationship is exposed. Notation and variables used in the model, and the mathematical model formulation are mentioned respectively.
Table 1.
Notations and parameters
Supplier’s
parameters Manufacturer’s parameters
s t
p log price m t
p furniture price
t
c
harvesting costt
Q
log purchasedt
κ
∆
capacity increased by supplierV
t furniture producedt
κ
production capacity tς
production costt
q
log quantity producedα
inventory unit cost γ increasing capacity costI
t inventory levelβ planting cost
t
E
electricity consumption function
t
A
production forest tU
utility functiont
B
protection forestt
W
waste functiont
H
harvesting forestt
G
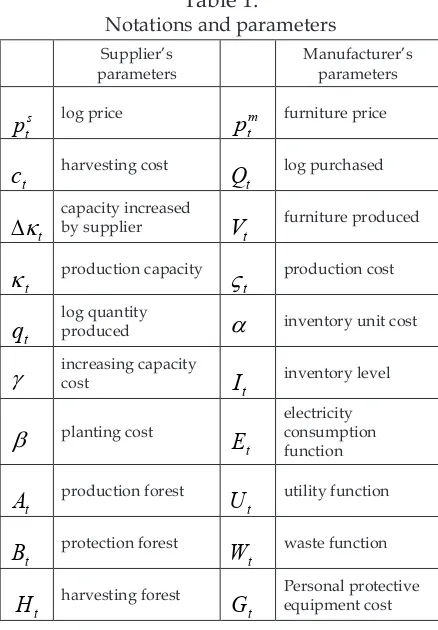
Personal protective equipment costTable 1 represents supplier’s and manufacturer’s parameter in the s-SCM development. Additional parameter’s notation in Table 2 is used to develop goal programming model. The model can be considered as a multi-objective optimization problem, since it seeks optimal solution between conflicting objectives.
In order to utilize GP technique, several things that must be considered are: soft constraints or goals that must be achieved, desired value, and positive and negative deviational variables of the corresponding
goals, and hard constraints. First, goals in sustainable supply chains must be defined.
Table 2.
Other notations and parameters
t
time index −g
d negative deviational
g goal index G1 economical sustainability index
( )
g
f
achievement function G2 environmental sustainability indexg
ω
desired value for corresponding goal G3 Social sustainability index+ g
d positive deviational
Economic Sustainability Goals
Economic sustainability from SCM is given by the profit that must be achieved by both supplier and furniture manufacturer. Thus this goal in involves maximizing revenue while simultaneously minimizing relevant cost. The expression above can describe the corresponding goal:
where d+
1 and d+2 are positive deviational
variables, d
-1and d-2are negative deviational
variables, and ω1 and ω2 are desired values
the goal that manufacturers want to achieve consists of revenue minus by production cost, cost to procure Personal protective equipment (PPE) for guarding labor’s health, and inventory cost.
Environmental Sustainability Goals
Green production practices must comply some regulations that imposed by the government or decision maker. Supplier must uphold the regulation imposed by federal government that area of forest must cover minimum thirty percent of total area reserved. This goal is represented in (5). Manufacturer must suppress the production waste as in (6).Equation (5) states that for every period, the balance of area that must be covered by forest stand must achieve the target value set by decision maker, i.e. comply with government regulation. Equation (6) is applied as part of manufacturers’ effort to produce green products, i.e. production must comply with friendly environment. Therefore, decision maker set a goal that waste in furniture production must not exceed target value set by decision maker. s-SCM must also consider resource usage, energy consumption, and utility of production capacity. Supplier and manufacturer must maintain material process that produces as minimum as possible material waste. For manufacturers, they must also minimize energy and maximize utility. This can be written as
Equation (7) states that log production must be done to produce minimum waste of tree cut. Equation (8) represents goal that must be achieved by manufacturer which restricts efficient design so that the volume of teak log that use in production minimum. Equation (8) and (9) are energy consumption and utility of production capacity that must be minimized and maximized respectively by manufacturers.
Social Sustainability Goals
Demand fulfillment is measured by the ability of supplier and manufacturers to satisfy demand from customer. This can be formulated by supplier’s ability to fulfill log demand from manufacturers as in (11) and manufacturers’ ability to fulfill furniture demand from importers as in (12). Social sustainability in teak wood industry is also achieved by considering workers health and safety in workplace and demand fulfillment. In order to provide health and safety environment manufacturer allocate budget to buy PPE for workers as in (13). The budget is taken from CSR as it is a popular trend for company to conduct CSR (Amaeshi et al., 2008).
Hard constraints
In GP terminology, hard constraints are mathematical formulation that must be satisfied by the decision variables in order to implement the solution in practices. For the s-SCM, hard constraints that must be restricted are given below.
t d
d H B A
t t t t t
t d
d W
t t t
d d Q q
t
t t
d d V Q
t
t t
d d E
t t
d d U
t t
d d
q
t t
d d V
t t
d d PPE
For supplier, log production must not exceed its production capacity as stated in (14). In the same way, manufacturers’ log procurement must not be greater than of supplier’s production as in (15). This brings consequence that furniture produced by manufacturers is less than of log purchased as in (16). Production capacity balance is expressed in (17). The last constraint represents inventory balance faced by manufacturers and expressed in (18).
Objective Function
The objective function of GP is to minimize positive and negative deviational variables from target level set by decision makers in all soft constraints or goals by considering to its priority and importance or weight. Priority and importance of all goals are determined by decision makers. It is common for decision makers to treat the priority as parameters that can be changed and modified and then search the best combination of priority that satisfied all goals. In s-SCM model considered, all priority of goals are equals so the objective function can be formulated as follows
Hence, a GP formulation in s-SCM is minimization of (19) over set of soft constraints in (3)-(13) and set of hard constraints in (14)-(18).
DISCUSSION
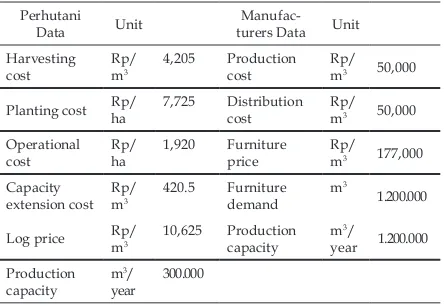
[image:7.595.304.526.387.540.2]To illustrate the capabilities of the model, hypothetical data were generated based on the observation in PP and furniture manufacturers in Central Java. Teak forest stand area in PP Unit I is estimated about 200,000 ha because not all of the forest area plated with teak and only 40,000 ha can be harvested. The remaining forest area is categorized as protection forest and prohibited to be harvested, i.e. its age is below 20 years. Relevant costs faced by PP consist of harvesting cost, planting cost, and operational cost. Relevant costs faced by manufacturer consist of production and distribution cost. Other important data are given in Table 3. s-SC is an multi-objective optimization and can be solved using goal programming technique. IBM ILOG CPLEX is chosen to solve GP formulation of s-SCM.
Table 3.
Supplier and manufacturers data
Perhutani
Data Unit turers DataManufac- Unit Harvesting
cost Rp/m3 4,205 Production cost Rp/ m3 50,000
Planting cost Rp/ha 7,725 Distribution cost Rp/ m3 50,000
Operational
cost Rp/ha 1,920 Furniture price Rp/ m3 177,000
Capacity
extension cost Rp/ m3 420.5 Furniture demand m 3
1.200.000
Log price Rp/ m3 10,625 Production capacity m 3/
year 1.200.000 Production
capacity m
3/
year 300.000
PP and manufacturers as decision makers in teak wood sustainable supply chain set the target value that must be achieved from their business activities. The goals are categorized as economical, environmental, and social sustainability which must be satisfied. The decision makers can evaluate the achievement value from goal programming technique. If the achieved value is smaller than target value, decision makers can lower the target value. On the contrary, if the achieved value is greater than the target value, decision makers
t qt t
t q
Qt t
t Q
Vt t
t
t t
t
t I
V Qt t t
d d d
d d d d d d
Z
t t t
d d
must revise the target values by increasing the target value.
Table 4 represents the goals in teak furniture supply chain along with the target value set by decision makers and achieved value. From Table 4 decision makers can infer that the target value of PP’s profit goal is over optimistic because it is greater than its achieved value. In addition, it is not sufficient for PP to allocate planting cost in amount 500 billion rupiahs to satisfy environmental goal. Furthermore, all economical target level in s-SCM seem to over value compare with their achieved values since manufacturers’ profit goal also beyond its achieved value. In GA terminology, the solution in Table 4 is a Pareto-inefficient solution, i.e. there exists other solution that satisfy all goals and this solution at least as good with respect to all objectives and strictly better with respect to at least one objective (Jones and Tamiz, 2010). In order to find a Pareto-efficient solution, decision makers must revise or adjust their target level by using the values of negative and positive deviational variables in the Pareto-inefficient solution so that all goals are satisfied. The first solution considering the Pareto-efficient solution is shown in the Table 5.
Table 4.
Initial goals and achieved value (Monetary Unit in Billion Rupiahs)
Goals
Sub goal
Value (time period, 12 months)
G Unit Target Achieved
G1 Economical sustainability
Supplier’s profit Rp 10,000 5,022 Supplier’s planting
cost Rp 500 702
Supplier capacity
increase cost Rp 100 315 Manufacturers’
profit Rp 31,000 25,000
G2 Environmental sustainability
Forest area
regulation ha 659,960 257,926
Supplier’s scrap generation m
3 100,000 90,000
Manufacturers’ scrap generation m
3 400,000 600,000
Manufacturers’ energy consumption
Rp/
m3 20,000 19,870
Manufacturers’
capacity utility % 100 100
G3 Social sustainability
Supplier’s demand
fulfillment % 100 100 Manufacturers’
demand fulfillment
% 100 100
Labor’s healthy Rp 30 30
Table 5.
Goal and achieved value that satisfy all goals (Monetary Unit in Billion Rupiahs)
Goals
Sub goal
Value (time period, 12 months)
G Unit Target Achieved
G1 Economical
sustainability
Supplier’s profit Rp 5,000 6,000 Supplier’s
operation cost Rp 6,000 5,413 Supplier’s
planting cost Rp 500 500 Capacity
increase cost Rp 500 332 Manufacturers’
profit Rp 25,000 25,000
G2 Environmental
sustainability
Forest area
regulation ha 230,000 234,960 Supplier’s scrap
generation m
3 100,000 90,000
Manufacturers’ scrap generation m
3 600,000 600,000
Manufacturers’ energy consumption
Rp/
m3 20,000 19,870
Manufacturers’
capacity utility % 100,00 100,00
G3 Social
sustainability
Supplier’s demand fulfillment
Manufacturers’ demand fulfillment
% 100 100
Labor’s healthy Rp 30 30
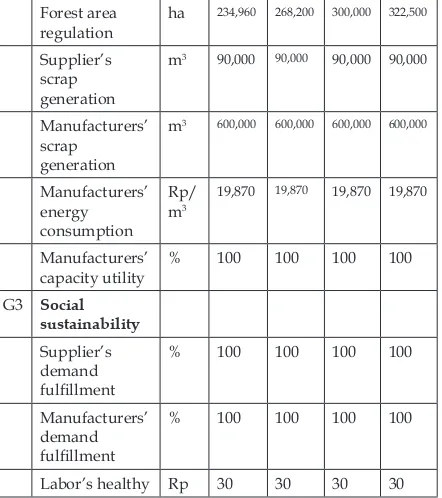
[image:9.595.306.527.100.349.2] [image:9.595.73.293.509.716.2]In Table 5, decision makers revise all their target values in the economic sustainability goal by lowering them. For instance, PP lowers its profit 10,000 billion rupiahs to 5,000 billion rupiahs and manufacturers decrease their profit target value from 31,000 billion rupiahs to 25,000 billion rupiahs respectively. PP also increases its target cost of capacity increase from 100 billion rupiahs to 500 billion rupiahs since the previous target level cannot satisfy or conflict with other goals, such as goal of demand fulfillment and profit. Hence by applying adjustments on their conflicted goals, i.e. goals or objectives which give big unwanted deviational values that need to be minimized. In order to illustrate the conflicted objectives in s-SCM, a sensitivity analysis for predetermined various values of allocated planting budget as in Table 6 can show the difference. Planting cost of supplier is a parameter so the value is predetermined, and then Pareto-efficient solution corresponding to predetermined planting cost is presented in Table 6.
Table 6.
Sensitivity analysis for various allocated planting budget (Monetary Unit in Billion Rupiahs)
Goals Value (time period, 12 months) G Sub goal Unit Planting budget
500 750 1000 1500 G1 Economical
sustainability
Supplier’s
profit Rp 6,000 5,000 4,000 3,000 Supplier’s
operation cost Rp 5,413 6,179 6,910 7,430 Supplier’s
planting cost Rp 500 750 1,000 1,500 Capacity
increase cost Rp 332 315 335 315 Manufacturers’
profit Rp
25,000 25,000 25,000 25,000
G2 Environmental sustainability
Forest area regulation ha
234,960 268,200 300,000 322,500
Supplier’s scrap generation
m3 90,000 90,000 90,000 90,000
Manufacturers’ scrap
generation
m3 600,000 600,000 600,000 600,000
Manufacturers’ energy consumption
Rp/ m3
19,870 19,870 19,870 19,870
Manufacturers’
capacity utility % 100 100 100 100 G3 Social
sustainability
Supplier’s demand fulfillment
% 100 100 100 100
Manufacturers’ demand fulfillment
% 100 100 100 100
Labor’s healthy Rp 30 30 30 30
CONCLUSION
In this paper, a sustainable supply chain model of the supplier and manufacturer in the furniture industry is proposed. The model can determine how much supply teak wood must be provided by PP to satisfy furniture industry demand, how much production capacity that must be increased and how large area that must be planted in order to fulfill environmental and social sustainability without sacrificing economical aspect much. These multi-objectives are conflicting and decision makers must make careful judgment to decide which objective is given the main priority.
In pareto-efficient solution, all goals considered are satisfied. Using sensitivity analysis for one of aspect in various level, it shows the influence to the achievement of some goals. Trial for another aspect can be conduct to know the influence to some goals considered. This model can be used to know the effect of various change of one or more aspects to various conditions.
However, further research is needed to cover not only the relationship between supplier and manufacturer but also between manufacturer and buyer/customer. In this paper, all goals are given the same weight, so it can be extended is with giving various weight to the goals considered. Another extention is with adding sub goals considered.
BIBLIOGRAPHY
Amacher, G.S., Ollikainen, M. and Koskella, E., 2009, Economics of Forest Resources, The MIT Press, Cambridge, Massachusetts.
Amaeshi, K.M., Osuji, O.K. dan Nnodim, P., 2008, “Corporate Social Responsibility in Supply Chains of Global Brands: A Boundaryless Responsibility? Clarifications, Exceptions and Implications”. Journal of Business Ethics (81): 223–234.
Bettinger, P., Boston, K., Siry, J.P. and Grebner, D.L., 2009, Forest Management and Planning, Academic Press, New York. Charnes, A. and Cooper, W.W., 1961,
Management Models and Industrial Applications of Linear Programming, John Wiley & Sons, New York.
Center for Research and Development of Climate Change Policy (CRDCCP)., 2010, “Imbalances in the Value Added Distribution of Furniture Value Chain (Ketidakseimbangan Distribusi Nilai Tambah dalam Rantai Nilai [Value Chain] Mebel), Policy Brief Vol. 4 (7): 1-4, Agency for Forestry Research and Development, Ministry of Forestry, Republic of Indonesia, in Bahasa Indonesia.
Central Java Provincial Forestry Office (CJPFO), 2011, Official Website, available at http://dinhut. jatengprov.go.id/, accessed on May 24, 2011.
Central Java Provincial Industry and Trade Office (CJPITO), 2005, Annual Report of the Implementation Evaluation Main Tasks and Functions”, Semarang, in Bahasa Indonesia. D’Souza, C., 2004, Ecolabel Programmes: a
stakeholder (consumer) perspective, Corporate Communication 9 (3): 179 – 188.
do Paço, A.M.F., Raposo, M.L.B. and Filbo, W.L., 2009, “Identifying the green consumer: A segmentation study”, Journal of Targeting, Measurement and Analysis for Marketing, 17, 17 – 25. Effendi, R., and Dwiprabowo H., 2007, Study
Kehutanan 4(3). pp. 233 – 255, in Bahasa Indonesia.
Ewasechko, A.C., 2005, Upgrading the Central Java Wood Furniture Industry: A Value-Chain Approach, International Labor Organization, ISBN 92-2-017038-8.
Hisjam, M., Guritno, A.D., Simon, H., and Tandjung, S.D., 2011, A Framework for The Development of Sustainable Supply Chain Management for Business Sustainability of Export-Oriented Furniture Industry in Indonesia (A Case Study of Teak Wooden Furniture in Central Java Province), Proceedings of The 1st International Conference on Industrial Engineering and Service Science, pp. 285-290, 20 – 21 September, Hotel Lor In, Solo, ISBN: 979-545-053-0.
Jones, D. and Tamiz, M., 2010, Practical Goal Programming, Springer,New York. Loebis, L., and Schmitz, H, 2005, Java
furniture makers: Globalisation winners or losers?, Development in Practice 15(3&4): 514 – 521.
Pandey, D. and Brown, C., 2000, Teak: a global overview, Unasylva 201(51):3–13. Perum Perhutani Unit II (PPU2), 2011,
Perhutani must change, the standing stock of teak continues to decline (Perhutani harus berubah, standing stock jati terus menurun). http:// www.unit2.perumperhutani.com/ home/index.php?option=com_ content&task=view&id=69&Itemid, Accesed on April 30, 2011 in Bahasa Indonesia.
Posthuma, A.C., 2003, Taking A Seat In The Global Marketplace: Opportunities
For “High Road” Upgrading In The Indonesian Wood Furniture Sector?, The Conference on Clusters, Industrial Districts and Firms: the Challenge of Globalization, Modena, Italy, September 12-13.
Regional Economic Development Indonesia (REDI), 2007, Study on Obstacles of Policy for Furniture Industry – Study in East Java and Central Java, Available at pdf.usaid.gov/ pdf_docs/PNADN181.pdf, USAID: The United States Agency for International Development, accessed on September 5, 2011.
Simon, H., 2006, Teak Forest and Prosperity: Problems and Strategy, 1st Edition,
Pustaka Pelajar Press, Yogyakarta, Indonesia, in Bahasa Indonesia. Simon, H., 2008, Forest Management with
People: Theory and Implementation in Teak Forest in Java (Pengelolaan Hutan Bersama Rakyat: Teori dan Aplikasi pada Hutan Jati di Jawa), Second Edition, First Printing, Pustaka Pelajar Publisher, Yogyakarta, Indonesia, in Bahasa Indonesia.
Simon, H., 2010, Socio-technical aspects in Teak Forest Management in Java (Aspek Sosio-Teknis Pengelolaan Hutan Jati di Jawa), Revised Edition, Second Printing, Pustaka Pelajar Publishing, Yogyakarta, Indonesia, in Bahasa Indonesia..