Children’s Health and Maternal
Work Activity
Estimates under Alternative Disability
Definitions
Elizabeth T. Powers
a b s t r a c t
Past empirical findings indicate that children’s health problems reduce married mothers’ employment but are inconclusive in the case of female heads. These studies use diverse disability definitions, samples, and speci-fications. This paper uses pooled SIPP panels to investigate the impact of alternative disability measures on maternal market work. Negative effects of several disability definitions on female heads’ and wives’ employment and hours at a point in time are found. In contrast, while female heads’ growth in work hours over time and probabilities of entering employment appear adversely affected by child disability, there is no evidence for anal-ogous effects on wives.
I. Introduction
A mother’s labor market activity is plausibly influenced by her chil-dren’s characteristics, and much effort has been fruitfully devoted to measuring and interpreting the influence of children’s ages, particularly via their influence on childcare costs (for example, Heckman 1974; Connelly 1992; Kimmel 1998). An-other characteristic of obvious concern is health. A health-impaired, or ‘‘disabled,’’ child may require more parental time investment, and appropriate childcare may be unavailable or expensive (U.S. General Accounting Office 1997). Unfortunately, previous studies on the topic of child disability employ a wide range of data sets, specifications, and disability definitions, and have produced inconclusive findings. Past studies have also been largely restricted in focus to static measures of
employ-Elizabeth T. Powers is an assistant professor in the Institute of Government and Public Affairs and De-partment of Economics, University of Illinois at Urbana-Champaign. She thanks Alan Auerbach for comments on an earlier draft and Parker Yi for research assistance. The data used in this article can be obtained beginning February, 2004 through January 2007 from Elizabeth Powers, Institute of Gov-ernment and Public Affairs, University of Illinois at Urbana-Champaign, 1007 W. Nevada Street, Ur-bana, IL 61801 or e-mail to epowers@uiuc.edu.
[Submitted June 1999; accepted January 2002]
ISSN 022-166X2003 by the Board of Regents of the University of Wisconsin System.
Powers 523
ment status. This paper presents new estimates of the influence of children’s health on maternal work activity. By using the Survey of Income and Program Participation (SIPP), a data source that allows the construction of several definitions of child disability, it is possible to explore the sensitivity of the empirical findings with re-spect to alternative definitions. In addition, by exploiting the panel format of the SIPP, the influence of child disability on dynamic measures of maternal market work can be studied.
This topic is important for several reasons. Child disability rates have grown sub-stantially over the past decade, and a significant fraction of families contain at least one child with a serious health problem. Evidence from the 1991 and 1992 Surveys of Income and Program Participation (SIPP) (close in time to the samples used in this paper) indicates that 5.8 percent of people under 18 years of age in the United States are disabled according to a comprehensive measure (McNeil 1993). Because poorer families are more likely to have an unhealthy child (see for example, Brooks-Gunn and Duncan 1997), this may exacerbate income inequality. The Personal Re-sponsibility and Work Opportunity Reconciliation Act of 1996, which promotes la-bor market activity through explicit work requirements and time limits on welfare use, has lent new urgency to understanding the role of family health problems. Be-cause the clear goal of current welfare policy is to largely supplant a household’s welfare payments with earnings over a five-year period, it is especially important to identify obstacles to maternal work activity (particularly in the low-income fami-lies most affected by these policy changes) and to formulate policies to remove or ameliorate these obstacles.1Finally, understanding how child health problems
im-pede labor market activity is critical to formulating a sensible child disability policy, because parental earnings losses are an important justification for providing cash benefits to families with disabled children.
The next section reviews the previous literature. The data and alternative disability definitions are described in Section III. Section IV presents empirical findings on the effect of alternative disability definitions and underlying criteria on both static and dynamic measures of maternal work activity. Section V compares the findings with those of the previous literature, discusses their implications, and indicates direc-tions for future research.
II. Previous Literature
Many children’s health problems place an additional care burden upon parents. Salkever (1985) discusses the many additional parental activities re-quired by contacts with the medical system alone. A health-impaired child may also require more adult time investment in nontherapeutic activities to enhance its devel-opment. Leonard, Brust, and Sapienza (1992) list both medical and nonmedical activ-ities that require additional time spent in the care of a severely disabled child.
524 The Journal of Human Resources
priate services may not be available in the marketplace (private daycare centers have the right to reject children with health problems) or may be prohibitively expensive. Even the effective price of informal relative care could be high if the care of the child is difficult or unpleasant. These factors may encourage mothers who would have remained in the labor force had their child been healthy to exit or to curtail their work hours. If the need for childcare does not lessen sufficiently as a disabled child ages, mothers who would reenter the labor force, or who would have increased work hours over time had their child been healthy, may not do so.2
A number of studies provide direct evidence on the effect of child health problems on maternal work activity. Appendix 1, Table A1, lists the major studies and outlines their features and findings. The most commonly analyzed work activity is employ-ment, but some studies also examine work hours and female heads’ AFDC participa-tion (considered to be their principal alternative to employment). It is evident that a wide variety of child disability definitions have been employed. In addition to children’s health, explanatory variables common to all studies are basic maternal characteristics (age, education, and health), family structure (numbers and ages of children), and regional economic conditions (unemployment rate and region dum-mies). Studies of wives usually include husbands’ characteristics. Most studies of female heads also include policy variables such as the value of AFDC benefits. A few studies include childcare prices, other (nonmaternal-earned) family income, and maternal wages.
Findings are qualitatively consistent across the small number of studies of wives. Salkever (1982a) presents OLS estimates from the 1972 National Health Interview Survey (NHIS) of the effect of child disability on maternal employment and hours. The main child disability criterion is whether the child has an activity or mobility limitation caused by a chronic condition. Salkever (1982a) finds a significant nega-tive effect on employment (as does Salkever 1982b) but not on work hours, sug-gesting the primary impact of child disability is on the decision to be in or out of the labor market. Breslau, Salkever, and Staruch (1982) analyze a small survey of Cleveland families, and the child disability variable is found to reduce married moth-ers’ labor force participation. Kimmel (1998) examines a sample of wives from the 1987 SIPP. While the child disability variable is not precisely described, the disabil-ity rate given in the sample statistics is similar to that in Kimmel (1997), where the disability concept is based largely on physical limitations. A large negative effect of child disability on wives’ labor force participation is found (only somewhat less than the estimated effect of wives’ own poor health).
Because of the interest in the determinants of welfare recipiency, more studies have been conducted for female heads. A number fail to find negative effects of children’s poor health on employment or work hours. Salkever (1982a) estimates a reasonably large-in-magnitude and negatively-signed coefficient for disability in an employment specification, but the standard error is large (an effect of zero cannot be rejected). Kimmel (1997; 1998), using samples from the 1987 SIPP, finds a very small, statistically insignificant point estimate of the effect of child disability on
Powers 525
female heads’ labor force participation. Acs and Loprest (1998), using the 1990 SIPP, fail to find a significant influence of child disability on the probability that a mother leaves the AFDC program due to increased earnings.
Other studies of female heads have found significant and large-in-magnitude ef-fects on work and welfare participation. Breslau, Salkever, and Staruch (1982) find a reduction in labor force participation that is nearly equal to the estimated impact of a mother’s own poor health. Blank (1989), using a sample from the 1980 National Medical Care Utilization and Expenditure Survey, finds that the mean perceived health status of all family members has a negative effect on single mothers’ labor hours.3To the extent that the maternal health measure (number of days in a year of
restricted physical activity due to illness) is a sufficient control, an independent nega-tive effect of child health on hours is identified. The estimated effect of child disabil-ity on single mothers’ labor force participation in Salkever (1990) is significantly negative at standard confidence levels (but no effect on workers’ hours is found). Wolfe and Hill (1995), using a sample of approximately 1,600 single mothers from the 1984 SIPP (the largest sample in this literature), find that child disability reduces labor force participation and work hours.
Finally, two studies have examined the impact of child disability on female heads using a data set of AFDC recipients in four California counties. Lukemeyer, Meyers, and Smeeding (2000) find a large and negative impact of a child’s severe disability (versus a moderate disability or no disability) on maternal employment, comparable in magnitude to the presence of a young child, and an effect of this variable on workers’ hours similar to that of poor maternal health. Brady, Meyers, and Luks (1998) analyze the impact of children’s disabilities on the duration of welfare spells. In contrast to Acs and Loprest (1998), they find evidence that mothers of severely disabled children are significantly less likely to leave AFDC for work. Given the special nature of these samples, the broader applicability of these findings is not clear.
While wives’ employment is apparently reduced by a disabled child’s presence, more studies examine female heads with inconclusive results. This is not surprising given the widely varying definitions of child disability across studies and the fre-quently small sample sizes, as documented in Appendix 1. While some studies ana-lyze work hours, employment (usually defined as working positive hours) is almost always the primary measure of work activity. Most take a static approach, analyzing decisions at a single point in time and ignoring the dynamic nature of maternal tradeoffs between childrearing and market work.
III. Data and Disability Definitions
Several criteria are desired in a data set to analyze the issues set out above. First, because the incidence of child disability in the population is relatively low, it is important to begin with a large sample of families. Second, the disability definitions that can be implemented are dictated by the child health information avail-able in a data set. The conflicting results from past studies suggest that empirical
526 The Journal of Human Resources
findings may be sensitive with respect to the chosen definition. To establish this sensitivity, one needs a data set that admits alternative disability definitions. Third, because many interesting features of mothers’ work choices are inherently dynamic, as mothers continuously adapt to their children’s changing needs, it is desirable to have repeated measures of work activity over time.
By pooling SIPP panels to increase sample size, it is possible to meet these criteria. Core and topical module surveys are administered to SIPP panelists every four months. The key topical module for this paper, which includes information on func-tional limitations and health conditions of household members (including children) is usually administered in Wave 3 and/or Wave 6 in the 1985 through 1993 panels.4
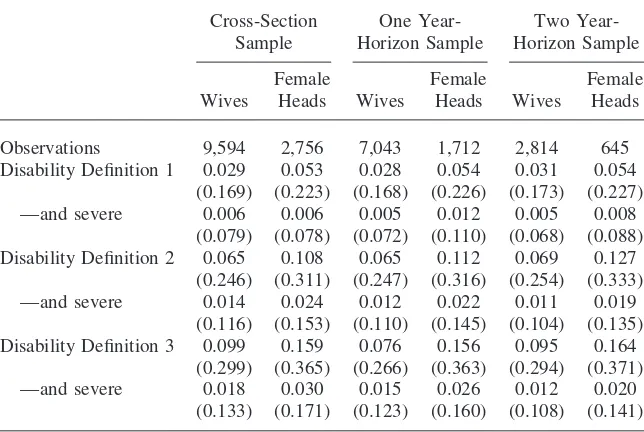
Maternal work activity and demographic information are available from the core. For the static analysis of maternal work effort, Wave 6 of the 1992 SIPP and Wave 3 of the 1993 SIPP are pooled. Due to the SIPP’s overlapping design, all interviews were conducted from September through December 1993. For variables that change monthly, information from the most recent month of the four-month period covered retrospectively in the interview is used. This presumably minimizes recall bias. Both panels are nine waves (three years) long. The 1993 panel is the more useful for a dynamic analysis, because children’s health information is collected in the Wave 3 module, allowing maternal work activity to be analyzed over a subsequent two-year period (from Wave 3 to Wave 9). The 1992 SIPP only collects health information in the Wave 6 topical module, affording a one-year window for analysis. Therefore, a two-year horizon is analyzed using the 1993 panel, while a larger sample is ob-tained for analyzing a one-year horizon by pooling the 1992 and 1993 panels. Sample statistics are presented in Table 1.
A. Child Disability Definitions
Three child-disability definitions are constructed. Children younger than six years of age with ‘‘any limitations at all in the usual kind of activities done by most chil-dren their age’’ because of a ‘‘physical, learning or mental health condition’’ are considered disabled under Definition 1, as are children aged three through 14 with ‘‘a long lasting condition that limits their ability to walk, run or use stairs.’’ The latter limitation concept can be readily extended to children older than 14 by using information from the appropriate activity limitations questions about survey mem-bers 15 and older (see Appendix 2 for further details). This disability definition is constructed to be as similar to Kimmel’s (1997; 1998) as possible. However, changes to the SIPP survey beginning in 1990 make it impossible to recreate precisely the same definition. Kimmel instead used a single question covering 0–17 year olds on ‘‘long-lasting physical, mental, or emotional conditions’’ that ‘‘limit the ability to walk, run, or play.’’ Although mobility limitations are well-characterized for children older than the age of two in the post-1990 SIPPs, limitations in playing (which could have mental, as well as physical, causes) are simply unknown for children older than five in the latter surveys.
Powers 527
Wives Heads Wives Heads Wives Heads
Observations 9,594 2,756 7,043 1,712 2,814 645
Disability Definition 1 0.029 0.053 0.028 0.054 0.031 0.054 (0.169) (0.223) (0.168) (0.226) (0.173) (0.227)
—and severe 0.006 0.006 0.005 0.012 0.005 0.008
(0.079) (0.078) (0.072) (0.110) (0.068) (0.088) Disability Definition 2 0.065 0.108 0.065 0.112 0.069 0.127
(0.246) (0.311) (0.247) (0.316) (0.254) (0.333)
—and severe 0.014 0.024 0.012 0.022 0.011 0.019
(0.116) (0.153) (0.110) (0.145) (0.104) (0.135) Disability Definition 3 0.099 0.159 0.076 0.156 0.095 0.164
(0.299) (0.365) (0.266) (0.363) (0.294) (0.371)
—and severe 0.018 0.030 0.015 0.026 0.012 0.020
(0.133) (0.171) (0.123) (0.160) (0.108) (0.141)
Source: Author’s computations from the 1992 and 1993 panels of the Survey of Income and Program Participation.
Notes: Sample means reported with standard deviations in parentheses beneath. Sample statistics for other model variables are reported in Appendix 3.
Children younger than age six with ‘‘usual activity’’ limitations are also consid-ered disabled under disability Definition 2. Further, children 6–21 with a limitation in the ability to do regular school work, ‘‘because of a physical, learning, or mental health condition’’ are also considered disabled under Definition 2. This definition is as similar as possible to that used by Wolfe and Hill (1995), who worked with the 1984 SIPP and classified children as disabled if they had a ‘‘long-lasting mental or emotional problem that limits their ability to do regular schoolwork.’’ Again, due to changes in the survey, it is impossible to recover Wolfe and Hill’s (1995) precise criteria. The definition constructed for the more recent SIPPs is somewhat broader, both because it allows limitations in activities other than schoolwork for children under six as a disability criterion, and because it allows physical (in addition to mental and emotional) causes of schoolwork limitations in older children as a crite-rion.5
Definitions 1 and 2 differ substantially for children older than five, because the first focuses on the impact of conditions on physical activities, while the second focuses on the impact of health problems on learning activities. Although they are both important
528
The
Journal
of
Human
Resources
Table 2
Selected Characteristics as the Sample of Disabled-Child Families Is Modified
Disabled under Disabled under Definition 3
Families Definition 2 but not
without a Disabled under but not Definitions Disabled Child Definition 1 Definition 1 1 or 2
Number of observations 11,141 436 665 303
Child and family characteristics
Female-headed household 0.208 0.333 0.307 0.290
(0.406) (0.472) (0.461) (0.455)
Number of children 1.91 2.35 2.29 2.10
(0.98) (1.14) (1.24) (1.13)
Age of youngest child 7.03 6.64 9.23 9.00
(5.37) (4.92) (4.57) (6.03)
Any child in family under six 0.468 0.502 0.209 0.429
(0.499) (0.501) (0.407) (0.496)
Family receives SSI 0.019 0.181 0.128 0.056
Powers
529
Maternal characteristics
Maternal age 35.85 35.65 37.87 37.96
(7.66) (7.91) (6.80) (8.10)
Mother less than high school education 0.124 0.229 0.183 0.158
(0.330) (0.421) (0.387) (0.366)
Mother’s race black 0.117 0.165 0.119 0.122
(0.322) (0.372) (0.324) (0.328)
Mother reports very good or excellent health 0.669 0.443 0.520 0.505
(0.471) (0.497) (0.500) (0.435)
Mother in labor force 0.677 0.537 0.611 0.604
(0.467) (0.499) (0.488) (0.490)
Mother’s usual hours 24.29 19.13 20.99 20.18
(19.31) (19.90) (19.55) (18.96)
530 The Journal of Human Resources
aspects of disability, a comprehensive disability definition should encompass both. The third and final disability definition, developed for the SIPP by McNeil (1993), incorporates the first two definitions and some additional qualifying criteria. The latter include the receipt of therapy or diagnostic services for children under seven and other activity limitations of children 15 and older (including work limitations). McNeil (1993) also outlines criteria for categorizing individuals as severely disabled that are applied as a further refinement below. Appendix 2 provides details.
Table 1 demonstrates that the incidences of the alternative measures vary widely. In the pooled cross-section sample, 2.9 percent of wives and 5.3 percent of female heads report a disabled child according to Definition 1. 6.5 percent of wives and 10.8 percent of female heads in the cross-section sample report a disabled child according to Definition 2, rates that are roughly similar to those reported by Kimmel (1998) and Wolfe and Hill (1995) (the disability rates that most closely match their measures are somewhat larger in these more recent samples, consistent with the secular rise in child disability since the late 1980s). 9.9 percent of wives and 15.9 percent of female heads have a disabled child according to the most comprehensive definition. Rates of severe disability are considerably lower (1.8 percent of wives and 3.0 percent of female heads, based on the most comprehensive disability measure). To aid in understanding the implications of varying the disability definition for the empirical findings, Table 2 presents selected variable means that illustrate how the characteristics of the samples of families with disabled children change as the disability definition varies. As a basis for comparison, the first column presents sam-ple statistics for the samsam-ple of families whose children do not satisfy any of the aforementioned disability criteria. The second column presents sample statistics from the cross-section sample of families with children meeting the criteria of Definition 1, which are similar to those of Kimmel (1997; 1998) and Salkever (1982a). The third column presents the sample characteristics of the families of children who are considered disabled according to Definition 2 (similar to Wolfe and Hill 1995; Salkever 1982b; and Salkever 1990) but not according to Definition 1. The final column presents the sample characteristics of children that are added to the disabled group following McNeil (1993).
A glance across the columns of Table 2 reveals that families identified as having disabled children by any of the definitions are more often female-headed and have more children. Mothers in the groups identified as having disabled children are usu-ally older, have lower educational attainment, are in worse health, and work less than the group of mothers without a disabled child.6The families without disabled
children also report lower rates of receipt of SSI income by the family.7
Comparing Columns 2 and 3, the group of children that is considered disabled under the second, but not the first, definition is substantially older (the average age of the youngest child added under the second definition is 9.2 years, versus only 6.6 in the original group, and only 20.9 percent of the families contain a child under six, as opposed to half of the first group). Despite the fact that these are more mature
6. With the exception of Definition 1, racial minority status is similar across all groups.
Powers 531
families, they have fewer children on average. The maternal health of those added is substantially better (52.0 percent of mothers rate their own health ‘‘very good’’ or ‘‘excellent,’’ versus 44.3 percent of mothers in the initial group). The mothers in the second group are also substantially more engaged in work and better-educated, and the family is less likely to receive Supplemental Security Income (18.1 percent of the first group report income from SSI, in contrast to 12.8 percent of the second).8
Although these differences in characteristics suggest that the conditions of the group of children described in column two may be less burdensome on average, the in-creased work activity could be attributable to differences in family age structure.
The final column of Table 2 presents characteristics of the group of children consid-ered disabled under Definition 3 but not under Definitions 1 or 2. These are SIPP children who McNeil (1993), but neither Wolfe and Hill (1995) nor Kimmel (1997, 1998), would identify as disabled. Maternal characteristics are quite similar to those of the second group. The third group, however, has much lower rates of SSI recipiency. Given the relatively greater presence of young children in this group (42.9 percent have children younger than six, as opposed to 20.9 percent of the previous group) it is perhaps somewhat surprising that maternal labor force participation is relatively high.
IV. Empirical Findings
A. Static Measures of Work Activity
Static effects of child disability on employment and hours are estimated for the pooled cross-section sample. In addition to child disability, all specifications include detailed information on maternal characteristics (age, age-squared, education, race, and health), family structure (age category of the youngest child and the numbers of other children in the age categories 0–4, 5–12, and 13–21), welfare policy (the AFDC benefit for a family of three and the SSI benefit for an individual child, includ-ing state supplements to the federal benefit) and economic conditions (the state unem-ployment rate). Policy variables are included to control for the work disincentives of these public programs. SSI participation is possible for both one- and two-parent families (if merited by their child’s condition), and the SSI benefit is included in all specifications. Although the availability of AFDC is a more relevant concern for female heads, AFDC-UP (‘‘unemployed parent’’) is available in all states during the sample period. Therefore the AFDC benefit is included in all specifications. For married women, information on husband’s age, education, and health is included. Controls for panel, survey month, and the (child age) universes of the questions used to construct the relevant disability definition are included in all specifications.9
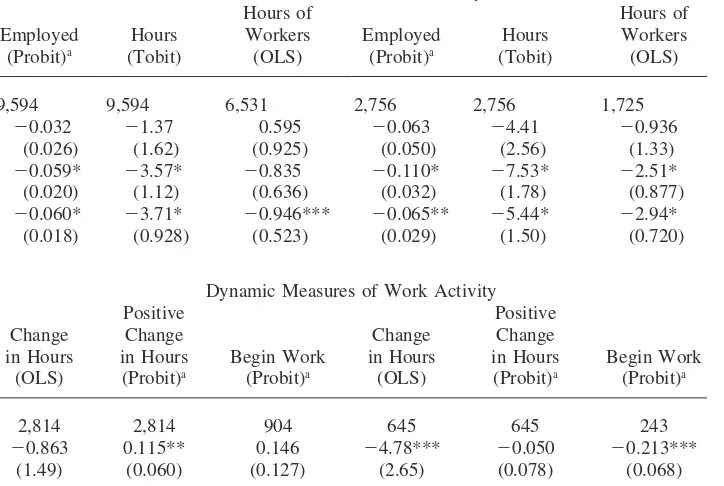
Descriptive statistics for these variables are reported in Appendix 3, Table A3. Disability variable coefficient estimates are reported in Panel A of Table 3. Probits for employment (that is, a positive value of ‘‘usual hours worked’’), tobits for
(de-8. SSI income recipiency is generally understated in the SIPP, particularly prior to the 1996 panel redesign, although the SIPP accounts for substantially more SSI (and other transfer) income than the March Current Population Surveys (Roemer 2000).
532
The
Journal
of
Human
Resources
Table 3
Estimated Effects of Child Disability on Maternal Work Activity
Wives Female Heads
Panel A: Pooled Cross-Section Samples
Static Measures of Work Activity
Hours of Hours of
Employed Hours Workers Employed Hours Workers (Probit)a (Tobit) (OLS) (Probit)a (Tobit) (OLS)
Sample size 9,594 9,594 6,531 2,756 2,756 1,725
Child disability Definition 1 ⫺0.032 ⫺1.37 0.595 ⫺0.063 ⫺4.41 ⫺0.936 (0.026) (1.62) (0.925) (0.050) (2.56) (1.33) Child disability Definition 2 ⫺0.059* ⫺3.57* ⫺0.835 ⫺0.110* ⫺7.53* ⫺2.51* (0.020) (1.12) (0.636) (0.032) (1.78) (0.877) Child disability Definition 3 ⫺0.060* ⫺3.71* ⫺0.946*** ⫺0.065** ⫺5.44* ⫺2.94*
(0.018) (0.928) (0.523) (0.029) (1.50) (0.720)
Panel B: Two-Year-Horizon Samples
Dynamic Measures of Work Activity
Positive Positive
Change Change Change Change
in Hours in Hours Begin Work in Hours in Hours Begin Work (OLS) (Probit)a (Probit)a (OLS) (Probit)a (Probit)a
Sample size 2,814 2,814 904 645 645 243
Powers
533
Child disability Definition 2 ⫺0.377 0.042 ⫺0.000 ⫺3.70** ⫺0.078 ⫺0.163*** (1.03) (0.034) (0.043) (1.81) (0.048) (0.066) Child disability Definition 3 0.464 0.070** ⫺0.024 ⫺3.29** ⫺0.078*** ⫺0.189* (0.887) (0.028) (0.045) (1.65) (0.038) (0.057)
Panel C: One-Year-Horizon Samples
Sample size 7,043 7,043 2,206 1,712 1,712 617
Child disability Definition 1 ⫺0.895 ⫺0.008 ⫺0.033 ⫺4.52* ⫺0.005 ⫺0.094*** (0.896) (0.036) (0.047) (1.46) (0.042) (0.045) Child disability Definition 2 0.235 0.021 ⫺0.026 ⫺1.34 ⫺0.032 ⫺0.064
(0.608) (0.023) (0.031) (1.04) (0.037) (0.038) Child disability Definition 3 0.211 0.016 ⫺0.029 ⫺1.43 ⫺0.017** ⫺0.026
(0.516) (0.021) (0.026) (0.914) (0.027) (0.036)
Source: Author’s estimates from the 1992 and 1993 panels of the Survey of Income and Program Participation.
Notes: Selected coefficient estimates reported with standard errors (adjusted for within-state clustering) in parentheses. All specifications include children’s characteristics (age category of youngest, number in each age category), maternal characteristics (age, education, race, and health), and macro-policy variables (state unemployment rate and measures of states’ AFDC and SSI generosity). For two-parent households, information on fathers (age, education, health) also is included. For the change in hours, mothers’ initial work hours also are included.
aProbability changes (evaluated at the sample means), rather than probit coefficients, are reported. For discrete variables, the probability change is for a change in the
variable from 0 to one.
534 The Journal of Human Resources
sired) usual weekly work hours, and OLS estimates for usual weekly hours of work-ers are estimated. With one exception, the coefficient estimates have negative signs. None of the estimated effects of disability Definition 1 are significant at standard confidence levels. Except for working wives’ hours, estimated effects of Definition 2 are always negative at confidence levels exceeding 95 percent, while estimated effects of Definition 3 are significant at the 90 percent level or higher. For wives, the largest point estimates of disability are estimated from Definition 3, while the findings are mixed for female heads. In every case, the estimated effect of disability is always more negative for female heads than wives. Using the most comprehensive definition, disability is predicted to reduce wives’ labor force participation by 6.0 percentage points and to reduce desired work by an average of 3.7 hours per week (workers’ hours are reduced by 0.95). The probability of female heads’ employment is reduced by 11.0 percentage points in the case of Definition 2, with a reduction of 7.5 in desired usual weekly hours and 2.5 in workers’ hours.
B. Changes in Work Activity over Time
As in the static specifications, in addition to measures of child disability, all specifi-cations include detailed information on maternal characteristics, family structure, welfare policy, and economic conditions. For married women, husband’s characteris-tics are included. Controls for panel, survey month, and the (child age) universes of the questions used to construct the disability definitions are also included in these specifications. Usual weekly hours worked in the initial period are included in the change-in-hours specification. Its coefficient reflects an unobserved ‘‘taste’’ for work and regression to the mean from transitorily high or low initial reported usual hours.10
All explanatory variables are measured as of the beginning of the period. The de-scriptive statistics for the one and two-year-horizon samples are reported in Appen-dix 3, Table A3.
Panels B and C of Table 3 present disability coefficient estimates of employment changes. Families experiencing a major change in composition (either a change from one-parent or two-parent status, or a change in the number of children) are dropped from the samples.11The focus is on how child disability affects changes in maternal
employment over time, given a stable family structure. From inspection of Table A3, it is evident that the mean characteristics of the women, their spouses, and their children are similar across the three samples. Panel B of Table 3 presents the findings for the two-year horizon analyses, which have the smallest samples. Three dependent variables are analyzed: the actual change in hours (estimated using OLS), a binary variable equal to one if there is an increase in (usual weekly) hours over the period (implemented as a probit), and a switch to ‘‘worker’’ from ‘‘nonworker’’ status over the period (implemented as a probit for the subsample of initial nonworkers). The independent variables are all measured at the beginning of the period.
10. The other coefficient estimates, including that of the child disability variable, are reasonably robust with respect to excluding this variable.
Powers 535
Overall, the findings in Panel B of Table 3 are weaker than the findings in Panel A, with fewer significant, negative coefficients, as one would reasonably expect. Transitory fluctuations in work hours can be difficult to explain with available vari-ables. For wives, two disability coefficients are significant at standard confidence levels but have positive estimated effects on the probability of an increase in usual hours. The findings in Panel B provide little support for the hypothesis that changes in wives’ work activity are adversely affected by child disability.
In contrast, the findings for female heads from the two-year-horizon analysis pro-vide reasonable support for the hypothesis. The impacts of all the disability defini-tions on the change in hours and on the probability that initial nonworkers begin working are all significant at the 90 percent level or greater. Disability Definition 3 reduces the average two-year change in usual weekly hours by 3.3, reduces the proba-bility that a female head increases her usual hours worked over the two-year-period by 7.8 percentage points, and reduces the probability that a nonworker begins work-ing by the end of the period by 18.9 percentage points.
Panel C of Table 3 presents the estimates from the one-year-horizon analysis. While the samples are larger (increasing the precision of the estimates), shorter-run behavioral differences are harder to capture. The one-year-horizon dynamic esti-mates also fail to provide support for the hypothesis that the relative work effort of wives is reduced over time by disability (there are no significant positive effects, in contrast to Panel B). Once again, for female heads, the findings provide some support for the hypothesis. In fact, for the larger one-year sample, the first disability definition is estimated to reduce the change in hours over the period for female heads by 4.5 hours. Disability Definition 3 reduces the probability that a female head increases her work hours by 1.7 percentage points (much smaller than the estimated two-year-horizon effect). In contrast to the analogous two-two-year-horizon findings, where evidence for a large reduction in the probability of beginning work within the period was found for nonworking mothers of disabled children, over a one-year horizon the coefficient estimates are much smaller in absolute magnitude and usually insig-nificant at standard confidence levels. Presumably, these coefficient estimates are smaller than the comparable findings from the two-year sample because they measure shorter-run responses.
C. Disability Severity and Disability Criteria
536 The Journal of Human Resources
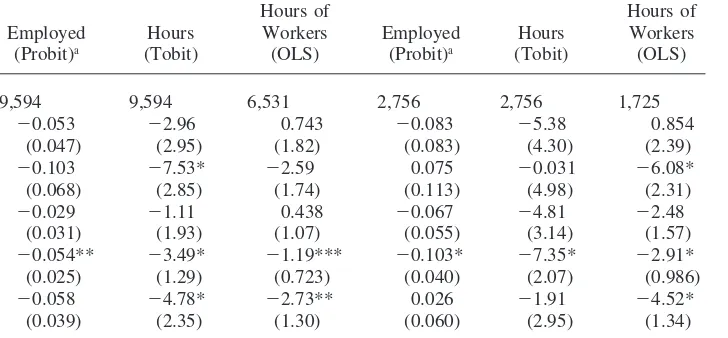
the disability definitions themselves and appear together in a single estimation equa-tion. The criteria are used to divide the disabled children into mutually exclusive categories. The first criterion is a limitation in the usual activities of children aged 0–5, which is a criterion of all three disability definitions. The second is a limitation in the ability to walk, run, or use stairs for 3–21 year olds who do not meet the first criterion. This is a criterion for Definitions 1 and 3 but not for Definition 2. The third criterion is a limitation in the ability to do schoolwork for 6–21 year olds (again, only if they do not meet the prior criteria). This is an underlying criterion of definitions two and three, but not of Definition 1. Finally, the other criteria for Definition 3 are divided into two variables. The first is for the receipt of therapy or diagnostic services to meet the developmental needs of children younger than six. The second consists of limits in activities of daily living (ADLs) and self-care for children 15 and older, other than ADLs that pertain directly to walking, running, or using stairs. As always, a full set of dummies is included in each specification to control for the variation in the universes of the child-age questions.
Results are presented in Table 4, Panel A for the cross-section. The criteria of limitations in the usual activities of very young children and limitations in ambula-tion (ability to walk, run, or use stairs) never significantly affect the dependent vari-able. This result is expected, as these criteria underlie disability Definition 1, which is never found to have a significant effect in the cross-section. The most influential criterion is limitations in the ability to do regular schoolwork, which has a negative effect on all work activity measures (at confidence levels of at least 90 percent) in both the wife and female head samples. The variables receipt of therapy and nonambulatory activity limits also have occasional negative effects. For coefficients that are estimated to be significantly different from zero, the effects on female heads are always more negative than those on wives.
The criteria specifications were also estimated for the one-year dynamic model (the two-year sample size is too small to generate enough observations in the appro-priate cells to conduct a meaningful analysis). Results are reported in Panel B of Table 4. For wives, no negative effects are found, and the effect of receiving therapy or diagnostic services has a positive effect on the change in hours. This is consistent with a lack of significant, negative disability results for wives in Table 3. The findings for female heads are also consistent with the pattern of disability findings presented in panel C of Table 3. Significantly negative effects of limitations in usual activities of very young children and in the ability to walk, run, and use stairs on the change in hours correspond to the negative effect of disability Definition 1. The negative effect of activity limits also corresponds to the marginally negative effect of disabil-ity Definition 1 on the probabildisabil-ity of a transition to work. The origin of the negative effect of disability Definition 3 on the probability of an increase in hours is not revealed by this decomposition.
Powers 537
Regional differences in the incidence of disability also suggest a potential sensitivity of the disability-related findings with respect to adding regional controls. The disabil-ity findings were quite robust with respect to including state fixed effects.
D. The Relative Importance of Child Disability in Explaining Maternal Labor Supply
The quantitative importance of the significant disability estimates can be assessed by comparing them with other factors influencing maternal work activity. Appendix 4 presents a full set of findings for selected specifications. All use the third and most comprehensive child disability variable. Because comparisons with family structure coefficients are of interest, the child-age universe dummy variables for the disability questions, which cloud the interpretation of the other family size and age structure variables, are excluded. The disability coefficients are little changed by their omis-sion. For wives, static findings for employment and desired hours specifications are reported. For female heads, the findings from the same static specifications are re-ported as well as findings for the change in hours and probability that initial nonwork-ers are working at the end of the subsequent two years. In addition to the explanatory variables listed in Appendix 4, month and panel dummy variables are included in each specification, as appropriate (their coefficients are all estimated to be insignifi-cant and are not reported).
In the static specifications, many explanatory variables are significant and have the expected signs. In contrast, in dynamic specifications, many variables’ coeffi-cients are insignificant. In explaining the path of work activity of female heads over this relatively brief (two-year) period, child disability, child-age variables, maternal health, economic conditions, and policy are influential. Children’s variables affect the time path of women’s work because of the life-cycle nature of caregiving bur-dens, while economic conditions and welfare policy variables tend to be correlated over time.12It should be noted that although only the findings for the most
compre-hensive disability definition are reported, the coefficient estimates for the other ex-planatory variables are quite insensitive with respect to alternative disability defini-tions.
The findings reported in Appendix 4, Table A4 reveal a substantial estimated impact of child disability relative to other influential factors. Generally, child disabil-ity effects on the static employment and hours variables are at least as important as the effects of having a young child. For wives, the effect of disability on employment is not significantly different from adding a child between ages five and 12 to the family, while the effect on desired hours is not significantly different from having a youngest child under five instead of a youngest child older than 12. For female heads, the employment effect is not insignificantly different from the family’s youn-gest child being younger than five, rather than being of grade school age, while the effect on desired hours is comparable to the youngest child in the family being less
538
The
Journal
of
Human
Resources
Table 4
Estimated Effects of Disability Criteria on Maternal Work Activity
Wives Female Heads
Panel A: Disability Criteria Specifications for Cross-Section Samples
Hours of Hours of
Employed Hours Workers Employed Hours Workers (Probit)a (Tobit) (OLS) (Probit)a (Tobit) (OLS)
Sample size 9,594 9,594 6,531 2,756 2,756 1,725
Limit, usual activities, 0–5 ⫺0.053 ⫺2.96 0.743 ⫺0.083 ⫺5.38 0.854 (0.047) (2.95) (1.82) (0.083) (4.30) (2.39) Therapy, diagnostic services to meet ⫺0.103 ⫺7.53* ⫺2.59 0.075 ⫺0.031 ⫺6.08* developmental needs, 0–5 (0.068) (2.85) (1.74) (0.113) (4.98) (2.31) Limit, walk, run, or stairs, 3–21 ⫺0.029 ⫺1.11 0.438 ⫺0.067 ⫺4.81 ⫺2.48
(0.031) (1.93) (1.07) (0.055) (3.14) (1.57) Limit, regular schoolwork, 6–21 ⫺0.054** ⫺3.49* ⫺1.19*** ⫺0.103* ⫺7.35* ⫺2.91* (0.025) (1.29) (0.723) (0.040) (2.07) (0.986) Limit, other, 15–21 ⫺0.058 ⫺4.78* ⫺2.73** 0.026 ⫺1.91 ⫺4.52*
Powers
539
Panel B: Disability Criteria Specifications for One-Year-Horizon Samples
Positive Positive
Change Change Begin Change Change Begin in Hours in Hours Work in Hours in Hours Work (OLS) (Probit)a (Probit)a (OLS) (Probit)a (Probit)a
Sample size 7,043 7,043 2,197 1,712 1,712 617
Limit, usual activities, 0–5 ⫺0.232 0.021 ⫺0.096 ⫺4.83** ⫺0.073 ⫺0.138* (1.62) (0.064) (0.060) (2.19) (0.064) (0.050) Therapy, diagnostic services to meet 4.13* 0.079 ⫺0.040 1.30 0.044 0.091
developmental needs, 0–5 (1.48) (0.057) (0.062) (2.96) (0.107) 0.179 Limit, walk, run, or stairs, 3–21 ⫺1.20 ⫺0.020 0.003 ⫺4.39** 0.030 ⫺0.053 (1.07) (0.033) (0.056) (1.94) (0.060) (0.076) Limit, regular schoolwork, 6–21 0.292 0.027 ⫺0.007 ⫺0.272 ⫺0.022 ⫺0.021
(0.701) (0.029) (0.037) (1.26) (0.041) (0.051) Limit, other, 15–21 0.103 ⫺0.007 ⫺0.076 1.37 ⫺0.049 0.107
(1.60) (0.071) (0.071) (2.61) (0.068) (0.146)
Source: Author’s estimates from the 1992 and 1993 panels of the Survey of Income and Program Participation.
Notes: Selected coefficient estimates reported with standard errors (adjusted for within-state clustering) in parentheses. All specifications include children’s characteristics (age category of youngest, number in each age category), maternal characteristics (age, education, race, and health), and macro-policy variables (state unemployment rate and measures of states’ AFDC and SSI generosity). For two-parent households, information on fathers (age, education, health) also is included. For the change in hours, mothers’ initial work hours also are included.
aProbability changes (evaluated at the sample means), rather than probit coefficients, are reported. For discrete variables, the probability change is for a change in the
variable from zero to one.
540 The Journal of Human Resources
than five instead of older than 12. The findings for female heads are qualitatively similar to those reported in Wolfe and Hill (1995). For the change in hours specifica-tion, the flattening effect of child disability on female heads’ two-year work profiles is not significantly different from an increase in the initial number of preschool chil-dren. The estimated reduction in the probability that a nonworking female head be-gins working over the subsequent two years is significantly larger (in absolute magni-tude) than that due to the presence of an additional grade-school-age child in the family at the beginning of the period.
V. Conclusion
The estimates of the impact of child disability on maternal work ac-tivity reported here make several advances over the previous literature. First, by pooling two SIPP panels, fairly large samples of affected children are assembled for the analyses, improving the reliability of the estimates. Second, multiple disability measures are employed and their underlying criteria are also examined in order to assess the sensitivity of the findings with respect to definition, improving understand-ing of the aspects of children’s health that matter most for maternal employment. Third, in addition to revisiting the much-studied issue of employment effects, hours specifications, and the effect of child disability on the profile of subsequent work activity are examined.
The static findings indicate large, negative responses of maternal employment and hours to child disability for disability definitions that incorporate limitations in the ability to do schoolwork (Definitions 2 and 3). These effects are quantitatively im-portant, as they are similar in magnitude to the effects of differences in family age structure that are the most unfavorable to maternal work. In dynamic two-year-horizon specifications all the disability variables have (at least marginally) negative effects on some work measure for the female head sample. In contrast, there is no evidence that the subsequent profile of wives’ work activity is negatively affected by child disability, regardless of how disability is measured.
The variation in findings across the disability definitions was further explored by estimating the influence of the individual underlying disability criteria on work. Most interestingly, this analysis revealed that the shift in the pattern of disability variable coefficients between static and dynamic specifications for female heads is due to a qualitative change in the set of influential criteria as one moves from the static to the dynamic work measures. For female heads, the dominant influence of schoolwork limitations in the static specifications yields to developmental problems of young children and (in the case of the change in hours) physical limitations of children older than two in the dynamic framework.
Powers 541
process. Mothers of young children with activity limitations, however, lag behind their peers in increasing their labor market activity, presumably because their care-giving burden does not diminish rapidly and remains an obstacle to work.13
Variation in sample size, disability definitions, and specifications all play roles in resolving this paper’s findings with previous ones. Kimmel (1997; 1998) uses a dis-ability definition akin to Definition 1 in this paper and fails to find a significant negative effect on female heads’ employment but a significant effect for wives. In fact, when a specification more similar to Kimmel’s is estimated for wives (most importantly, excluding husband’s characteristics), there is a significant negative ef-fect of the first disability definition, suggesting omitted variable bias may help ex-plain Kimmel’s (1998) finding (Kimmel 1998 also includes predicted wages and childcare prices in her specifications). In the case of female heads, the earlier finding appears to be sensitive to the inclusion of fitted wages and childcare prices. When specifications similar to Kimmel’s (which exclude most of the family age structure variables), but excluding wages and prices, are estimated for the samples used here, the effect of the first disability definition on female heads is negative.
An interesting question raised by the findings is why the effects on female heads’ labor supply are more robust across specifications and larger in absolute magnitude than those for wives. The SIPP time frame is short, and long-run effects on wives, while perhaps smaller, could still be economically important. Husbands may also buffer the impact of disability on wives by changing their own allocations of market work, housework, and caregiving. There is also the possibility, not confronted in this and earlier work, that unobserved maternal ability and children’s health are cor-related. It is possible that some portion of the negative effect of disability on female heads’ work activity is attributable to this correlation (specifically, if lower-ability women with worse labor market opportunities are more likely to report that their child has a health problem).14
Although this study, like others, has used the children’s health information at hand in a large data set, the improvement of children’s disability measures is an important objective. The validity of a disability measure depends on the issue under study. When studying the impact of children’s health problems on maternal labor supply, the question is how the child’s underlying health condition interacts with societal and familial supports to determine the caregiving burden on the mother. Thus, ques-tions that ask parents to assess the impact of condiques-tions on children’s functioning, such as the SIPP questions about the impact of health conditions on usual activities and schoolwork, contain valuable information beyond that contained in a simple notation of the presence or absence of various health conditions. In addition to asking questions about the limitations in children’s activities, the extensive literature on the impact of adults’ own health on their work activities suggests it is desirable to ask caregivers how much their children’s (or other family member’s) health problems limit their own activities, as in Meyers et al. (1998).15
13. It is likely that many of the children who are activity-limited ‘‘age into’’ the schoolwork limitation category.
542 The Journal of Human Resources
The findings have important implications for policy. Child health appears to be an important obstacle to labor market activity for female heads. Because female heads are the target of the work-based welfare reform effort, it is important that states consider including child disability as a criterion for exemption from time limits and perhaps shelter these women from the most onerous work requirements if appro-priate work supports cannot be provided.
Interesting questions await future work, ideally employing a longer panel data set. It would be useful to learn more about how child disability affects mothers’ work as their children age, in order to identify possible gaps in public services for disabled children. While the Individuals with Disabilities Education Act (IDEA) has focused on providing services to the parents of very young disabled children and universal access to public school is statutory, a lack of appropriate after-school care settings for older disabled children may have a greater influence on family earnings.16 In
future work, it should also be possible to assess these lost earnings (which are a primary rationale for SSI payments) and the extent to which families with disabled children are able to use conventional childcare services.
Powers
543
Appendix 1
Table A1
Studies of Maternal Work Activity and Child Health
Child Disability
Variable (Disability Effect on Mother’s
Study Data Set Samples Rate in Sample) Work Activity
Salkever 1982,JHR 1972 National Health 10,770 white wives; Activity or mobility lim- Reduces probability interview Survey 901 nonwhite wives; itation caused by a that work is a usual
1,022 white single chronic condition activity by 6 percent-mothers; 435 non- (4.2–8.5 percent) age points for white
white single mothers wives.
Salkever 1982,Eco- 1976 Survey of Income 5,885 white wives with Multiple variables, in- Schoolwork and
mobil-nomic Aspects of and Education no reported maternal cluding limitations in ity limitations reduce
Health health problems (con- schoolwork or atten- labor force partici-tains disabled child dance, other limita- pation
family oversample of tions, help with activi-2,685) ties of daily living
Breslau, Salkever, and Authors’ survey of 278 two-parent and 118 Child has cystic fibro- Reduces wives’ labor Staruch 1982,J. of Cleveland families one-parent families sis, cerebral palsy, force participation
Health and Social with specific severe myelodysplasia, or probability by 13
per-Behavior conditions; 456 ran- multiple physical centage points (with domly selected two- handicaps larger effects on low-parent and 95 one- income and black
parent comparison wives).
544
The
Journal
of
Human
Resources
Table A1(continued)
Child Disability
Variable (Disability Effect on Mother’s
Study Data Set Samples Rate in Sample) Work Activity
Blank 1989,JHR 1980 National Medical 475 female heads Average mean per- Reduces work hours; in-Care Utilization and ceived health status creases AFDC partici-Expenditure Survey of family members pation
Salkever 1990, 1976 Survey of Income 1,045 single mothers Limitations in play Reduces labor force
Research in Human and Education without health (ages 3–4); limita- participation about 5
Capital and problems (includes tions in play or regu- percentage points; no
Development disabled child family lar schoolwork effect on hours of oversample of 457) (5–17). (13.4 percent workers.
in population)
Wolfe and Hill 1995, 1984 SIPP 1,647 female heads Long-lasting physical Labor force
participa-JHR condition limiting tion and work hours
physical activities; reductions compa-mental condition rable to effects of limiting learning presence of young or schoolwork children.
(9 percent)
Kimmel 1997,Eastern 1987 SIPP 872 female heads Long-lasting physical, No effect on labor
Economic Journal mental, or emotional force participation condition that limits
ability to run, walk, or play (4.0 percent)
Kimmel 1988,REStat. 1987 SIPP 2,350 wives and 697 Long-lasting physical, Reduces wives’ labor female heads mental, or emotional force participation
Powers
545
Brady et al. 1998, Waves I and II of the Sample of 1,605 AFDC Chronic health problem Probability of leaving Working Paper California AFDC and AFDC-UP cases limiting activity; aid reduced by a
se-Household Survey in four California mother reports ‘‘dis- vere child disability counties, active in ability’’;
handicap-November 1992. ping condition (19.8 percent; 6.0 percent severe)
Acs and Loprest 1998, 1990 SIPP 761–792 AFDC recipi- Physical, learning, or No effect on probability
Journal of Public ents (depending on mental health condi- of leaving AFDC for
Policy Analysis& model) tion limiting usual ac- work
Management tivities (ages 0–6);
limitation in ability to do regular school-work (6–21); long-lasting condition lim-iting ability to run, walk, or use stairs (4–14). (12.3 per-cent)
Lukemeyer, Meyers, Wave II of the Califor- Sample of 1,267 AFDC Child receives SSI; Employment reduction and Smeeding 2000, nia AFDC Household and AFDC-UP cases chronic health prob- comparable to
addi-Journal of Marriage Survey (ca. 1995) in four California lem, disability, or tional preschool child &the Family counties, active in handicapping condi- in the family.
Reduc-November 1992. tion limiting amount tion in workers’ or kinds of activities hours comparable to (12.1 percent; 4.5 per- poor maternal health. cent severe).
Source: See reference section for complete citations.
546 The Journal of Human Resources
Appendix 2
Construction of Disability and other Health Variables
A. Definition 1
A child is defined as disabled (Definition 1) if a designated parent or guardian 15 years or older answers affirmatively to either of the questions: ‘‘Because of a physi-cal, learning or mental health condition, do any of . . .’s children under six years of age have any limitations at all in the usual kind of activities done by most children their age?’’ and ‘‘Do any of . . .’s children between the ages of three and 14 have a long lasting condition that limits their ability to walk, run or use stairs?’’ In addi-tion, a child older than 15 is designated disabled if the child uses a wheelchair or walker, has difficulty walking one-quarter of a mile, or has difficulty walking up one flight of steps.
B. Definition 2
A child is defined as disabled (Definition 2) if a designated parent or guardian 15 years or older of a child who lives in the household responds affirmatively to either of the questions: ‘‘Because of a physical, learning or mental health condition, do any of . . .’s children under six years of age have any limitations at all in the usual kind of activities done by most children their age?’’ or ‘‘Because of a physical, learning or mental health condition, do any of . . .’s children between the ages of six and 21 have limitations in their ability to do regular school work?’’
C. Definition 3
Children disabled under definitions one or two are also disabled under Definition 3. Children younger than six who receive therapy or diagnostic services designed to meet their developmental needs and children who are receiving SSI on the basis of their disability status are also considered disabled. Children 15 and older are also identified as disabled if they use special aids to walk; have difficulty with sensory and physical functional activities; have difficulty with ADLs and instrumental ADLs; or have specific listed impairments. Children 16 and older are also identified as disabled if they have limitations in the amount or kind of work they can do. See McNeil (1993) for further details.
D. Severe Disability
self-Powers 547
care activities, but who have mental retardation, a developmental disability, Alz-heimer’s disease, senility, or dementia listed as the cause of their limitations are also considered severely disabled. Within each group of children identified as disabled (according to definitions one, two, or three), the subset of severely disabled children can be identified as those who also meet these criteria.
E. Adult Health Self-Assessment
548
The
Journal
of
Human
Resources
Appendix 3
Table A3
Sample Statistics
Cross-Section One-Year-Horizon Two-Year-Horizon
Sample Sample Sample
Female Female Female
Wives Heads Wives Heads Wives Heads
Observations 9,594 2,756 7,043 1,712 2,814 645
Dependent variables
Labor force participation 0.681 0.626 0.687 0.640 0.679 0.623 (0.466) (0.484) (0.464) (0.480) (0.467) (0.485)
Usual weekly hours 23.90 23.77 23.98 24.22 23.36 23.30
(19.16) (20.06) (19.09) (19.82) (19.20) (19.67)
Change in hours NA NA 0.665 1.16 1.31 3.14
(13.40) (14.54) (5.08) (16.23) Increased hours over period (0/1) NA NA 0.241 0.227 0.278 0.290 (0.428) (0.419) (0.448) (0.454) Change from nonworker to worker (0/1) NA NA 0.212 0.230 0.293 0.292
(0.409) (0.421) (0.455) (0.456) (n⫽2206) (n⫽617) (n⫽904) (n⫽243) Children’s limitations
Limit, usual activities, 0–5 0.009 0.020 0.009 0.024 0.010 0.033 (0.096) (0.140) (0.092) (0.153) (0.101) (0.178) Therapy or diagnostic services to meet devel- 0.010 0.011 0.010 0.012 0.007 0.017
opmental needs, 0–5 (0.010) (0.105) (0.101) (0.110) (0.084) (0.130) Limit, walk, run, or stairs, 3–21 0.020 0.033 0.020 0.030 0.021 0.023
Powers
549
Limit, regular schoolwork, 6–21 0.048 0.074 0.049 0.074 0.050 0.087 (0.213) (0.262) (0.215) (0.261) (0.217) (0.282)
Limit, other, 15–21 0.014 0.021 0.009 0.016 0.015 0.022
(0.116) (0.145) (0.094) (0.127) (0.121) (0.146) Children’s other characteristics
[Youngest child 0–4] 0.412 0.335 0.413 0.320 0.425 0.333
(0.492) (0.472) (0.492) (0.466) (0.494) (0.472)
Youngest child 5–12 0.383 0.418 0.421 0.468 0.454 0.490
(0.486) (0.493) (0.494) (0.499) (0.498) (0.500)
Youngest child 13–21 0.204 0.247 0.166 0.213 0.120 0.177
(0.403) (0.432) (0.372) (0.409) (0.325) (0.382) Number of children under five 0.127 0.102 0.130 0.085 0.132 0.085
(0.378) (0.355) (0.373) (0.331) (0.376) (0.316) Number of children 5–12 0.503 0.449 0.547 0.495 0.552 0.515
(0.757) (0.762) (0.757) (0.790) (0.775) (0.757) Number of children 13–21 0.474 0.483 0.404 0.384 0.471 0.309
(0.766) (0.774) (0.673) (0.671) (0.621) (0.600) Maternal characteristics
Mother’s age 36.25 35.52 36.07 35.38 35.85 35.13
(7.27) (8.66) (6.82) (7.94) (6.55) (7.43) Mother less than high school 0.108 0.216 0.095 0.187 0.086 0.186 (0.310) (0.411) (0.293) (0.390) (0.281) (0.389) Mother high school graduate only 0.368 0.388 0.358 0.379 0.357 0.361
(0.482) (0.487) (0.479) (0.485) (0.479) (0.481)
Mother some college 0.447 0.360 0.463 0.390 0.462 0.405
(0.497) (0.480) (0.499) (0.488) (0.499) (0.491) [Mother college graduate] 0.077 0.037 0.084 0.044 0.095 0.048
(0.267) (0.189) (0.278) (0.206) (0.293) (0.214)
Mother black 0.067 0.302 0.060 0.299 0.055 0.268
(0.251) (0.459) (0.238) (0.458) (0.227) (0.443)
Mother white 0.885 0.663 0.895 0.663 0.897 0.699
550
The
Journal
of
Human
Resources
Table A3(continued)
Cross-Section One-Year-Horizon Two-Year-Horizon
Sample Sample Sample
Female Female Female
Wives Heads Wives Heads Wives Heads
[Mother other race] 0.047 0.035 0.044 0.038 0.048 0.033
(0.212) (0.184) (0.205) (0.191) (0.215) (0.178) Mother rates own health ‘‘excellent’’ 0.317 0.211 0.331 0.226 0.340 0.237
(0.465) (0.408) (0.471) (0.418) (0.474) (0.426) Mother rates own health ‘‘very good’’ 0.370 0.305 0.374 0.312 0.371 0.313
(0.483) (0.461) (0.484) (0.463) (0.483) (0.464) Mother rates own health ‘‘good’’ 0.247 0.328 0.236 0.325 0.231 0.316
(0.431) (0.470) (0.425) (0.469) (0.422) (0.465) Mother rates own health ‘‘fair’’ 0.054 0.119 0.048 0.106 0.046 0.096
(0.226) (0.324) (0.213) (0.308) (0.210) (0.295) [Mother rates own health ‘‘poor’’] 0.012 0.037 0.010 0.030 0.011 0.037
(0.107) (0.188) (0.101) (0.172) (0.106) (0.189) Husband’s characteristics
Father’s age 38.73 NA 38.52 NA 38.08 NA
(7.99) (7.52) (7.13)
Father less than high school 0.122 NA 0.103 NA 0.101 NA
(0.327) (0.304) (0.301)
Father high school graduate only 0.332 NA 0.330 NA 0.328 NA
(0.471) (0.470) (0.469)
Father some college 0.427 NA 0.443 NA 0.444 NA
(0.495) (0.497) (0.497)
[Father college graduate] 0.119 NA 0.124 NA 0.128 NA
(0.323) (0.330) (0.334)
Father rates own health ‘‘excellent’’ 0.335 NA 0.348 NA 0.360 NA
Powers
551
Father rates own health ‘‘very good’’ 0.372 NA 0.373 NA 0.379 NA
(0.483) (0.484) (0.485)
Father rates own health ‘‘good’’ 0.227 NA 0.220 NA 0.210 NA
(0.419) (0.414) (0.408)
Father rates own health ‘‘fair’’ 0.047 NA 0.043 NA 0.035 NA
(0.211) (0.203) (0.184)
[Father rates own health ‘‘poor’’] 0.019 NA 0.016 NA 0.016 NA
(0.137) (0.127) (0.125)
Macro-policy variables
State unemployment rate 6.89 7.02 6.88 7.04 6.88 7.05
(1.42) (12.36) (1.43) (1.38) (1.40) (1.35) Maximum AFDC benefit (family of three) 398.81 399.79 396.58 401.69 400.72 409.99
(148.49) (152.43) (145.82) (150.69) (146.25) (151.10) Maximum SSI benefit (individual child) 452.01 452.17 451.83 452.31 452.59 451.62
(30.14) (30.71) (29.83) (30.14) (30.58) (29.16) Interview characteristics
1992 panel 0.486 0.484 0.490 0.479 0 0
(0.500) (0.500) (0.500) (0.500)
1993 panel 0.514 0.516 0.510 0.521 1.0 1.0
(0.500) (0.500) (0.500) (0.500) (0.0) (0.0)
September interview 0.255 0.251 0.254 0.254 0.249 0.265
(0.436) (0.434) (0.436) (0.435) (0.433) (0.442)
October interview 0.240 0.260 0.245 0.255 0.260 0.245
(0.427) (0.439) (0.430) (0.436) (0.439) (0.430)
November interview 0.254 0.242 0.249 0.242 0.237 0.234
(0.435) (0.428) (0.432) (0.428) (0.425) (0.424)
December interview 0.252 0.247 0.252 0.250 0.254 0.256
(0.434) (0.432) (0.434) (0.433) (0.435) (0.437)
Source: Author’s computations from the 1992 and 1993 panels of the Survey of Income and Program Participation.
552
The
Journal
of
Human
Resources
Appendix 4
Table A4
Full Results for Selected Models (Comprehensive Disability Definition)
Wives Female Heads
Change
Employmenta Hours Employmenta Hours in Hours Begin Worka
(probit) (tobit) (probit) (tobit) (OLS) (probit)
Number of observations 9,594 9,594 2,756 2,756 645 243
Children’s characteristics
Disability Definition 3 ⫺0.058* ⫺3.62* ⫺0.064* ⫺5.34* ⫺3.29** ⫺0.190* (0.018) (0.93) (0.029) (1.50) (1.63) (0.055) Youngest child 5–12 0.085* 4.27* 0.019** 3.05** 0.979 0.058
(0.014) (1.74) (0.029) (1.47) (1.541) (0.097) Youngest child 13–21 0.126* 7.81* 0.107** 5.37* 1.06 0.091
(0.014) (1.01) (0.043) (1.91) (2.26) (0.157) Number of children under five ⫺0.116* ⫺8.37* ⫺0.165* ⫺11.79* ⫺3.13 ⫺0.058
(0.012) (0.828) (0.042) (1.94) (2.01) (0.073) Number of children 5–12 ⫺0.074* ⫺5.30* ⫺0.091* ⫺5.89* ⫺1.32 ⫺0.121* (0.007) (0.404) (0.016) (0.810) (0.86) (0.042) Number of children 13–21 ⫺0.015** ⫺1.09* ⫺0.022 ⫺1.23*** ⫺1.97*** 0.076
(0.006) (0.393) (0.014) (0.725) (1.06) (0.046) Maternal characteristics
Mother’s age 0.032* 2.07* 0.036* 2.60* ⫺0.568 0.005
(0.006) (0.41) (0.009) (0.44) (0.634) (0.032) Mother’s age-squared ⫺0.043* ⫺2.83* ⫺0.044* ⫺3.11* ⫺0.689 ⫺0.026
Powers
553
Mother less than high school ⫺0.035* ⫺20.08* ⫺0.507* ⫺25.09* ⫺6.90** 0.032 (0.024) (1.49) (0.058) (2.93) (3.14) (0.288) Mother high school grad only ⫺0.218* ⫺13.01* ⫺0.314* ⫺11.96* ⫺0.995 0.030
(0.021) (1.18) (0.075) (2.75) (2.91) (0.281) Mother some college ⫺0.162* ⫺9.44* ⫺0.222* ⫺7.14* 0.771 0.143
(0.019) (1.08) (0.072) (2.71) (2.86) (0.307)
Mother black 0.095* 3.33** ⫺0.103 ⫺6.79** ⫺0.98 0.052
(0.029) (1.63) (0.101) (3.02) (3.46) (0.211)
Mother white 0.028 ⫺1.55 0.002 ⫺1.02 ⫺0.265 0.183
(0.028) (1.29) (0.113) (2.90) (3.29) (0.172) Mother rates own health ‘‘excellent’’ 0.339* 22.12* 0.423* 38.76* 9.77** 0.302
(0.033) (2.95) (0.039) (3.75) (3.35) (0.185) Mother rates own health ‘‘very 0.343* 24.52* 0.434* 37.10* 6.89** 0.223
good’’ (0.035) (2.93) (0.051) (3.70) (3.29) (0.151)
Mother rates own health ‘‘good’’ 0.276* 21.43* 0.404* 33.64* 5.88*** 0.157 (0.031) (2.94) (0.052) (3.70) (3.25) (0.140) Mother rates own health ‘‘fair’’ 0.169* 13.35* 0.240* 22.55* 4.18 0.062
(0.031) (3.11) (0.052) (3.70) (3.57) (0.177) Macro-Policy variables
State unemployment rate ⫺0.032* ⫺1.74* ⫺0.023** ⫺1.24* ⫺0.725 ⫺0.031 (0.005) (0.21) (0.011) (0.43) (0.495) (0.022) Maximum AFDC benefit (family 0.001 ⫺0.429*** ⫺0.035* ⫺2.12* ⫺0.025 ⫺0.058**
of three)⫻$100 (0.007) (0.230) (0.009) (0.43) (0.444) (0.026) Maximum SSI benefit (individual 0.034 1.77 0.028 1.04 0.506 0.030* child)⫻$100 (0.033) (1.14) (0.066) (2.18) (0.503) (0.011)
Initial usual weekly hours ⫺0.431*
554
The
Journal
of
Human
Resources
Table A4(continued)
Wives Female Heads
Change
Employmenta Hours Employmenta Hours in Hours Begin Worka
(probit) (tobit) (probit) (tobit) (OLS) (probit)
Husband’s characteristics
Father’s age 0.013** 0.660***
(0.006) (0.341) Father’s age-squared ⫺0.017** ⫺0.853**
(0.008) (0.402) Father less than high school 0.111* 9.39*
(0.017) (1.31) Father high school grad only 0.137* 10.07* (0.016) (1.05) Father some college 0.109* 7.73* (0.013) (0.94) Father rates own health ‘‘excellent’’ 0.005 ⫺0.39
(0.033) (2.09) Father rates own health ‘‘very 0.024 1.49
good’’ (0.032) (2.06)
Father rates own health ‘‘good’’ 0.013 1.18 (0.031) (2.07) Father rates own health ‘‘fair’’ 0.046 1.71
(0.033) (2.32)
Source: Author’s estimates from the 1992 and 1993 panels of the Survey of Income and Program Participation.
Notes: Selected coefficient estimates reported with standard errors (adjusted for within-state clustering) in parentheses. Disability coefficients differ from those reported in Table 3 due to the exclusion of the set of child-age-universe variables from the specifications. Survey month and panel dummies are also included, as appropriate, but coefficient estimates are not reported.