Locus of Control and Human
Capital Investment Revisited
Merve Cebi
a b s t r a c t
This paper examines the effect of teenagers’ outlooks—specified as their locus of control—on educational attainment and labor market outcomes. I replicate the study of Coleman and DeLeire (2003) and test the predictions of their theoretical model using a different data set—National Longitudinal Survey of Youth (NLSY). The findings fail to support the predictions of the model and suggest that locus of control is not a significant determinant of educational outcomes once cognitive ability is controlled for; however, locus of control is rewarded in the labor market later in life.
I. Introduction
The determinants of educational attainment have been the subject of intensive research. A consensus has emerged that certain variables affect education, including socioeconomic variables, family background measures, and personal attributes such as cognitive and noncognitive skills. In an attempt to identify the im-pact of noncognitive skills, a strand of literature has focused attention on the social-psychological concept of ‘‘locus of control,’’ which measures the extent to which an individual believes she has control over her life (internal control) as opposed to be-lieving that luck controls her life (external control).
The early empirical literature was limited to including locus of control in wage or educational attainment regressions along with measures of cognitive skill. (See, for example, Andrisani 1977, 1981). Findings from this literature suggested that internal locus of control is related to higher educational attainment and higher earnings. However, a key concern in the early literature is that internal locus of control could merely be a proxy for unobserved ability, which could itself increase education and earnings.
Merve Cebi is a doctoral student in the department of economics at Michigan State University. He thanks Jeff Biddle, Thomas DeLeire, Joanne Lowery, Stephen Woodbury, and an anonymous referee for helpful comments. The data used in this article can be obtained beginning May 2008 through April 2011 from Merve Cebi at Michigan State University, Department of Economics, 110 Marshall-Adams Hall, East Lansing, MI 48824-1038 (email: cebimerv@msu.edu).
[Submitted October 2005; accepted September 2006]
ISSN 022-166X E-ISSN 1548-8004Ó2007 by the Board of Regents of the University of Wisconsin System
To distinguish between the effects of locus of control and the effects of ability, the subsequent literature has begun to explore the mechanism by which locus of control affects educational outcomes. In particular, Coleman and DeLeire (2003) present a model of human capital investment that explicitly incorporates locus of control. This model distinguishes among four groups of teenagers:
• Internal Graduates—teenagers who graduate from high school and believe that graduating will lead to higher wages and higher-skill occupations
• External Graduates—teenagers who graduate from high school but do not be-lieve that graduating will lead to higher wages or higher-skill occupations
• Internal Dropouts—teenagers who drop out and believe that dropping out will lead to lower wages and worse occupational outcomes
• External Dropouts—teenagers who drop out and do not believe that dropping out will lead to lower wages or worse occupational outcomes
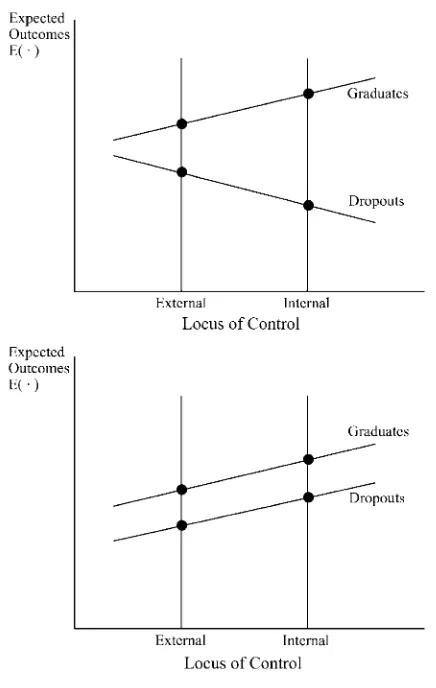
Coleman and DeLeire’s model implies that, among high school graduates, internal teenagers will say they expect higher earnings in the future than external teenagers— that is, Internal Graduates will have higher earnings expectations than External Graduates. However, among dropouts, the model implies the opposite—that is, In-ternal Dropouts will have lower earnings expectations than ExIn-ternal Dropouts (Coleman and DeLeire 2003, equation 5). The intuition behind this asymmetry, which is depicted in the top panel of Figure 1, is that internal teenagers perceive a re-lationship between their current actions and future outcomes, whereas external teen-agers do not.
Coleman and DeLeire contrast their model with an alternative model in which lo-cus of control is simply a proxy for ability. This alternative model does not produce the asymmetric effect of locus of control on expected outcomes (conditional on educational attainment). Rather, if locus of control is simply an aspect of ability, in-ternal teenagers will expect better outcomes than exin-ternal teenagers, regardless of whether they graduate from high school, as shown in the bottom panel of Figure 1. Thus, Coleman and DeLeire’s model and the alternative ability-based model offer distinct and empirically testable implications.
Using data from the National Education Longitudinal Study (NELS), Coleman and DeLeire find evidence that supports their model. Consistent with the predicted pat-tern of expectations, Inpat-ternal Dropouts expect to receive lower wages and to be in lower-skilled occupations than do External Dropouts.
This study reexamines the effect of locus of control on educational attainment and tests the predictions of Coleman and DeLeire’s model using data from the National Longitudinal Survey of Youth (NLSY). First, I investigate whether locus of control is an important predictor of educational attainment for a teenage sample of 10th and 11th graders in 1979. Second, given information on these teenagers’ educational attain-ment three years later, I examine the effect of locus of control on their occupational expectations. Third, the NLSY provides an opportunity to study the subsequent labor market outcomes of the teenage sample. Because the respondents are between the ages of 37 and 45 as of the 2002 survey, it is possible to examine the impact of teenagers’ locus of control on their adult earnings.
II. Data
The NLSY is a sample of 12,686 young men and women between the ages of 14 and 22 at the time of the first interview in 1979. Since their first interview, they have been reinterviewed annually until 1994, and biennially from 1996 to the present.
The NLSY consists of three subsamples: a representative sample of the noninstitu-tionalized civilian youths; an oversample of blacks, Hispanics, and economically dis-advantaged whites; and a sample of respondents who were enlisted in the military. In this study, I use the nationally representative sample of 6,111 respondents in order to derive estimates using a random sample. Observations are included if (1) respondents had valid measures of education for the years 1979–82; (2) information on respond-ents’ locus of control scale was available; (3) respondents were in the 10thor 11thgrade in 1979.1Applying these restrictions resulted in a final sample of 1,737 individuals.
The Rotter Internal-External Locus of Control Scale, collected in the 1979 survey, is a four-item questionnaire designed to measure the extent to which individuals believe they have control over their lives (internal control) as opposed to believing that luck controls their lives (external control). Respondents were asked to select one of each of four paired statements,2and then decide if the selected statement was much closer or slightly closer to their opinion of themselves. A four-point scale was generated for each of the paired items, and the resulting scores are individually standardized. The average of the standardized scores is used to create the locus of control scale. Higher scores indicate greater internal control, whereas lower scores indicate greater external control.
In 1980, the NLSY data were supplemented by a series of achievement tests known as the Armed Forces Vocational Aptitude Battery (ASVAB). The scores for selected parts of the ASVAB are then used to construct a composite Armed Forces Qualifications Test (AFQT) score for each respondent. The NLSY provides the raw and standard scores for each subset of the ASVAB, as well as two percentile scores: an AFQT80 and an AFQT89.3
1. Ninth graders are not included in the sample because although most students would have graduated from high school, they would not be old enough to attend college by the time of the 1982 survey. The results for high school graduation are robust to the inclusion of ninth graders. For sake of brevity, these results are not reported but are available from the author upon request.
2. 1. (a) What happens to me is my own doing; or (b) Sometimes I feel that I do not have enough control over the direction my life is taking.
2. (a) When I make plans, I am almost certain that I can make them work; or (b) It is not always wise to plan too far ahead, because many things turn out to be a matter of good or bad fortune anyhow. 3. (a) In my case, getting what I want has little or nothing to do with luck; or (b) Many times, we might
just as well decide what to do by flipping a coin.
4. (a) Many times, I feel that I have little influence over the things that happen to me; or (b) It is im-possible for me to believe that chance or luck plays an important role in my life.
3. The two AFQT measures differ in the methods used to calculate the scores. The AFQT80 measure is constructed as the sum of the following subtests of the ASVAB: word knowledge, paragraph comprehen-sion, arithmetic reasoning, and numerical operations. Beginning in 1989, a new formula has been used to calculate a revised percentile score called the AFQT89. The three subtests used in the 1989 scoring version of the AFQT score are verbal, math knowledge, and arithmetic reasoning. Rest of the ASVAB includes the following subtests: mechanical comprehension, general science, electronics information, auto and shop in-formation, and coding speed. Attachment 106 to the NLSY documentation describes the ASVAB subtests in detail.
The percentile scores are the most widely used measures of ability by researchers. However, Blackburn (2004) discusses that the AFQT percentile ranking is not a cor-rect measure of ability since ability follows a normal distribution while a percentile follows a uniform distribution. He advises the use of raw or standard scores as a more appropriate measure of the AFQT performance. In this study, the AFQT measure is constructed as the sum of standard scores for the verbal, math knowledge, and arith-metic reasoning subtests of the ASVAB.
The implications of Coleman and DeLeire’s model concern the labor market expectations of teenagers conditional on educational attainment. It thus is essential to have information on expectations collected after the decision about educational attainment has been made. In the 1979 and 1982 surveys, NLSY respondents were asked about their ‘‘Occupational Expectations at Age 35 (Census 3-Digit).’’ Since the sample used in this analysis consists of 10thand 11thgraders in 1979, occupa-tional aspiration of teenagers is extracted from the 1982 survey along with informa-tion on their graduainforma-tion and college enrollment status.4
Table 1 presents descriptive statistics for teenagers by their educational level in 1982. Out of 1,737 observations, 1,370 graduated from high school but only 545 had attended college as of 1982. Teenagers who graduated from high school come from higher income families and have a significantly higher locus of control score than teenagers who dropped out of high school, 0.043 versus -0.172. Similarly, the locus of control score of teenagers who attended college (0.141) is significantly higher than of teenagers who did not (-0.068). Both mothers and fathers of teenagers who attended college obtained more education on average and were more likely to have worked as a professional or manager than those of teenagers who did not attend college.
III. Estimation Method and Results
A. Locus of Control and Educational AttainmentIn Table 2, the left-hand panel shows the estimated marginal effects of locus of con-trol on high school graduation from probit models. The right-hand panel reports the estimated marginal effects on college attendance. The basic specification is presented in Column 1. It includes dummy variables indicating race, ethnicity, gender, age, res-idence in an SMSA, and resres-idence in an urban area as controls. According to these estimates, locus of control is an important predictor of educational attainment for teenagers. A one-standard-deviation increase in locus of control is estimated to in-crease the probability of high school graduation by 5.4 percent, and the probability of college attendance by 7.4 percent.
Column 2 adds indicators of parental education as controls to the basic model. The estimated marginal effect of locus of control remains both economically and statis-tically significant. In particular, a one-standard-deviation increase in locus of control is estimated to increase teenagers’ probability of graduating from high school by
4. I use the revised version of the Highest Grade Completed variable to identify high school graduates and college attendees.
Table 1
Summary Statistics for Key Variables by Education Level
Entire Sample
High School Graduates
High School Dropouts
Attended College
Did not Attend College
High school graduate 0.789 (0.408) 1 (0) 0 (0) 1 (0) 0.692 (0.462) Attended college 0.314 (0.464) 0.398 (0.490) 0 (0) 1 (0) 0 (0) Locus of control 20.003 (0.574) 0.043 (0.562) 20.172 (0.587) 0.141 (0.543) 20.068 (0.576) AFQT 195.857 (35.277) 203.610 (32.164) 166.009 (30.535) 221.361 (26.551) 184.018 (32.453) Family income 20,718 (14,028) 22,615 (14,116) 13,528 (11,069) 26,999 (15,838) 17,879 (12,110) Father’s education
Less than high school 0.401 (0.490) 0.336 (0.472) 0.643 (0.480) 0.167 (0.373) 0.508 (0.500) High school 0.331 (0.471) 0.353 (0.478) 0.248 (0.432) 0.308 (0.462) 0.341 (0.474) Some college 0.104 (0.306) 0.115 (0.320) 0.063 (0.243) 0.156 (0.363) 0.081 (0.272) College and beyond 0.164 (0.370) 0.196 (0.397) 0.046 (0.210) 0.369 (0.483) 0.070 (0.256) Mother’s education
Less than high school 0.376 (0.485) 0.310 (0.463) 0.621 (0.486) 0.145 (0.352) 0.482 (0.500) High school 0.445 (0.497) 0.481 (0.500) 0.311 (0.463) 0.495 (0.500) 0.422 (0.494) Some college 0.089 (0.285) 0.103 (0.304) 0.038 (0.192) 0.154 (0.361) 0.060 (0.237) College and beyond 0.090 (0.286) 0.106 (0.308) 0.030 (0.171) 0.206 (0.404) 0.037 (0.189) Father’s occupationa 0.219 (0.414) 0.249 (0.433) 0.106 (0.309) 0.406 (0.491) 0.133 (0.340) Mother’s occupationa 0.083 (0.276) 0.094 (0.292) 0.041 (0.198) 0.163 (0.370) 0.046 (0.210) Number of observations 1,737 1,370 367 545 1,192
Notes: a. A dummy variable indicating adult male (or female) in household worked as a professional or manager when the respondent was 14 years old. Standard
devia-tions are reported in parentheses. Cebi
Table 2
Marginal Effects of Locus of Control on Educational Attainment from Probit Models
High School Graduation College Attendance
(1) (2) (3) (4) (5) (1) (2) (3) (4) (5)
Locus of control 0.094 (0.017) Parental education No Yes Yes Yes Yes No Yes Yes Yes Yes Family structure No No Yes Yes Yes No No Yes Yes Yes Home life No No No Yes Yes No No No Yes Yes
AFQT No No No No Yes No No No No Yes
Observations 1,737 1,737 1,394 1,394 1,350 1,737 1,737 1,394 1,394 1,350 PseudoR-square 0.20 0.24 0.26 0.27 0.32 0.11 0.24 0.25 0.25 0.34
Notes: All specifications include dummy variables indicating age and residence in an SMSA. Model 2 also controls for father’s and mother’s education. Family structure includes family income, and occupation of both father and mother. Home life includes dummy variables indicating teenagers or a family member regularly received magazines, newspapers, and held a library card when they were at the age of 14. Standard errors are reported in parentheses.
4.6 percent, and their probability of attending college by 5.7 percent. The addition of family income and parents’ occupation status in Column 3 produces very similar results to those obtained from previous specifications.
Column 4 adds dummy variables indicating whether teenagers received maga-zines, newspapers, and held a library card at age 14. The estimated marginal effects are essentially similar and still statistically significant. A one-standard-deviation in-crease in locus of control is associated with a 3.8 percent inin-crease in teenagers’ like-lihood of graduating from high school.
Column 5 adds teenagers’ AFQT score as a control for cognitive ability. With this addition, the estimated marginal effect of locus of control drops and becomes much less significant. The estimated marginal effect of locus of control on high school graduation is 0.026, with at-statistic of 1.44 (p-value = 0.15). This implies that a one-standard-deviation increase in locus of control increases the probability of high school graduation by 1.5 percent. The marginal effect of locus of control on college attendance is 0.04, which is significant only at the 10-percent level. This implies that a one-standard-deviation increase in locus of control increases the probability of college attendance by 2.3 percent. The results in Column 5 suggest that locus of control is capturing the marginal effect of the AFQT score on educational attainment in Columns 1–4. The locus-of-control estimates in Columns 1–4 suffer from omitted variable bias. The simple correlation between locus of control and AFQT is 0.28.
B. Locus of Control and Occupational Expectations
I follow Coleman and DeLeire and estimate the following by OLS,
occexp35 =Xb+d1internal3grad+d2average3grad+d3external3grad +d4internal3dropout+d5average3dropout
+d6external3dropout+u;
ð1Þ
occexp35 =Xb+d1internal3college+d2average3college +d3external3college+d4internal3ncollege +d5average3ncollege+d6external3ncollege+u;
ð2Þ
where the dependent variable is a dummy variable indicating that the teenager expects to work in a high-skilled occupation (defined as a professional or manager) at age 35. Controls include race, ethnicity, gender, age, residence in an SMSA and in an urban area, and AFQT.
The locus-of-control score of teenagers measured in 1979 is used to construct three dummy variables. The variableinternal equals one if the teenager is above the 75thpercentile of the locus of control range. The 25thto 75thpercentiles are de-fined as average, and values below the 25th percentile are defined as external. The variablesgradanddropoutare indicators of whether the teenager had graduated from high school or dropped out of high school as of 1982. Similarly,collegeand ncol-legeare dummy variables indicating whether the teenager did or did not attend college. Table 3 reports the predicted expectations of being in a high-skilled occupation at age 35 that result from estimating Equation 1 in the top panel and Equation 2 in the
Table 3
Predicted Occupational Expectations at Age 35
High School Graduates and Dropouts
(1) No controls (2) Controls excluding AFQT (3) Controls including AFQT
College Attendees and Nonattendees
(1) No controls (2) Controls excluding AFQT (3) Controls including AFQT
College No College Difference College No College Difference College No College Difference
Internal locus 0.65
Observations 1,737 1,737 1,678
Notes: Specification 1 includes no control variables. Specification 2 includes dummy variables indicating race, ethnicity, gender, age, residence in an SMSA, and residence in an urban area. Specification 3 adds AFQT to the controls in Specification 2. Standard errors are in parentheses. In brackets are robust standard errors.
Cebi
bottom panel. Each panel shows predicted occupational expectations for six groups of teenagers: high school graduates (or college attendees) with internal, average, or external locus of control and dropouts (or noncollege attendees) with internal, aver-age, or external locus of control. For each group, three predictions are shown: those from (1) a specification that includes no control variables; (2) a specification that controls for race, ethnicity, gender, age, and residence in an SMSA and in an urban area; and (3) a specification that controls for AFQT in addition to the controls in Specification 2.
The results in Table 3 suggest that Internal Dropouts have basically the same oc-cupational expectations as External Dropouts. Similarly, internal noncollege attend-ees have roughly the same expectations as external noncollege attendattend-ees. This implies that the pattern predicted in Coleman and DeLeire’s model is not apparent in these data.
Another way to distinguish between the two models is to test whether the gap be-tween Internal and External Graduates’ expectations differs from that bebe-tween Inter-nal and ExterInter-nal Dropouts. To see this, recall first that in both the Coleman-DeLeire model and the alternative ability-based model, we should observe only a small (if any) difference in expectations between External Graduates and External Dropouts (compare the top and bottom panels of Figure 1). Recall next that in the Coleman-DeLeire model, Internal Graduates have higher expectations than External Gradu-ates, and Internal Dropouts have lower expectations than External Dropouts (as shown in the top panel of Figure 1), so there is a large gap between the expectations of Internal Graduates and Internal Dropouts. In the alternative model, in contrast, In-ternal Graduates have higher expectations than ExIn-ternal Graduates, and InIn-ternal Dropouts will have higher expectations than External Dropouts, so there is only a small expectations gap between Internal Graduates and Internal Dropouts (bottom panel of Figure 1). Together, these predictions suggest that if we estimate the differ-ence-in-differences between External Graduates and External Dropouts, and Internal Graduates and Internal Dropouts, an estimate statistically different from zero would support the Coleman-DeLeire model.
Table 3 presents the findings on differences in occupational expectations for high school graduates and dropouts. The third column in each panel shows the difference between high school graduates and dropouts for each group (internal, average, and external teenagers). The fourth row reports the difference between internal and exter-nal teenagers for both high school graduates and dropouts. Fiexter-nally, the difference-in-differences estimates are presented in the last row. Parallel findings for college attendees and nonattendees are given in the bottom panel of Table 3.
In all specifications, the difference-in-differences estimate is close to zero and sta-tistically insignificant. Once again, the predictions of Coleman and DeLeire’s model are not borne out in these data.
C. Locus of Control and Wages
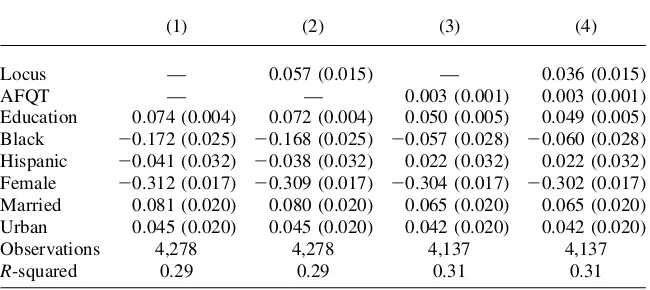
residence in an SMSA and in an urban area, a quadratic in age, and a set of occupa-tional dummies. Column 2 adds locus of control, Column 3 adds the AFQT score, and Column 4 includes both.
Based on the estimates in Table 4, the return to a year of education without con-trolling for any measures of ability is 7 percent. As shown in Column 2, adding locus of control does not affect this estimate. However, with the addition of the AFQT score in Column 3, the estimated return falls to 5 percent, which reflects the familiar ability bias in the estimated returns to schooling. Adding locus of control in Column 4 leaves the estimates unchanged relative to those in Column 3. The coefficient on locus of control is 0.036 and is statistically significant at the 5 percent level. Figure 1
Relationships between expected outcomes and locus of control for high school graduates and dropouts in the Coleman-DeLeire model (top) and when locus of control is a proxy for ability (bottom)
A one-standard-deviation increase in locus of control increases hourly wages by 2.1 percent, while a-one-standard-deviation increase in the AFQT score leads to an 11.5 percent increase in hourly wages. These results suggest that locus of control is in fact capturing a distinct aspect of ability not related to cognitive ability as measured by the AFQT. Combined with the findings in Section IIIB, the results suggest that, al-though locus of control is not a significant determinant of educational outcomes, it is rewarded in the labor market through higher wages.
IV. Discussion and Conclusion
Using data from the NLSY, the analysis in this paper yields three main findings. First, there is no evidence that locus of control predicts high school graduation and little evidence that it predicts college attendance once the AFQT score is included in models of educational attainment (Section IIIA). Second, Inter-nal Dropouts have basically the same occupatioInter-nal expectations as ExterInter-nal Drop-outs, as do internal noncollege attendees and external noncollege attendees (Section IIIB). Third, locus of control measures a distinct skill not captured by the AFQT, and this skill brings a reward in the labor market (Section IIIC).
The finding that locus of control does not predict educational attainment conflicts with Coleman and DeLeire’s results. Using data from the NELS, they find that locus of control strongly affects educational attainment, presumably by influencing teen-agers’ assessments of the returns to education. One possible reason for the difference between their findings and mine could be that the cognitive ability tests available in the NELS differ from those in the NLSY. The NELS contains standardized scores in Table 4
Effects of Locus of Control on Adult Wages
(1) (2) (3) (4)
Locus — 0.057 (0.015) — 0.036 (0.015)
AFQT — — 0.003 (0.001) 0.003 (0.001)
Education 0.074 (0.004) 0.072 (0.004) 0.050 (0.005) 0.049 (0.005) Black 20.172 (0.025) 20.168 (0.025) 20.057 (0.028) 20.060 (0.028) Hispanic 20.041 (0.032) 20.038 (0.032) 0.022 (0.032) 0.022 (0.032) Female 20.312 (0.017) 20.309 (0.017) 20.304 (0.017) 20.302 (0.017) Married 0.081 (0.020) 0.080 (0.020) 0.065 (0.020) 0.065 (0.020) Urban 0.045 (0.020) 0.045 (0.020) 0.042 (0.020) 0.042 (0.020)
Observations 4,278 4,278 4,137 4,137
R-squared 0.29 0.29 0.31 0.31
Notes: The dependent variable is the log(hourly wage) in 2000. In addition to the variables shown, all spec-ifications include a quadratic in age, a set of occupational dummy variables, and a dummy for residence in an SMSA. Heteroskedasticity-robust standard errors are in parentheses.
math, reading, science, and history given when students were in the 8thgrade. To make the cognitive ability tests in the NLSY as close as possible to those in the NELS, I do two things. First, I use the sum of standard scores in the verbal, math knowledge, and arithmetic reasoning subtests of the ASVAB, and I omit the rather specific subtests such as ‘‘electronics information’’ or ‘‘coding speed.’’ Second, I in-clude dummy variables that identify one of eight age groups. My sample of 10thand 11thgraders in 1979 who took the ASVAB tests in 1980 consists of students who were between the ages of 15 and 22. By including age dummies, I attempt to control for effects of age at the time the test is taken. Also, I reestimate all the models using different subtests of the ASVAB to allow each to potentially reflect a different skill. These changes, however, do not affect the findings. Hence, there is a real puzzle—the NELS and NLSY give quite different results.
The finding that locus of control is unrelated to teenagers’ occupational expecta-tions in the NLSY also conflicts with Coleman and DeLeire’s findings from the NELS. A complete test of the predictions of Coleman and DeLeire’s model requires information on teenagers’ income expectations in addition to their occupational ex-pectations. However, a question about income expectations is not available in the NLSY, so I am unable to test whether locus of control affects income expectations, and my empirical test is incomplete. It follows that my findings in Section IIIB hardly provide a convincing rejection of the Coleman-DeLeire model. This is partic-ularly true given the fact that Coleman and DeLeire find stronger results for income expectations than for occupational expectations.5
The finding that locus of control is associated with higher subsequent earnings is consistent with the results from previous research by Andrisani (1977). The estimates based on the NLSY data suggest that, although the return to locus of control is smaller than the return to the AFQT, it is still substantial.
While the data used in this study do not fit the Coleman-DeLeire model that ex-plicitly incorporates locus of control into the human capital investment model, this does not mean that we should abandon the Coleman-DeLeire model and return to the simplistic view of the early empirical literature. Rather, future research should more fully examine the mechanisms by which locus of control affects educational attainment and economic outcomes. Whether attitudes developed during childhood years—as captured by a concept like locus of control—have long-term impacts on economic outcomes is both important and intrinsically interesting. Locus of control is potentially important in analyzing the investments parents, schools, and the public sector make in children.
5. To see ifactualwages differ between Internal Dropouts and External Dropouts, I have included an in-teraction term between locus of control and educational attainment in the wage model. The estimates (not reported here but available upon request) suggest that Internal Dropouts earn, on average, about $2 (in year 2000 dollars) more per hour than External Dropouts; however the estimated difference is insignificant (p-value = 0.16) at conventional significance levels using robust inference.
References
Andrisani, Paul. 1977. ‘‘Internal-External Attitudes, Personal Initiative, and the Labor Market Experience of White and Black Men.’’Journal of Human Resources12(3):308–28. ———. 1981. ‘‘Internal-External Attitudes, Sense of Efficacy, and Labor Market Experience:
A Reply to Duncan and Morgan.’’Journal of Human Resources16(4):658–66. Blackburn, McKinley. 2004. ‘‘The Role of Test Scores in Explaining Race and Gender
Differences in Wages.’’Economics of Education Review23(6):555–76.