Multivariate multilevel model of well-being across
Europe during the crisis
Adi Pierewan and Gindo Tampubolon
15 March 2011
Abstract
The crisis in Europe in 2007 has detrimental effect on its citizens’ well-being including on both happiness and health. Most studies of well-being use health or happiness as a single outcome. They either explain happiness in terms of health (and other factors) or conversely health in terms of happiness. Even more, a few studies include contextual effects at both NUTS 2 and NUTS 3 levels in explaining well-being. This study investigates the individual and (a relatively detailed at NUTS 3) contextual factors, in explaining covariation in happiness and health. We thus use multivariate multilevel model to explain two well-being aspects: happiness and health not separately, but simultane-ously. We focus on countries across Europe during the crisis by using data from European Values Study 2008. Because of large number of missing data especially in income data and NUTS 3 level data, we use the recently developed multiple imputation using Bayesian estimation to deal with the problem. We find that determinants of both happiness and health are quite similar. Both at individual and NUTS 3 levels, happiness and health are strongly and positively correlated. Education, income and GDP growth are positively associated with happiness and health. Conversely, age, individual unemployment, unemploy-ment rates in NUTS 3 level are negatively associated with happiness and health.
Keywords: Well-being, Happiness, Health, Multivariate multilevel model, Multilevel multiple imputation, Bayesian estimation
1
Introduction
It is important to study happiness and health simultaneously for three reasons. First, both health and happiness are often subjectively elicited. They are neither neurologically measured (happiness) nor clinically measured (health). Arguably as subjective perception, health assessment may involve affect (happiness) and happiness assessment may involve health consideration. Second, some studies have argued that happiness and health can be treated as independent and dependent variables for each other (Blanchflower, 2004; Graham, 2008). Lastly, a simultaneous or multivariate study will generate important insights on two key variables of well-being especially in Europe during the crisis.
There are three studies (Subramanian et al. 2005; Oshio and Kobayashi, 2010; Kristen et al., 2007) which are an exception in the literature that examine the deter-minants of both happiness and health simultaneously. Another study using British Household Panel Survey examines happiness and subjective well-being but not health (Ballas and Tranmer, 2008). The European study conducted by Kristen et al. (2007) uses data from the European Social Survey 2002 and 2004 and thus has not covered the period during the crisis in Europe in 2007. Moreover, the vast majority of studies on well-being use individual and/or country level, do not cover regions level.
This paper aims to investigate demographic and socio-economic covariates in happiness and health at individual and their contextual levels across Europe. Since we analyse individual respondents nested in regions, two-level or multilevel model is appropriate. Two individual outcomes (happiness and health) are explained si-multaneously so we ultimately use multivariate multilevel approach for the analysis. We also deal with the problem of missing data. Data are missing at the region and individuals level. Because the structure of the data is multilevel, we use multilevel multiple imputation method.
This paper is organised as follows: first, we identify the determinant of happiness and health based on previous studies. We then describe the data and method used in this study, including the construction of the covariates. In the penultimate sec-tion we present the results and lastly conclude with theoretical and methodological implications for future research.
2
Determinants of Happiness and Health
Several studies (Subramanian et al. 2005; Oshio and Kobayashi, 2010) find that the determinants of happiness and health are relatively similar. However, some de-terminants have different effects on happiness and health when both are explained simultaneously.
Gender has been identified as an important predictor for happiness and health. However, the effect of gender tends to be different in direction. Oswald (1997) notes that women are more likely to be happy, but they are less likely to be healthy than men (Subramanian et al. 2002).
is slightly positive (Argyle, 1999); older people are likely to be happier than younger ones. However, previous studies also found a U-shaped relationship between age and happiness (Clark, 2003; Blanchflower and Oswald, 2008). People tend to be happier when they are younger or older than when they are middle aged. This debate is still continuing in the literature. Similar pattern can be found in health in which age is associated with this outcome inconsistently. Negative association between age and self-reported health has been demonstrated by Song and Lin (2009) who use a sample from Taiwan. A weak positive association is shown by Subramanian et al. (2005) using Social Capital Benchmark Survey across the US.
Education may be one of the most important determinants of happiness and health. As a human capital indicator this covariate predicts well-being status. Some authors find that the association between education and happiness is positive (Diener et al. 1993; Stutzer and Frey, 2008; Diener and Oishi, 2000). However, Clark and Oswald (1997) demonstrate the negative relationship between education and happi-ness. This may be due to the increase of aspiration of people with higher level of education. Subramanian et al. (2005) show that education is strongly correlated with both happiness and health.
The impact of marital status on happiness is reported in some studies. Married people benefit socially and emotionally from their spouses. They can share with and support each other. This argument is supported by previous studies (Clark and Oswald, 2002; Graham, 2009) that demonstrate the positive effect of marriage on happiness, and the negative effect of widowhood and divorce on happiness. However, Diener and Biswas-Diener (2008) argue that the benefit of being married depends on the people’s personality and their context of life.
Marriage can also influence health. Social support provided by a partner in a marriage may benefit individual’s health. As can be seen from previous research, for instance Song and Lin (2009), social support has been identified as strong predictor of self-rated health. The study finds that marital status has strong positive effect on self-rated health. Another study by Subramanian et al. (2005) shows similar finding that married people are more likely to be healthier.
Unemployment has been recognised as an important predictor for unhappiness and ill health. Previous studies (Clark and Oswald, 1994; Oswald, 1997) point out that unemployment is strongly and negatively associated with happiness. Unem-ployment also has a negative effect on health. A study using Canadian National Population Health Survey demonstrates that unemployed people are associated with unhealthy conditions (Cott et al., 1999).
health. They show that poor people are four times more likely to report unhealthy than rich people. Likewise, Oshio and Kobayashi (2010) using Japan nationwide survey conclude that people with higher income are more likely to be healthy than those with lower income. These mean that income inconsistently predicts happiness but consistently predicts health.
To summarise, there are a number consistent findings from previous research in terms of covariates of happiness and health. Education, marital status, income and equality have been consistent factors contributing to happiness and health. By contrast, other covariates such as gender and age have different tendency to predict happiness and health.
3
Data and Methods
We use data from the 2008 European Values Study which includes 47 countries, 120 NUTS 1 level, 327 NUTS 2 level, 1,059 NUTS 3 level and approximately 67,786 individual respondents across Europe. The purpose of this study is to provide un-derstanding about the ideas, beliefs, preferences, attitudes, values and opinions of citizens from across Europe. This is a series of study that was conducted four times in 1981, 1990,1999, and 2008 (European Values Study 2008).
This paper uses the questions regarding the outcomes measures for happiness and health. To assess happiness, we use this question: ‘Taking all things together, would you say you are: very happy, quite happy, not very happy and not at all happy’. To measure health, we use self-reported health question: ‘All in all, how would you describe your state of health these days? Would you say it is: very good, good, fair, poor and very poor’.
Following the above discussions, the covariates used in this research are gender, age, education attainment, marital status, employment status and household income. We use a dummy variable to measure gender (1 for female, 0 for male). Education at-tainment is measured by the highest level education attained by respondents, ranging from pre-primary education until second stage of tertiary education.
Marital status is captured using dummy variables for union, widowed, and di-vorced with never married as the reference group. Another measure of socio-economic covariate is employment status, differentiated as retired, housekeeper, student, unem-ployed, and disabled. They are used as dummy variables with employed/self employed is the reference group.
Multilevel multivariate model is appropriate for this study because we use multi-level setting, that is individuals nested in NUTS 3 area and we explain two outcomes simultaneously (Goldstein, 2003). This model corresponds to a schema where indi-vidual outcome such as happiness and health are explained by both indiindi-vidual and NUTS 3 level determinants. Although we follow the majority of studies on European comparative research in using multilevel model, unlike most of these we explain two outcomes simultaneously.
Because of large number of missing data especially on income, 10,740 of 67,786 respondents do not mention their income, we apply a recently developed method of multiple imputation (Goldstein, 2009). In addition, we have few missing at re-gions levels. Because the structure of data is multilevel, we use multilevel multiple imputation to impute missing data in both individual and NUTS 3 level. Ignor-ing multilevel structure may result in the poor imputation (Carpenter, 2010). This multilevel multiple imputation method consists of three-step process, first, imputing data with plausible values and thus creating a number of complete datasets. Second, analysing of each dataset using complete-data method i.e. multivariate multilevel model. Lastly, combining the results from the analysis, recogning the uncertainty due to imputation.
We use Mplus because this software provides Bayesian estimation using MCMC iterations. There are three steps to do multiple imputation using Bayesian estimator (Asparouhov and Muthen, 2010). First, we estimate the model using Bayes. Second we draw a set of parameter values from the posterior distribution. Finally, we generate imputed missing data for each set of parameter. In the first step, we use H0 or restricted model using two-level model.
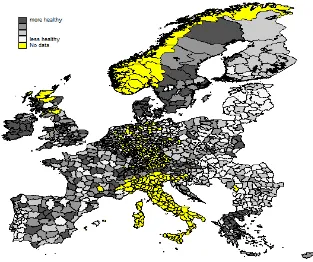
To describe happiness and health visually, we use Europe map obtained from EuroBoundaryMaps 4.0. We combine the map database with the data from EVS. Some areas are not covered by the map databases. Others are not sampled by EVS. There are 1280 NUTS 3 that have been merged in our datasets.
4
Results
Map 1 shows the mean of happiness across regions in Europe. The figure demonstrates that happiness varies within each country. Sweden, for example, has different level of happiness across its regions. Happiness levels in southern areas tend to be higher than that in northern areas. It can also be seen in the UK where happiness levels vary from the north to the south. Districts Limburg-Weilburg in Germany and Shetlands Islands in the UK are among the happiest districts across Europe. While, district Amberg-Sulzbach and Ingolstad in Germany and District Autonoma de Madeira in Portugal are among the least happy districts across Europe. Some districts in Greece are among the happiest districts compared to surrounding district in other countries.
Map 2 describes self-reported health in regions across Europe. Similar to happi-ness level, self-rated health also varies across countries. Different districts may have different self-rated health level. Spain, for example, has various level of self-rated health. Similarly, France also has different level of self-reported health, in NUTS 3 level. District Ostalbkreis and Ennepe-Ruhr-Kreis in Germany and West Lothian in the UK are among the most healthy districts across Europe. Meanwhile, sistrict Serra da Estrela in Portugal, Erlangen in Germany and Sommerset in the UK are among the least healthy districts across Europe.
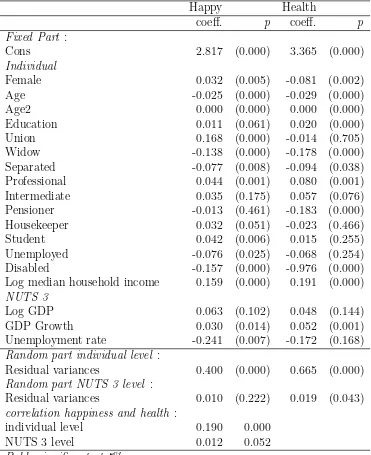
Table 1 presents multilevel multivariate regression model for regions across Eu-rope to capture the determinants of happiness and health. It is apparent from the table that correlation between happiness and health is significant both at individual level is 0.19 and at regions level is 0.012. The following covariates have consistent pos-itive effect on both happiness and health: education (O.011 and 0.02, respectively), income (0.16 and 0.19) and GDP NUTS (0.06 and 0.05). While other covariates (i.e. age, widow, separated, never married, housekeeper, unemployed and disabled) have various negative effects on happiness and health. Female, pensioner and student have different directions in predicting both happiness and health. The following will explain the result in detail.
Gender has different effects in explaining happiness and health. Female tend to be happier than male, but they do not tend to be healthier.
Age has negative effect on both happiness and health. This result is rather different from previous studies which show the association between age and happiness is forming U-shaped relationship. Nevertheless, the consistent results are produced by health related research that show negative association between age and health.
The important covariate that has strong influence on happiness and health is education. This covariate has strong positive associations with both outcomes. This result is similar to most previous studies on both happiness and health. However, this finding contradicts the finding of Oswald (1997) which shows negative association between education and happiness.
Table 1: Multilevel multivariate happiness and health across Europe Happy Health
coeff. p coeff. p Fixed Part :
Cons 2.817 (0.000) 3.365 (0.000)
Individual
Female 0.032 (0.005) -0.081 (0.002) Age -0.025 (0.000) -0.029 (0.000)
Age2 0.000 (0.000) 0.000 (0.000)
Education 0.011 (0.061) 0.020 (0.000) Union 0.168 (0.000) -0.014 (0.705) Widow -0.138 (0.000) -0.178 (0.000) Separated -0.077 (0.008) -0.094 (0.038) Professional 0.044 (0.001) 0.080 (0.001) Intermediate 0.035 (0.175) 0.057 (0.076) Pensioner -0.013 (0.461) -0.183 (0.000) Housekeeper 0.032 (0.051) -0.023 (0.466) Student 0.042 (0.006) 0.015 (0.255) Unemployed -0.076 (0.025) -0.068 (0.254) Disabled -0.157 (0.000) -0.976 (0.000) Log median household income 0.159 (0.000) 0.191 (0.000)
NUTS 3
Log GDP 0.063 (0.102) 0.048 (0.144) GDP Growth 0.030 (0.014) 0.052 (0.001) Unemployment rate -0.241 (0.007) -0.172 (0.168)
Random part individual level :
Residual variances 0.400 (0.000) 0.665 (0.000)
Random part NUTS 3 level :
Residual variances 0.010 (0.222) 0.019 (0.043)
correlation happiness and health :
individual level 0.190 0.000
NUTS 3 level 0.012 0.052
Employment status can be classified into: housekeeper, student, unemployed, and pension. Housekeepers are less likely to be happy and healthy than employed or self employed. Students are more likely to be happier but unhealthier than employed or self employed group. Unemployed people seem to be unhappy and unhealthy compared to employed or self employed people. This result is similar to another category that is disabled people where they are less likely to be happy and healthy than employed people. Unemployment rate in NUTS level has significant negative effect on happiness but only has weak and negative association with health.
As might be expected income is a significant predictor for both happiness and health. In the contextual setting, GDP is weakly associated with both happiness and health. However, GDP growth is positively associated with both happiness and health.
5
Discussion
There are five key findings in this study, First, happiness and health are strongly and positively correlated at individual and regions levels. Happier people tend to be in healthier too, and vice versa. This vindicates our use multivariate response model.
Second, unlike the majority studies of happiness and health that use country level as level two. This study uses regions level as contextual level. We find that in each country, happiness and health vary at region levels. This result needs to be addressed because information about regions level will provide a better understanding to capture both happiness and health. The effect of regions level on individuals happiness and health is apparent. Third, the majority of covariates have similar pattern of effects on health and happiness. It can be argued that both happiness and health tend to be identical. Therefore, they move simultaneously because they are determined by similar factors. This finding also confirms the previous study by Oshio and Kobayashi (2010) that find the socio-economic factors contributing to both happiness and health are relatively similar in direction.
Fourth, education and income are strong positive predictors for both happiness and health. The preposition ‘money do buy happiness and health‘ has been examined in this study. This finding confirms previous studies that two predictors above are important for happiness and health. Although the GDP does not matter both for happiness and health, but GDP growth matters. Education is by far the more impor-tant determinant of happiness and health. This study finds that income is positively associated with happiness and health.
Lastly, being married is an important factor for predicting happiness and health, presumably because marriage provides good companionship among other things. As has been argued by Argyle (1999), social relations including marriage and friendships have been one of the most important features of happiness. This finding confirms previous studies about social support and its effect on happiness and health. Social support can be considered as the important variable involved in companionship.
health measure. This research uses cross-sectional data and thus that cannot capture change over time both at individual and region levels. For future research, it is recommended to use panel data on individual and NUTS 3. This will add a deeper understanding and provide detailed explanation of happiness and health changes.
References
[1] Michael Argyle. The Psychology of Happiness. Routledge, East Sussex, second edition edition, 2001.
[2] David G. Blanchflower and Andrew J. Oswald. Well-being over time in Britain and the USA. Journal of Public Economics, 88:1359–1386, 2004.
[3] David G. Blanchflower and Andrew J. Oswald. Is well-being u-shaped over the life cycle. Social Science Medicine, 66:1733–1749, 2008.
[4] Luigino Bruni and Pier L. Porta. Economics and Happiness: Framing the Anal-ysis. Oxford University Press, Oxford, first edition, 2005.
[5] Andrew E. Clark. Unemployment as a social norm: Psychological evidence from panel data. Journal of Labor Economics, 21(2):323–351, 2003.
[6] Ed Diener and Robert Biswar-Diener. Happiness: Unlocking the Mysteries of Psychological Wealth. Blackwell Publishing, Malden, 2008.
[7] Amitava K. Dutt and Benjamin Radcliff. Happiness, Economics and Politics. Edward Elgar, Cheltentham, first edition, 2009.
[8] Bruno S. Frey and Alois Stutzer. Happiness and Economics: How the economic and institutions affect human well-being. Princeton University Press, Princeton, first edition, 2002.
[9] Carlos Graham. Happiness around the World. Oxford University Press, Oxford, first edition, 2009.
[10] Daniel Kahneman, Ed Diener, and Norbert Schwarz. Well-Being: The Founda-tions of Hedonic Psychology. Russle Sage Foundation, New York, 1999.
[11] Ichiro Kawachi, Bruce p. Kennedy, and Roberta Glass. Social capital and self-rated health. American Journal of Public Health, 89(8):1187–1193, 1999.
[13] Robert E. Lane. The Loss of Happiness. Yale university Press, New Heaven, first edition, 2000.
[14] Richard Layard. Happiness: Lessons from a New Science. Penguin Books, London, first edition, 2005.
[15] Takashi Oshio and Miki Kobayashi. Income inequality, perceived happiness, and self-rated health: Evidence from nationwide surveys in Japan. Social Science Medicine, 70:1358–1366, 2010.
[16] Andrew J. Oswald. Happiness and economic performance. The Economic Jour-nal, 107(445):1815–1831, 1997.
[17] S.V. Subramanaian, Daniel J. Kim, and Ichiro Kawachi. Social trust and self rated health in US communities: a multilevel analysis. Journal of Urban Health, 79(4):s21–s34, 2002.