Full Terms & Conditions of access and use can be found at
http://www.tandfonline.com/action/journalInformation?journalCode=cbie20
Download by: [Universitas Maritim Raja Ali Haji] Date: 19 January 2016, At: 20:16
Bulletin of Indonesian Economic Studies
ISSN: 0007-4918 (Print) 1472-7234 (Online) Journal homepage: http://www.tandfonline.com/loi/cbie20
MINIMUM WAGE POLICY AND ITS IMPACT ON
EMPLOYMENT IN THE URBAN FORMAL SECTOR
Asep Suryahadi , Wenefrida Widyanti , Daniel Perwira & Sudarno Sumarto
To cite this article: Asep Suryahadi , Wenefrida Widyanti , Daniel Perwira & Sudarno Sumarto (2003) MINIMUM WAGE POLICY AND ITS IMPACT ON EMPLOYMENT IN THE URBAN FORMAL SECTOR, Bulletin of Indonesian Economic Studies, 39:1, 29-50, DOI: 10.1080/00074910302007 To link to this article: http://dx.doi.org/10.1080/00074910302007
Published online: 17 Jun 2010.
Submit your article to this journal
Article views: 263
View related articles
ISSN 0007-4918 print/ISSN 1472-7234 online/03/010029-22 © 2003 Indonesia Project ANU
MINIMUM WAGE POLICY AND ITS IMPACT ON
EMPLOYMENT IN THE URBAN FORMAL SECTOR
Asep Suryahadi, Wenefrida Widyanti, Daniel Perwira and Sudarno Sumarto*
SMERU Research Institute, Jakarta
Since the late 1980s, minimum wages have become an important plank of the Indo-nesian government’s labour policy. Their levels have increased faster in real terms than those of average wages and per capita gross domestic product and, as a result, minimum wages have become binding for the majority of formal sector workers. This study finds that the imposition of minimum wages has a negative and statisti-cally significant impact on employment in the urban formal sector. The disemploy-ment impact is greatest for female, young and less educated workers, while the employment prospects of white-collar workers are enhanced by increases in mini-mum wages. Some workers who lose jobs in the formal sector and have to relocate to the informal sector face lower earnings and poorer working conditions.
INTRODUCTION
Although first introduced in Indonesia in the early 1970s, minimum wages did not gain much attention until the late 1980s, when the government began to make them an important plank of its labour market policies. In the first half of the 1990s, the government tripled minimum wages in nominal terms and more than doubled them in real terms in just five years. During the second half of the decade, their nominal levels con-tinued to increase, but in real terms they began to taper off after 1996 and fell sig-nificantly in 1998, owing to the high in-flation that swept the country during the economic crisis.1
Minimum wages began to re-emerge as a key element of economic and so-cial policy in 2000. In three consecutive years, from 2000 to 2002, they were raised significantly. As a result, their levels in real terms in 2002 were already higher than at their pre-crisis peak in
1997. Critically, this occurred against the backdrop of an economy still strug-gling to recover from a major economic crisis. Following a massive contraction of 13.7% in 1998 and near zero growth in 1999, the economy grew by around 5% in 2000 and 3.5% in 2001 and 2002.
Theory suggests that the impact of a minimum wage varies with different product and labour market conditions. A competitive labour market model predicts that a minimum wage estab-lished above the equilibrium market wage will cause a reduction in employ-ment and create unemployemploy-ment. On the other hand, a monopsonistic labour market model predicts that a minimum wage set above the monopsony wage level (but below the competitive wage level) will increase employment.
Whether a country’s labour market is closer to the competitive or the monopsonistic model is an empirical
matter. Although we do not rule out the possibility of imperfect competition, ob-servers generally have maintained that the Indonesian labour market is com-petitive. This was particularly evident during the recent economic crisis, whose impact was significant in terms of the fall in real wages, but relatively small in terms of the increase in open unemployment (Feridhanusetyawan 1999; Manning 2000). In general, there is little evidence to characterise the In-donesian labour market as monopsonis-tic, with the minor possible exception of some large, isolated employers in the outer islands.2
The first serious attempt to assess the impact of minimum wage policy on the labour market in Indonesia was con-ducted by Rama (1996),3 who found that
minimum wages have a modest impact on labour market outcomes, and con-cluded that the doubling of the mini-mum wage in the first half of the 1990s had led to an increase in average wages in the range of 5–15%, and a decline in urban wage employment in the range of 0–5%. However, he suggested that the disemployment impact appeared to be considerable in small manufacturing firms.
These findings have been challenged by Islam and Nazara (2000), who argue that the Indonesian regional minimum wage policy has not impaired employ-ment prospects, and propose that if In-donesia achieves annual economic growth of 4%, real minimum wages can be increased by 24% annually without net job losses being incurred. They contend there is no evidence that mini-mum wage-induced increases in do-mestic labour costs have eroded business profitability in large and medium-scale manufacturing. With rea-sonably competitive factor and product markets this result is hardly surprising, since firms can be expected to respond
to the negative impact on profits of higher input costs by substituting capi-tal and higher productivity labour for low skill labour, and by increasing their product prices. But whether unskilled labour will be negatively affected by the imposition of minimum wages is a dif-ferent issue.
The current study offers a reassess-ment of the impact of minimum wage policy on employment in Indonesia be-tween 1988 and 1999, focusing on the urban formal sector.4 The employment
impact of minimum wages is investi-gated by means of an econometric ap-proach, using data collected through the National Labour Force Surveys by Statistics Indonesia (BPS). In contrast to previous studies of the labour mar-ket impact of minimum wages in In-donesia, which have focused only on workers in aggregate, this study also assesses the impact for different types of workers.5
MINIMUM WAGE POLICY
During the 1970s and 1980s, the Indo-nesian government rarely intervened in wage determination, and neither did it enforce regulations on the laying off of workers. In addition, the government tightly controlled the labour movement by allowing only one government sanc-tioned labour union. As a result, there was little effective direct government or union involvement in wage setting (Manning 1994).
The late 1980s witnessed many changes in the Indonesian labour mar-ket, two of which are especially impor-tant. First, several independent labour unions were established, despite the government’s efforts to disband them and declare them illegal. Second, the government began to enforce the imple-mentation of regional minimum wages, which were updated annually. It has been argued that this minimum wage
policy was a form of compensation for the policy of tightly restricting labour rights, and was an effort to appease workers.
These changes also occurred in re-sponse to both internal and external pressures, however. The internal pres-sures came from groups concerned about the conditions of workers in an increasingly industrialised Indonesian economy, including many senior policy makers worried that labour was not sharing in the high growth that had taken place (Agrawal 1996; Edwards 1996; Manning 1994).
The external pressures were an indi-rect result of the growing level of Indo-nesian exports to North America and the European Union (EU), regions where concern was being aired in many quar-ters about labour market conditions in developing countries. The focus was on workers in export sectors, where, it was claimed, there were poor working con-ditions, low wages and a denial of the fundamental right to form labour unions. This belief led to calls for a ‘social clause’ to be inserted in trade agreements be-tween developed and developing coun-tries, stipulating that favoured access to the markets of developed countries would not be granted to those third world countries where labour standards remained unsatisfactory (Addison and Demery 1988).
Indonesia was one of the countries targeted by this concern. In the early 1990s, several complaints were filed against it, threatening to deprive it of low tariffs under the Generalised Scheme of Preferences (GSP) on its ex-ports to the US market. Potentially even more significant was a threat by the US government to withdraw in-vestment guarantees to US companies investing in Indonesia (Rama 2001).
As part of its response, the Indone-sian government revamped the
mecha-nism for setting minimum wages in 1989, and then on several occasions dur-ing the 1990s. Its objective has been to set minimum wages with reference to a range of factors, including ‘minimum subsistence needs’ (kebutuhan hidup minimum or KHM); the cost of living; the capacity and sustainability of com-panies; existing market wage rates; labour market conditions; and economic and income per capita growth.6
Prior to 1996, minimum wages were calculated with reference to what was termed ‘minimum physical needs’ (kebutuhan fisik minimum or KFM) rather than KHM.7 Both KFM and KHM are
bundles of consumption items deemed essential for the livelihood of a single worker. The KHM bundle consists of 43 items, ranging from food, clothing, housing, transport and health to recre-ation.8 KHM is a broader consumption
bundle, and represents a higher stan-dard of living than KFM. For example, the food bundle of KFM was set to achieve an intake of 2,600 calories per day, while that of KHM was set to achieve a daily intake of 3,000 calories.9
Until 2000, most provinces had just one level of minimum wage, which was applied throughout the entire province. Exceptions were to be found in the prov-inces of Riau, South Sumatra, West Java, East Java and Bali, where several mini-mum wages existed for different regions within the province. In addition, some provinces had different minimum wages for different sectors of the economy. In such cases, the sectoral minimum wages could not be set at a lower level than the general minimum wage that applied in the region.
Until the end of 2000, regional mini-mum wages were established by a decree issued by the Minister of Man-power. In determining minimum wage levels, the minister received recommen-dations from provincial governors, who
in turn took advice from tripartite pro-vincial councils made up of representa-tives of employees, employers and the government. In practice, employee and employer representatives were usually government appointees.
Beginning in 2001, as part of the re-gional autonomy policy adopted and implemented throughout the country, the power to set minimum wage levels was transferred to governors, and in some cases to mayors and regents (bupati), as the respective heads of prov-inces, cities and districts (kabupaten).10
As of 2000, Indonesia had 341 cities and districts. In setting minimum wages, mayors and regents also receive recom-mendations from tripartite councils in their regions.
DATA
The data analysed in this study are drawn mainly from the National Labour Force Surveys (Sakernas) con-ducted annually by BPS. The Sakernas is a nationally representative repeated cross-section survey conducted in Au-gust each year and covering all prov-inces in Indonesia.11 This study uses the
Sakernas data from the 1988 to 2000 surveys, except for the 1995 data, which are derived from the labour force module of the Intercensal Popu-lation Survey (Supas).
The Sakernas and the labour force module of the Supas collect information on individual main employment activi-ties, earnings, and hours of work on the primary job, as well as data on individual characteristics such as gender, age and level of education. The sample size of the Sakernas each year ranges from 40,000 to 80,000 households, covering 135,000 to 240,000 individuals aged 10 years and over. Since the present study focuses on the urban formal sector, only data from households that supply labour to that sector are included in the analysis.
The minimum wage data were ob-tained from the Department of Man-power and Transmigration. The study also uses data published by BPS on real regional gross domestic product (RGDP) for each province. To make them comparable across years, we de-flate nominal wages and minimum wages by the annual provincial CPI, also from BPS.
LABOUR MARKET STRUCTURE, MINIMUM WAGES AND
WAGE DISTRIBUTION
Changes in Labour Market Structure
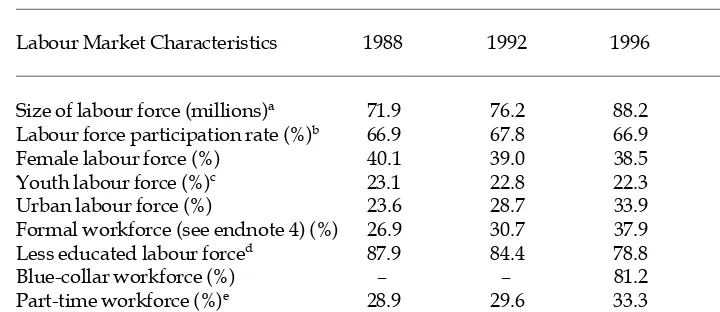
During the 1990s, the structure of the Indonesian labour market underwent considerable change, both quantita-tively and qualitaquantita-tively. Table 1 presents in summary form some key statistics on the Indonesian labour force from 1988 to 2000. The labour force grew by 33%, from 71.9 million in 1988 to 95.7 million in 2000—an average annual growth rate of 2.4%. During the entire period, how-ever, the labour force participation rate was relatively steady at around 67%, suggesting that the increase in labour force size was driven mainly by natural population growth.
The gender composition of the labour force was also relatively stable. The proportion of females remained close to 39–40%. Similarly, the propor-tion of young workers—those aged between 15 and 24 years—changed little during the period, declining only slightly from around 23% to 21% in the 12-year period. On the other hand, there was a notable trend towards urbanisation of the labour force, with the urban proportion increasing by more than two-thirds, from 23.6% in 1986 to 39.3% in 2000. The table also shows a clear trend in favour of for-malisation within the economy, at least before the crisis, when the formal component of the workforce increased
from 26.9% in 1988 to 37.9% in 1996. There is evidence that the economic cri-sis reversed this trend, presumably temporarily, with the formal propor-tion of the workforce falling back to 35.1% in 2000.
There was a significant improvement in the education level of the labour force, with the less educated declining from 87.9% in 1988 to 75.9% in 2000. The employment share of blue-collar work-ers also tended to decline. Before the crisis, more and more people chose to work part time, with this group reach-ing a peak of one-third of the workforce in 1996. It appears that the crisis re-versed this trend, as only 26.7% of the workforce worked part time in 2000. Presumably some part-timers were
forced to work full time in response to falling real income. Meanwhile, the un-employment rate increased during the crisis period, from 4.9% in 1996 to 6.1% in 2000.12
Trends in Minimum Wages
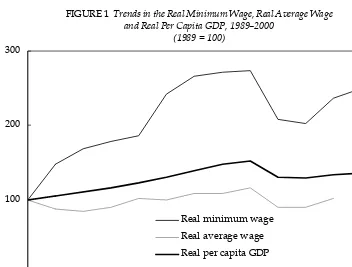
As a result of changes in labour market policy in the late 1980s, minimum wages have become an important plank of labour policy, as is evident from the speed at which the government has in-creased their levels. Figure 1 compares the trend in the real minimum wage be-tween 1989 and 2002 with trends in the average real wage and in real per capita GDP during the same period.13 It shows
that minimum wages have increased much faster in real terms than both the
TABLE 1 Summary Statistics of the Indonesian Labour Market, 1988–2000
Labour Market Characteristics 1988 1992 1996 2000
Size of labour force (millions)a 71.9 76.2 88.2 95.7
Labour force participation rate (%)b 66.9 67.8 66.9 67.8
Female labour force (%) 40.1 39.0 38.5 38.6 Youth labour force (%)c 23.1 22.8 22.3 20.7
Urban labour force (%) 23.6 28.7 33.9 39.3 Formal workforce (see endnote 4) (%) 26.9 30.7 37.9 35.1 Less educated labour forced 87.9 84.4 78.8 75.9
Blue-collar workforce (%) – – 81.2 79.2 Part-time workforce (%)e 28.9 29.6 33.3 26.7
Unemployment rate (%)f 2.8 2.8 4.9 6.1
aThe labour force consists of those who work (the workforce) and the unemployed. bThe labour force participation rate is the labour force as a share of the total population aged
15 years and over.
cYouth are defined as those aged 15–24 years.
dThe less educated are defined as those who have completed no more than junior secondary
education.
eThose who work less than 30 hours per week are considered to be working part time. fUnemployment rates from 1994 onward are not comparable with the preceding period owing
to a change in job search length.
Source: Sakernas.
average wage and per capita GDP. The real minimum wage in 1994 was around 2.4 times its 1989 level, mainly as the result of large minimum wage increases in 1990 and 1994. Interestingly, figure 1 also indicates that these two increases coincided with declines in the average wage. In 1990, when the real minimum wage was raised by almost 50%, the real average wage declined by more than 12%. Similarly, when the real minimum wage was increased by 30% in 1994, the real average wage declined by around 2%. During the other years before the crisis, when the increases in real mini-mum wages were more modest, real average wages generally also increased, more or less in line with increases in real per capita GDP.
In 2000, the real minimum wage was raised substantially, by significantly more than rises in the real average wage and real GDP. The increase in the
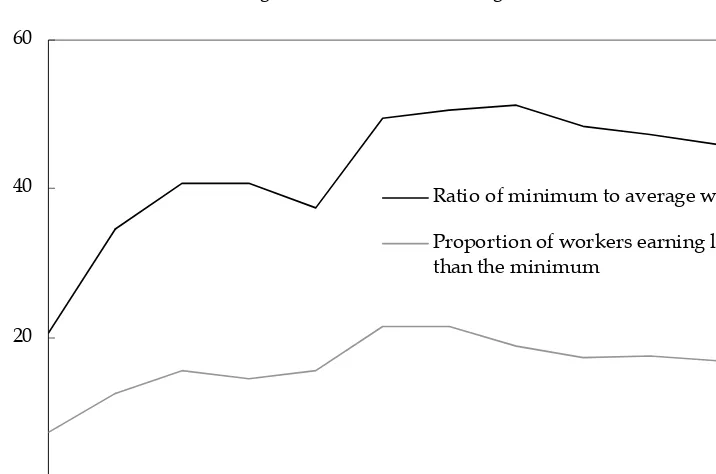
weighted average of real regional mini-mum wages in that year was more than 17%, while the real average wage rose by around 13% and real per capita GDP by around 3.5%. Real minimum wages were substantially increased in the fol-lowing two years as well, bringing the 2002 minimum wage to a new peak, higher than the pre-crisis peak of 1997. Because minimum wages rose more rapidly than average wages, the ratio of minimum to average wages increased markedly, from about 20% in 1989 to 50% in 1994 (figure 2). This ratio re-mained at around that point thereafter, with only a slight decline during the cri-sis. Figure 2 also shows that the propor-tion of workers whose monthly earnings were lower than the minimum wage tended in general to increase until 1994, and then to fall steadily. It rose from around 7% in 1989 to around 21% in 1994 and 1995, and then continuously
FIGURE 1 Trends in the Real Minimum Wage, Real Average Wage and Real Per Capita GDP, 1989–2000
(1989 = 100)
0 100 200 300
1989 1991 1993 1995 1997 1999 2001
Real minimum wage
Real average wage Real per capita GDP
declined to reach less than 11% by 2000. This implies that there has been a ten-dency toward greater compliance with minimum wage regulations since the mid 1990s.
Minimum Wages and the Wage Distribution
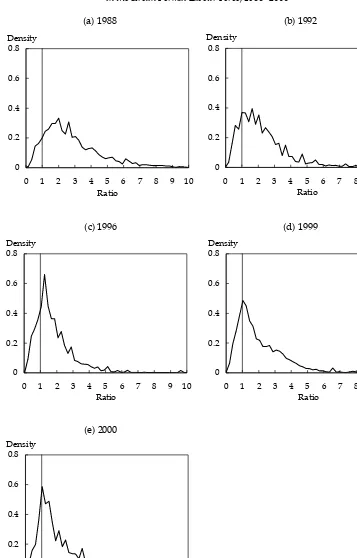
Some studies have shown that minimum wages have an impact not merely on wages around the minimum but on the whole wage distribution (e.g. Maloney and Nuñez 2001; Neumark, Schweitzer and Wascher 2000). Figure 3 presents a set of kernel densities of the wage distri-bution in the urban formal sector, show-ing how minimum wages have affected the wage distribution over time.14 In this
series of diagrams, the wage of each worker is measured as a ratio of the worker’s nominal wage to the nominal minimum wage applying in the region where the worker lives. The vertical line
at point 1 in each of the graphs repre-sents the minimum wage level.
Ideally, the impact of minimum wages on the wage distribution should be assessed by comparing the wage dis-tribution with and without minimum wages being imposed. In reality, how-ever, the wage distribution without minimum wages, which is the counter-factual, can only be guessed at. Assess-ing the impact of minimum wages on the wage distribution therefore requires some informed judgment, for which the following guides are useful. First, if the minimum wage is only ‘on paper’ and is not enforced, then the wage distribu-tion can be expected to be relatively smooth, including the distribution around the minimum wage level. Sec-ond, if the minimum wage is fully en-forced, then the wage distribution will begin at the minimum wage level, be-cause no worker will earn less than this
FIGURE 2 Ratio of Minimum Wage to Average Wage and Proportion of Workers Earning Less than the Minimum Wage, 1989–2000
0 20 40 60
1989 1991 1993 1995 1997 1999
Ratio of minimum to average wage
Proportion of workers earning less than the minimum
0 0.2 0.4 0.6 0.8
0 1 2 3 4 5 6 7 8 9 10
Density
Ratio
FIGURE 3 The Impact of Minimum Wages on Wage Distribution in the Urban Formal Labour Force, 1988–2000a
aThe vertical line in each graph represents
the minimum wage. Observations represent the ratio of each worker’s nominal wage to the region’s nominal minimum wage.
(a) 1988 (b) 1992
(c) 1996 (d) 1999
0 0.2 0.4 0.6 0.8
0 1 2 3 4 5 6 7 8 9 10
Density
Ratio
0 0.2 0.4 0.6 0.8
0 1 2 3 4 5 6 7 8 9 10
Density
Ratio
0 0.2 0.4 0.6 0.8
0 1 2 3 4 5 6 7 8 9 10
Density
Ratio
0 0.2 0.4 0.6 0.8
0 1 2 3 4 5 6 7 8 9 10
Density
Ratio
(e) 2000
amount. The reality will probably lie between these two extremes, with some spikes expected to occur around the minimum wage level. If the level of the minimum wage is sufficiently high, it may become the mode of the distribu-tion, since most workers will earn around this amount.
Figure 3 reveals that in 1988, a year before the minimum wage regulations were revamped, minimum wages had very little impact on the wage distribu-tion in Indonesia. There was no appar-ent spike in the wage distribution around the minimum wage. But this has changed over time. By 1992, the impact of minimum wages on the wage distri-bution had become more apparent. Spikes at and around the minimum wage occurred in the distribution. In 1996, the mode of the wage distribution was only slightly higher than the mini-mum wage. By 1999, and also in 2000, the minimum wage had become the mode of the distribution, indicating that minimum wages have become binding for the majority of workers.
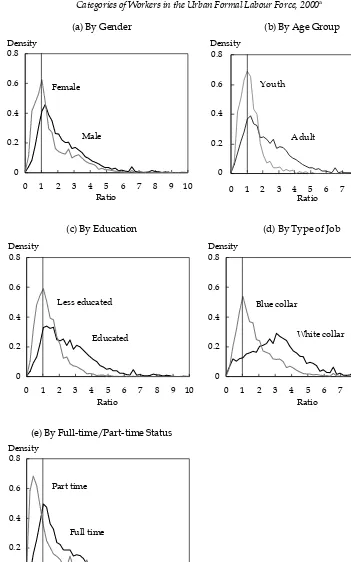
The graphs in figure 3 show the wage distribution for all urban formal sector workers. Since minimum wage regula-tions may have a different impact on dif-ferent groups of workers, we also graph their impact on the wage distribution across various groups of formal sector wage workers in 2000 (figure 4). Again the vertical line at point 1 in each graph represents the minimum wage level.
Figure 4a reveals that the wage distri-butions of both male and female work-ers are affected by minimum wages, but it appears that the effect is greater for female workers. The proportion of work-ers on the minimum wage is higher for females than for males. In addition, while the mode of the wage distribution for fe-male workers is at the minimum wage, the mode for male workers is slightly higher than the minimum.
Figure 4b indicates that the wage dis-tributions of both adult and young workers are affected by minimum wages. The graph reveals that the wages of most young workers are at or around the minimum, with only a few earning more than double the minimum. The impact of minimum wages on adult workers is also significant, with the mode of their wage distribution only slightly higher than the minimum.
Education is an important determi-nant of earnings. In figure 4c, workers are grouped into two categories, the ‘educated’ and the ‘less educated’, where the latter are defined as those with lower secondary education or below. As ex-pected, the graph reveals that the wage distribution of less educated workers is more strongly affected by minimum wages than that of educated workers. However, the impact of minimum wages in altering the shape of the wage distri-bution of educated workers remains sig-nificant, as the mode of their distribution is only slightly higher than the minimum wage.
When workers are separated into white-collar and blue-collar groups as shown in figure 4d, it becomes clear that minimum wages have very different con-sequences for the wage distribution of each group. The graph suggests that the wage distribution of white-collar work-ers is not greatly affected by the pres-ence of minimum wages, because their earnings are generally far above the mini-mum. On the other hand, the majority of blue-collar workers are clearly affected by minimum wages, as indicated by the fact that the minimum is the mode of the wage distribution for these workers.
Finally, figure 4e shows the wage dis-tribution for full-time and part-time workers. A worker is classified as part-time if he or she works less than 30 hours per week. Minimum wages are only binding for full-time workers and
0 0.2 0.4 0.6 0.8
0 1 2 3 4 5 6 7 8 9 10
Density
Ratio Youth
Adult
0 0.2 0.4 0.6 0.8
0 1 2 3 4 5 6 7 8 9 10
Ratio Density
Female
Male
FIGURE 4 The Impact of Minimum Wages on Wage Distribution across Categories of Workers in the Urban Formal Labour Force, 2000a
(a) By Gender (b) By Age Group
aAs for figure 3.
(e) By Full-time/Part-time Status
(c) By Education (d) By Type of Job
0 0.2 0.4 0.6 0.8
0 1 2 3 4 5 6 7 8 9 10
Density
Ratio Less educated
Educated
0 0.2 0.4 0.6 0.8
0 1 2 3 4 5 6 7 8 9 10
Ratio Density
Full time Part time
0 0.2 0.4 0.6 0.8
0 1 2 3 4 5 6 7 8 9 10
Density
Ratio White collar Blue collar
the graph shows that the minimum is the mode of their wage distribution. For part-time workers, minimum wages are not binding and are of no consequence for the wage distribution, as indicated by the fact that most part-time workers earned less than the minimum.
THE EMPLOYMENT IMPACT OF MINIMUM WAGES
The purpose of minimum wage regula-tions is to lift the incomes of those work-ers who currently earn wages that are ‘too low’. Unfortunately, the reality is not as simple as that. The imposition of a minimum wage affects both the supply and the demand sides of the labour mar-ket. Consequently, its impact is not lim-ited to wages, for there is also an effect on employment. It is this employment impact that often becomes a source of controversy when minimum wages are imposed or increased. Of equal impor-tance, minimum wages can also be ex-pected to have a different employment impact on different groups of workers.
The Controversy over the Minimum Wage Impact
In the context of developed countries, controversy about the impact of mini-mum wages on employment arose in the 1990s as a result of the findings of Card and Krueger (1994). Using data collected through a telephone survey of fast-food restaurants, they compare employment changes in two states in the US. They find that restaurants in New Jersey, where the minimum wage was increased, expanded their workforce relative to restaurants in Pennsylvania, where there was no change in the mini-mum wage. This finding has been chal-lenged by many, notably by Neumark and Wascher (1995). They re-evaluate Card and Krueger’s evidence using dif-ferent data, obtained from actual pay-roll records. In contrast to the findings
of Card and Krueger, they conclude that the minimum wage increase in New Jer-sey actually led to a fall in employment in this state relative to the Pennsylva-nia control group.
A similar controversy occurred in the context of developing countries. Castillo-Freeman and Castillo-Freeman (1992) analyse the imposition of US minimum wage norms in Puerto Rico. They estimate that the elasticity of employment with respect to the minimum wage in this country is around –0.5, meaning that a 10% increase in minimum wages causes a reduction in employment of 5%. Hence, they as-sert that the imposition of the US mini-mum wage has led to massive job losses on the island. Krueger (1995) disputes this finding on methodological grounds, however, arguing that the evidence of a negative employment impact from the imposition of the US minimum wage in Puerto Rico is statistically fragile.
Meanwhile, Bell (1997) contrasts the cases of Mexico, where minimum wages are very low relative to average wages, and Colombia, where minimum wages are much closer to the mean. She finds that the disemployment impact of mini-mum wages is zero in Mexico but sub-stantial in Colombia. Similarly, in a study of eight Latin American countries, Maloney and Nuñez (2001) find that minimum wages have significant impli-cations for employment, and affect the wage distribution not only in the neigh-bourhood of the minimum wage but also in the higher reaches of the distri-bution and in the informal sector.
Theoretical Framework
In the context of developed countries, the impact of minimum wages on labour market outcomes is generally analysed using a competitive labour market framework. In this framework, a minimum wage imposed above the equilibrium market wage will cause a
reduction in employment and create un-employment (Stigler 1946). This frame-work is appropriate for use in the context of countries with integrated labour markets. For developing coun-tries that are still characterised by dual labour markets, including Indonesia, an alternative framework is required.
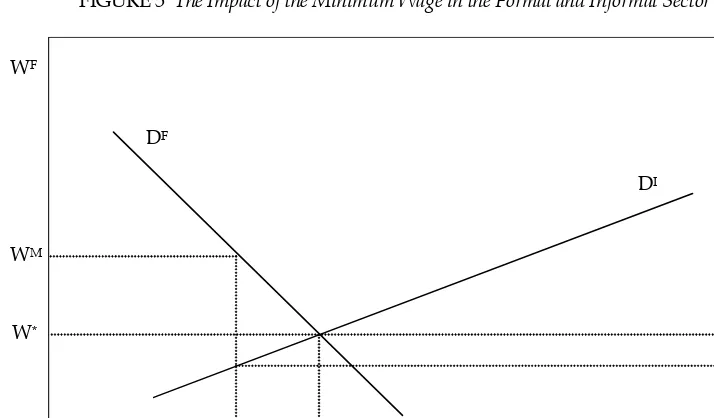
The framework used in this study is illustrated in figure 5. The economy con-sists of a formal sector and an informal sector. The labour supply is fixed in to-tal, and its allocation to the formal and informal sectors, and the level of wages, are determined by the demand for labour in both sectors. The horizontal axis (ON) represents the total amount of labour available. The left vertical axis indicates the level of wages in the for-mal sector, and the demand for labour in this sector is represented by the curve DF. The right vertical axis indicates the
level of wages in the informal sector, and the demand for labour in this sec-tor is DI, measured from right to left.
If there is no distortion in the labour market, equilibrium is achieved at the intersection of DF and DI. The
equilib-rium wage level is W*, which prevails
in both the formal and informal sectors. Of ON total labour, ON* is allocated to
the formal sector, and the remainder, N*N, to the informal sector. Suppose
now that a minimum wage level of WM
is imposed in the formal sector. This will reduce the amount of labour absorbed in the formal sector to ON1, such that
the informal sector now has to absorb more labour, N1N. As a result, the wage
level in the informal sector is depressed to W1.
In this framework, the imposition of minimum wages will reduce employ-ment in the formal sector and lower wages in the informal sector. Workers lucky enough to keep their jobs in the formal sector benefit at the expense of other workers—both those who need to relocate to the informal sector and those already there—all of whom suffer a
de-FIGURE 5 The Impact of the Minimum Wage in the Formal and Informal Sectora
aSee text for an explanation of terms
N
O N1 N*
WF
W*
WM
W1
W*
WI
DI
DF
cline in earnings. There is also an implied shift in the structure of the economy, with the formal sector con-tracting and the informal sector expand-ing; this will be driven by an increase in product prices in the formal sector rela-tive to the informal sector.
In reality, of course, workers are dif-ferentiated by their productivity. The demand curves for higher productivity workers lie above those for the less skilled, so the equilibrium market wage is likely to be above the minimum wage. In this case the minimum wage would have no direct effect on higher produc-tivity workers. Indirectly, however, to the extent that there is substitutability between workers with differing degrees of productivity, firms will now have a greater incentive to increase their em-ployment of higher productivity work-ers, who can expect some upward pressure on their earnings as a result.
The Method for Empirical
Estimation and Data Construction
Using the above framework, this study sets out to examine the impact of mini-mum wages in Indonesia on employ-ment levels in the urban formal sector. Since minimum wages are determined at the provincial level, one strategy for estimating the impact of minimum wages on urban formal sector employ-ment is to use variations in the levels of minimum wages and employment across provinces as well as over time. This strategy was adopted by Rama (2001) and is also used here.
Following Rama (2001), data on urban formal sector employment from the Sa-kernas are aggregated at the provincial level. These data, which are calculated for all workers as well as for certain seg-ments of the workforce, are then com-bined across years to form a panel data set with the province as the unit of
ob-servation. This data set is then merged with other provincial-level data on mini-mum wage levels, the CPI, RGDP and demographic variables. The complete panel data set can be constructed for all 26 provinces in Indonesia,15 covering the
12 yearly observation points from 1988 to 1999, so that in total there are 312 prov-ince level annual points of observation. The exceptions are data for white-collar and blue-collar workers, which are avail-able only from 1994.
Using the model discussed in the ap-pendix, we then estimate the impact of minimum wages on employment by re-gressing provincial level employment data on the minimum wage level and on some control variables. Other inde-pendent variables used in the estima-tion include the size of the populaestima-tion aged 15 years and over, to represent the factors that affect labour supply, and real RGDP, to represent the factors that affect labour demand. Province dummy variables are included to take into ac-count individual province fixed effects that do not vary across time. Mean-while, year dummy variables are in-cluded to measure specific time effects that have an impact on all provinces in any given year.
In addition, ‘degree of compliance to the minimum wage’ is included as an independent variable in the estima-tion. As shown in figures 2 and 3, com-pliance with the minimum wage in Indonesia has changed over time. This has important consequences for how minimum wages affect labour market outcomes. It is therefore necessary to control for the impact of varying de-grees of compliance in order to mea-sure the true impact of minimum wages.16 In the estimations, the
propor-tion of workers who earn above the minimum wage is used as a proxy for the degree of compliance variable.17
Asep Suryahadi, Wenefrida Widyanti, Daniel Perwira and Sudarno Sumarto
42
TABLE 2 Results of OLS Estimation of Employment Regressiona (Dependent variable: Log of employment)
Independent All Male Female Adult Youth Educated Less White- Blue- Full-
Part-Variable Workers Educated collar collar time time
Log of real minimum wage –0.112** –0.065 –0.307** –0.066 –0.307** –0.017 –0.196** 1.000* –0.140 –0.086* –0.364* (–3.03) (–1.87) (–4.64) (–1.80) (–3.35) (–0.48) (–3.79) (2.09) (–0.70) (–2.25) (–2.56) Degree of complianceb –0.371* –0.137 –1.177** –0.165 –1.414** 0.059 –0.838** 0.009 –0.609 –0.217 –1.958**
(–2.19) (–0.86) (–3.88) (–0.98) (–3.37) (0.36) (–3.54) (0.01) (–1.69) (–1.24) (–3.00) Log of population group 0.997** 1.004** 0.949** 0.975** 1.052** 0.960** 1.038** 1.145* 0.779** 1.007** 0.911** aged 15 years and over (35.02) (38.26) (18.41) (35.66) (15.30) (37.69) (26.43) (2.11) (3.46) (34.13) (8.30)
Log of real RGDP 0.014 0.020* 0.013 0.018 –0.004 –0.001 0.034* –0.127 0.047 0.010 0.068
(1.28) (1.94) (0.65) (1.60) (–0.13) (–0.07) (2.19) (–1.18) (1.06) (0.83) (1.58)
Province dummies Yes Yes Yes Yes Yes Yes Yes Yes Yes Yes Yes
Year dummies Yes Yes Yes Yes Yes Yes Yes Yes Yes Yes Yes
Constant 0.055 –0.471 2.895** –0.108 1.762 –0.262 0.174 –13.879 2.786 –0.532 2.037
(0.09) (–0.83) (2.60) (–0.18) (1.17) (–0.45) (0.21) (–1.38) (0.67) (–0.83) (0.85)
R-squared 0.998 0.998 0.994 0.998 0.989 0.998 0.996 0.966 0.995 0.998 0.964
F-test 2973.0** 3198.8** 1038.1** 2894.3** 606.8** 2771.7** 1741.1** 102.4** 744.8** 2806.4** 179.5**
Number of observations 312 312 312 312 312 312 312 156 156 312 312
aNumbers in parentheses are t-values.
bMeasured as the proportion of workers who earn above the minimum wage.
The Results of the Estimation
The employment regression discussed above is estimated using the Ordinary Least Squares (OLS) method on the provincial panel data set for all work-ers, as well as for various segments of the workforce. The results of the esti-mations are presented in table 2. The table shows that the coefficients of the minimum wage variable for all work-ers and all segments of the workforce are negative, except in the case of white-collar workers. This is consistent with the prediction from the theoreti-cal framework that minimum wages will reduce the employment of un-skilled workers in the formal sector.
The coefficient for all workers indi-cates that the elasticity of total employ-ment to the minimum wage is –0.112 and is statistically significant. This im-plies that every 10% increase in real minimum wages will result in a reduc-tion of more than 1% in total employ-ment. Similarly, the coefficients for female, young, less educated, full-time and part-time workers are also all negative and statistically significant. Their employment elasticities with re-spect to minimum wages are –0.307 for female workers and young workers, – 0.196 for less educated workers, –0.086 for full-time workers, and –0.364 for part-time workers.18
The only group of workers who ben-efit from the minimum wage in terms of employment opportunities are white-collar workers. The employment elasticity for this group with respect to the minimum wage is 1.0 and is statis-tically significant. This implies that a 10% increase in the real minimum wage will increase the employment of white-collar workers by 10%, and may suggest a substitution effect of mini-mum wages on the employment of dif-ferent types of workers. As the level of minimum wages is raised, firms reduce
the employment of unskilled workers and employ more white-collar work-ers with relatively higher skill levels. This also provides an indication that firms change technologies in response to increases in minimum wages. Ow-ing to capital–skill complementarity, a higher proportion of white-collar workers employed usually indicates that more capital-intensive technolo-gies have been adopted (Baldwin 1994; Berman, Bound and Griliches 1994).
The coefficients of the degree of pliance variable indicate that higher com-pliance tends to strengthen the negative impact of minimum wages on employ-ment. For most groups of workers their signs are the same as the signs of the co-efficients of the minimum wage variable. The coefficients of the degree of compli-ance variable for all workers and for fe-male, young, less educated and part-time workers are all statistically significant. However, higher compliance has no im-pact on the employment of white-collar and more educated workers.
Sensitivity Analysis
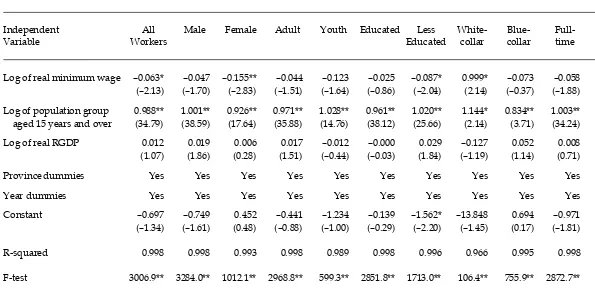
The inclusion of the degree of compli-ance variable in the employment re-gression is an innovation in this study. Hence, a sensitivity analysis is con-ducted by re-running the employment regression without this variable. The results are presented in table 3. Con-firming the previous results, all coeffi-cients in table 3 have the same signs as those in table 2. However, the employ-ment elasticities with respect to mini-mum wages in table 3 are in general smaller than those in table 2, and the t-values of the coefficients are also smaller.
Comparison of the results of the sen-sitivity analysis with those in table 2 provides evidence that controlling for the degree of compliance results in a stronger estimate of the impact of
Asep Suryahadi, Wenefrida Widyanti, Daniel Perwira and Sudarno Sumarto
44
TABLE 3 Results of OLS Estimation of Employment Regression Without Degree of Compliance Variablea (Dependent variable: Log of employment)
Independent All Male Female Adult Youth Educated Less White- Blue- Full-
Part-Variable Workers Educated collar collar time time
Log of real minimum wage –0.063* –0.047 –0.155** –0.044 –0.123 –0.025 –0.087* 0.999* –0.073 –0.058 –0.109 (–2.13) (–1.70) (–2.83) (–1.51) (–1.64) (–0.86) (–2.04) (2.14) (–0.37) (–1.88) (–0.94)
Log of population group 0.988** 1.001** 0.926** 0.971** 1.028** 0.961** 1.020** 1.144* 0.834** 1.003** 0.867** aged 15 years and over (34.79) (38.59) (17.64) (35.88) (14.76) (38.12) (25.66) (2.14) (3.71) (34.24) (7.86)
Log of real RGDP 0.012 0.019 0.006 0.017 –0.012 –0.000 0.029 –0.127 0.052 0.008 0.056
(1.07) (1.86) (0.28) (1.51) (–0.44) (–0.03) (1.84) (–1.19) (1.14) (0.71) (1.28)
Province dummies Yes Yes Yes Yes Yes Yes Yes Yes Yes Yes Yes
Year dummies Yes Yes Yes Yes Yes Yes Yes Yes Yes Yes Yes
Constant –0.697 –0.749 0.452 –0.441 –1.234 –0.139 –1.562* –13.848 0.694 –0.971 –1.934
(–1.34) (–1.61) (0.48) (–0.88) (–1.00) (–0.29) (–2.20) (–1.45) (0.17) (–1.81) (–0.96)
R-squared 0.998 0.998 0.993 0.998 0.989 0.998 0.996 0.966 0.995 0.998 0.962
F-test 3006.9** 3284.0** 1012.1** 2968.8** 599.3** 2851.8** 1713.0** 106.4** 755.9** 2872.7** 178.6**
Number of observations 312 312 312 312 312 312 312 156 156 312 312
aNumbers in parentheses are t-values.
Minimum Wage Policy and Its Impact on Employment in the Urban Formal Sector
4
5
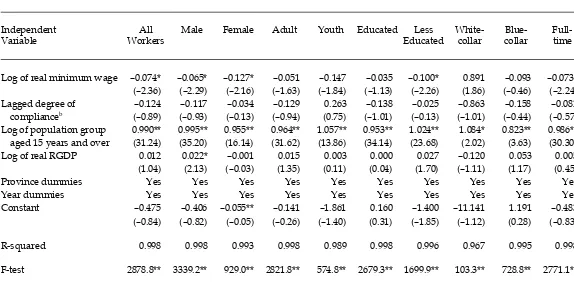
TABLE 4 Results of OLS Estimation of Employment Regression with Lagged Degree of Compliance Variablea (Dependent variable: Log of employment)
Independent All Male Female Adult Youth Educated Less White- Blue- Full-
Part-Variable Workers Educated collar collar time time
Log of real minimum wage –0.074* –0.065* –0.127* –0.051 –0.147 –0.035 –0.100* 0.891 –0.093 –0.073* –0.059 (–2.36) (–2.29) (–2.16) (–1.63) (–1.84) (–1.13) (–2.26) (1.86) (–0.46) (–2.24) (–0.49)
Lagged degree of –0.124 –0.117 –0.034 –0.129 0.263 –0.138 –0.025 –0.863 –0.158 –0.082 –0.188
complianceb (–0.89) (–0.93) (–0.13) (–0.94) (0.75) (–1.01) (–0.13) (–1.01) (–0.44) (–0.57) (–0.35)
Log of population group 0.990** 0.995** 0.955** 0.964** 1.057** 0.953** 1.024** 1.084* 0.823** 0.986** 1.020** aged 15 years and over (31.24) (35.20) (16.14) (31.62) (13.86) (34.14) (23.68) (2.02) (3.63) (30.30) (8.46)
Log of real RGDP 0.012 0.022* –0.001 0.015 0.003 0.000 0.027 –0.120 0.053 0.005 0.072
(1.04) (2.13) (–0.03) (1.35) (0.11) (0.04) (1.70) (–1.11) (1.17) (0.45) (1.70)
Province dummies Yes Yes Yes Yes Yes Yes Yes Yes Yes Yes Yes
Year dummies Yes Yes Yes Yes Yes Yes Yes Yes Yes Yes Yes
Constant –0.475 –0.406 –0.055** –0.141 –1.861 0.160 –1.400 –11.141 1.191 –0.483 –4.450*
(–0.84) (–0.82) (–0.05) (–0.26) (–1.40) (0.31) (–1.85) (–1.12) (0.28) (–0.83) (–2.07)
R-squared 0.998 0.998 0.993 0.998 0.989 0.998 0.996 0.967 0.995 0.998 0.965
F-test 2878.8** 3339.2** 929.0** 2821.8** 574.8** 2679.3** 1699.9** 103.3** 728.8** 2771.1** 175.4**
Number of observations 286 286 286 286 286 286 286 156 156 286 286
aNumbers in parentheses are t-values.
bMeasured as the proportion of workers who earn above the minimum wage.
mum wages on employment. This is an expected result, since variance in com-pliance means less certain effectiveness of the minimum wage regulations in in-fluencing supply and demand in the labour market. These results emphasise the need to control for the effect of vary-ing degrees of compliance in estimat-ing the impact of minimum wages, particularly in the context of develop-ing countries, where compliance cannot be taken for granted.
There is a possibility, however, that the compliance variable is endogenous, creating bias in the estimates in table 2.19
To take this possibility into account, the estimations are run again with the com-pliance variable lagged one period. The results are presented in table 4, and again show that the coefficients of mini-mum wages are negative, except in the case of white-collar workers. As before, the magnitudes of the coefficients and the t-values are in general also smaller than in table 2. The coefficients of the lagged degree of compliance variable are also mostly negative, but none is signifi-cant, suggesting that lagged compliance is not a good instrument for measuring current compliance. The fact that the co-efficients of the minimum wage variable in tables 3 and 4 in general do not change in sign from table 2 indicates that endogeneity is not a serious problem in the estimation.
CONCLUSIONS
Between 2000 and 2002, the central and regional governments in Indonesia vig-orously pursued a minimum wage policy, and regional minimum wages were increased significantly; as a result, real minimum wages in 2002 were al-ready higher than their peak pre-crisis levels in 1997. This was done while the economy was still struggling to recover from a severe economic crisis. Given the environment of slow economic growth,
there is increasing concern that further large increases in minimum wages may slow employment growth in the mod-ern industrial sector.
This study finds that as minimum wages continued to rise during most of the 1990s, compliance also steadily in-creased from the middle of the decade, altering the entire wage distribution of urban formal sector workers. In 1988, a year before minimum wage regulations were revamped, minimum wages had very little impact on the wage distribu-tion. But by 1999 the minimum wage had become the mode of the distribu-tion, indicating that minimum wages had become binding for the majority of workers.
The results of the analysis in this study show that increases in minimum wages have a negative impact on urban formal sector employment, except in the case of white-collar workers. For all workers, the estimated elasticity of to-tal employment to the minimum wage is around –0.1 and is statistically signifi-cant. This implies that for every 10% in-crease in real minimum wages, there will be a reduction of around 1% in to-tal employment, controlling for other factors affecting employment, such as economic growth and growth in the size of the working population.
Significantly, the negative employ-ment impact of minimum wage in-creases is greatest for those groups that are most vulnerable to changes in labour market conditions, such as female, young and less educated workers, who make up the bulk of Indonesia’s labour force. For female and young workers, the employment elasticities with respect to minimum wages are around –0.3, while for less educated workers they are around –0.2.
White-collar workers are the only group to have benefited from minimum wages in terms of employment. The
ployment elasticity of white-collar work-ers with respect to the minimum wage is 1.0 and is statistically significant, which perhaps indicates that the imposition of minimum wages leads to the substitu-tion of different types of workers: as the level of minimum wages is increased, firms reduce the employment of other types of workers and replace them with white-collar workers. This may be due to the substitution of more capital- and skill-intensive production processes in place of labour-intensive processes in re-sponse to minimum wage rises.
These results imply that minimum wages benefit some workers and disad-vantage others. Workers who keep their factory jobs clearly benefit from in-creases in the minimum wage. White-collar workers are clear winners from a vigorous enforcement of minimum wage policy. However, those who lose their jobs in the formal sector as a re-sult of increases in minimum wages— and face lower earnings and poorer
working conditions in the informal sec-tor—are losers from minimum wage policy. The potential losers are those most vulnerable to changes in labour market conditions, such as female, young, and less educated workers.
If increases in minimum wages re-duce employment growth in the mod-ern sector to below the growth of the working population, more unskilled workers may be forced into lower paid jobs with poorer working conditions in the informal sector. Thus, the impact of minimum wages on employment in the modern sector is only part of the story. They have an equal if not greater im-pact on the welfare of workers in the informal sector, which accounts for the bulk of the workforce in Indonesia. An important area for further research is to assess the spillover effects of the labour displacement impact of mini-mum wages in the formal sector on em-ployment and real earnings in the informal sector.
NOTES
* We would like to thank Bambang Widi-anto, Kelly Bird, John Maxwell, seminar participants at the National Planning Agency (Bappenas), the Partnership for Economic Growth (PEG) and the Insti-tute for Economic and Social Research (LPEM–FEUI), and two anonymous ref-erees for comments and suggestions. We also thank Bappenas, the Central Statis-tics Agency (BPS) and the Ministry of Manpower and Transmigration for pro-viding access to the data. Financial sup-port from PEG–USAID is gratefully acknowledged. The views stated here are those of the authors and should not be attributed to PEG, USAID or the SMERU Research Institute. Errors and weak-nesses in this study are ours.
1 Indonesia was hit in mid 1997 by an eco-nomic crisis whose impact was still being felt in 2002, five years after it began. Feridhanusetyawan (1999), Manning (2000) and Skoufias and Suryahadi (2002)
discuss the impact of the crisis on the labour market.
2 For a review of the Indonesian labour market, see Manning (1998).
3 Subsequently published as Rama (2001). 4 The formal sector workforce is defined here to include those who are: (i) self-employed and assisted by non-permanent employees, except for those in the agricul-ture sector; (ii) self-employed and assisted by permanent employees; and (iii) wage employees, except for those in the agricul-ture sector. This definition largely follows that used by BPS, which includes the above three categories plus (iv) self-employed without assistance in profes-sional, leadership and managerial jobs. This last category is not included in this study’s definition, because data on type of job are not available prior to 1994. 5 Rama (2001) also analysed the impact of
minimum wages on workers in small firms.
6 See Minister of Manpower Regulation No. 01/1999 on Minimum Wages. 7 The change from KFM to KHM is
stipu-lated in Minister of Manpower Decree No. 81/1995.
8 The details of the KHM can be found in Depnaker (1998).
9 Since the aim is to provide a level of labour income sufficient to achieve a certain stan-dard of living, minimum wages in Indo-nesia are set in monthly, rather than hourly, terms. Because of this, the analy-sis of wages and minimum wages in this study is based on monthly rates. 10 Minister of Manpower and Resettlement
Decree No. 226/2000 transfers the power to set minimum wages only to governors, but some governors then delegate this power to the mayors and regents in their regions.
11 Before 1994 the Sakernas was conducted quarterly, and the yearly database was formed by pooling the quarterly data-bases in each year.
12 The unemployment rates for the period before 1994 are not strictly comparable with those afterward, owing to a change in the job search concept used in the Sa-kernas. Before 1994 the job search period asked about in the survey was limited to the previous single week. In 1994 this was changed: the period was no longer lim-ited to the previous one week, provided the person was still waiting for the results of a job search.
13 The ‘national level’ minimum wage rep-resented in figure 1 is calculated as the average of regional minimum wages weighted by the number of urban formal sector workers in each region. The aver-age waver-age is calculated only from data for urban formal sector workers. Per capita GDP figures are obtained from national level data published by BPS.
14 Kernel density estimators can be thought of as similar to histograms, but with two
important differences. First, the intervals of data are allowed to overlap. Second, the density of an interval is the sum of the weighted values of the observations in the interval (the weight is between 0 and 1 and is assigned on the basis of dis-tance from the centre of the interval). The diagrams in figures 3 and 4 are drawn using the command KDENSITY in the statistical program STATA, with the fol-lowing default options: number of points = 50; width = optimal; kernel function = Epanechnikov.
15 With some new provinces formed in re-cent years, the number of provinces as of 2002 had increased to 32.
16 Rama (2001) asserts that minimum wages would have a limited impact on labour market outcomes if firms were not forced to comply. He argues that, in the context of Indonesia in the early 1990s, there were two main sources of non-compliance. First, firms that claimed to be unable to afford the mini-mum wage could request a waiver from the government. Second, and more im-portantly, there was a weakness in the enforcement capacity of the government. In spite of this, neither Rama (2001) nor Islam and Nazara (2000) controlled for compliance in their regression estima-tions.
17 Figure 2 shows the proportion of work-ers who earn less than the minimum wage, which is a measure of non-compliance.
18 The magnitudes of these employment elasticities are smaller than the estimate reported for Puerto Rico of 0.5 (Castillo-Freeman and (Castillo-Freeman 1992), but they are comparable to those for Colombia of 0.15–0.33 (Bell 1997; Maloney and Nuñez 2001), which are considered large. 19 We are grateful to an anonymous referee
for this point.
REFERENCES
Addison, T., and L. Demery (1988), ‘Wages and Labour Conditions in East Asia: A Review of Case-Study Evidence’, Develop-ment Policy Review 6: 371–93.
Agrawal, N. (1996), ‘The Benefits of Growth for Indonesian Workers’, Policy Research Working Paper No. 1637, World Bank, Washington DC.
Baldwin, R.E. (1994), ‘The Effects of Trade and Foreign Direct Investment on Em-ployment and Relative Wages’, OECD Economic Studies 23, Winter: 7–54. Bell, L.A. (1997), ‘The Impact of Minimum
Wages in Mexico and Colombia’, Journal of Labor Economics 15: S102–S135.
Berman, E., J. Bound and Z. Griliches (1994), ‘Changes in the Demand for Skilled La-bor within U.S. Manufacturing: Evidence from the Annual Survey of Manufactures’,
Quarterly Journal of Economics 109: 367–97. Card, D., and A. Krueger (1994), ‘Minimum Wages and Employment: A Case Study of the Fast Food Industry in New Jersey and Pennsylvania’, American Economic Review
84: 772–93.
Castillo-Freeman, A., and R. Freeman (1992), ‘When the Minimum Wage Really Bites: The Effect of the U.S.-Level Minimum on Puerto Rico’, in G. Borjas and R. Freeman (eds), Immigration and the Work Force, Uni-versity of Chicago Press, Chicago IL. Depnaker (Departemen Tenaga Kerja)
(1998), Pedoman Pengisian Data Kebutuhan Hidup Minimum (KHM) [Guidelines for Filling Out the Minimum Subsistence Needs (KHM) Data], Bagian Proyek Peningkatan Kesejahteraan Tenaga Kerja 1998/1999, Departemen Tenaga Kerja R.I., Jakarta.
Edwards, A.C. (1996), ‘Labor Regulations and Industrial Relations in Indonesia’, Policy Research Working Paper No. 1640, World Bank, Washington DC.
Feridhanusetyawan, T. (1999), The Impact of the Crisis on the Labor Market in Indone-sia, Report prepared for the Asian Devel-opment Bank, Centre for Strategic and International Studies, Jakarta.
Islam, I., and S. Nazara (2000), ‘Minimum Wage and the Welfare of Indonesian
Workers’, Occasional Discussion Paper Series No. 3, International Labour Orga-nization, Jakarta.
Krueger, A.B. (1995), ‘The Effect of the Mini-mum Wage When It Really Bites: A Reexamination of the Evidence from Puerto Rico’, in S.W. Polachek (ed.), Re-search in Labor Economics, JAI Press, Green-wich CT.
Maloney, W.F., and J. Nuñez (2001), ‘Mea-suring the Impact of Minimum Wages: Evidence from Latin America’, Policy Re-search Working Paper No. 2597, World Bank, Washington DC.
Manning, C. (1994), ‘What Has Happened to Wages in the New Order?’, Bulletin of In-donesian Economic Studies 30 (3): 73–114. Manning, C. (1998), Indonesian Labour in
Tran-sition, Cambridge University Press, Cam-bridge MA.
Manning, C. (2000), ‘Labour Market Adjust-ment to Indonesia’s Economic Crisis: Con-text, Trends and Implications’, Bulletin of Indonesian Economic Studies 36 (1): 105–36. Neumark, D., and W. Wascher (1995), ‘The Effect of New Jersey’s Minimum Wage Increase on Fast-food Employment: A Re-evaluation Using Payroll Records’, NBER Working Paper No. 5224, National Bureau of Economic Research, Cambridge MA. Neumark, D., M. Schweitzer and W. Wascher
(2000), ‘The Effect of Minimum Wages throughout the Wage Distribution’, NBER Working Paper No. 7519, National Bureau of Economic Research, Cambridge MA. Rama, M. (1996), ‘The Consequences of
Dou-bling the Minimum Wage: The Case of In-donesia’, Policy Research Working Paper No. 1643, World Bank, Washington DC. Rama, M. (2001), ‘The Consequences of
Dou-bling the Minimum Wage: The Case of Indonesia’, Industrial and Labor Relations Review 54: 864–81.
Skoufias, E., and A. Suryahadi (2002), ‘A Co-hort Analysis of Wages in Indonesia’, Ap-plied Economics 34: 1,703–10.
Stigler, G. (1946), ‘The Economics of Mini-mum Wage Legislation’, American Eco-nomic Review 36: 358–65.
APPENDIX: THE MODEL
To establish formally the model repre-senting the way minimum wages may affect employment in the formal sector, let us define the supply and demand for workers as follows:
X mand respectively, so that lS represents
labour supply; lD represents labour
de-mand; w represents wages; mw repre-sents the minimum wage; X is a vector of labour supply shifters such as popu-lation growth; Y is a vector of labour demand shifters such as economic growth; and α, β, γ and θ are vectors of parameters.
In equilibrium, labour supply is equal to labour demand, and hence:
Y
The reduced form solution for em-ployment in the formal sector is:
X
Equation (4) shows that the level of formal sector employment is affected by the minimum wage, labour demand shifters, and labour supply shifters. Since the parameter of interest is Ω— showing how the minimum wage af-fects employment—equation (4) can be directly estimated to obtain this param-eter.