Full Terms & Conditions of access and use can be found at
http://www.tandfonline.com/action/journalInformation?journalCode=ubes20
Download by: [Universitas Maritim Raja Ali Haji] Date: 13 January 2016, At: 00:30
Journal of Business & Economic Statistics
ISSN: 0735-0015 (Print) 1537-2707 (Online) Journal homepage: http://www.tandfonline.com/loi/ubes20
Testing for the Monotone Likelihood Ratio
Assumption
Jutta Roosen & David A Hennessy
To cite this article: Jutta Roosen & David A Hennessy (2004) Testing for the Monotone Likelihood Ratio Assumption, Journal of Business & Economic Statistics, 22:3, 358-366, DOI: 10.1198/073500104000000235
To link to this article: http://dx.doi.org/10.1198/073500104000000235
Published online: 01 Jan 2012.
Submit your article to this journal
Article views: 42
Testing for the Monotone Likelihood
Ratio Assumption
Jutta R
OOSENDepartment of Food Economics and Consumption Studies, University of Kiel, Kiel, Germany (jroosen@food-econ.uni-kiel.de)
David A. H
ENNESSYDepartment of Economics, Iowa State University, Ames, IA 50011 (hennessy@iastate.edu)
Although monotonicity of the likelihood ratio for conditioned densities is a common technical assump-tion in economic models, empirical tests for its plausibility do not appear to have been conducted. This article develops such a test based on the theory of order-restricted inference that is robust with respect to the correlation structure of the distributions being compared. The test is applied to study the technol-ogy revealed by agricultural production experiments. For the data under scrutiny, the results support the monotone likelihood ratio assumption. In a second application, we nd some support for the assumption of afliation among bids cast in a multiple-round Vickrey auction for a consumption good.
KEY WORDS: Afliation; Auction; Likelihood ratio; Order-restricted inference; Stochastic order.
1. INTRODUCTION
The monotone likelihood ratio (MLR) order has arisen in the analysis of many economic problems. When comparing two conditional distributions, the order asserts that a compar-atively high outcome is always more likely under one distrib-ution among the pair. The order implies the simple stochastic order and is both necessary and sufcient for simple stochastic order on the domain-conditioned distribution functions. Under the simple stochastic order, the compared distributions cannot intersect, and the dominating distribution lies underneath the dominated distribution. Under the MLR order, the ratio of the densities, say f2.x/=f1.x/, wheref2.x/dominates, is monotone
increasing where dened. Graphically, one implication of the MLR ordering is that the ordered densities can cross no more than once. This strong level of regularity maps into strongly reg-ular comparative statics inferences and so motivates the interest in the assumption among economic theorists.
The list of applications is large, and we identify a small num-ber to provide a sense of the assumption’s utility. Landsnum-berger and Meilijson (1990) invoked the assumption to establish in-sights on the comparative statics of portfolio allocation. In a parallel result, Milgrom (1981a) established that the MLR order can characterize “bullish” news for an exchange-traded com-pany. Of more direct relevance to the empirical contexts studied in this article, Milgrom (1981a) demonstrated the pertinence of the order to mechanism design where parties have different in-formation sets. The sorts of design issues where the MRL order arises include the agent remunerations problem faced by a prin-cipal, as well as the design of an auction. The assumption is now standard in the theories of organizing (e.g., Koh 1992) and nancing (e.g., Innes 1993) rm production under incomplete information.
The intuition behind the assumption is that it makes a signal on an unobservable variable sufciently informative to be used in a determinate manner when taking signal-based actions. In the instances of principal-agent models, the principal typically does not have sufcient information to remunerate the agent in a rst–best manner. For example, although it may be
Pareto-superior to condition the rewards of a risk averse agent on ef-fort rather than on production, the principal may not be able to observe the former. If effort shifts the distribution of produc-tion according to the MLR order, then we can be condent that a higher level of observed production is evidence of an higher level of agent effort. If the principal writes a contract with a re-ward that is monotone increasing in production, then the agent is likely to respond with more effort, and both parties are bet-ter off.
Given that the MLR assumption is often required in contexts where a relevant variable can be observed only after incurring monitoring costs, it is not at all surprising that the assumption has not been subjected to empirical scrutiny. If, however, the remunerated party in a principal–agent relationship had no pri-vate motive for misrepresenting the relevant variable, then data would be available for study. So it is typically in economic envi-ronments where the MLR assumption is not necessary that the data be available.
There remains, however, the opportunity to test for conjec-tures on the stochastic relationships underlying data in situa-tions where the private incentive to misrepresent is absent. If we had such data, then a direct test for the validity of the MLR assumption would be possible. In this article we develop a di-rect test of the MLR property and apply it to data from two very different contexts, one from agronomy trials and the other from experimental auctions.
In agronomy trials by academic researchers, the private in-centive to misrepresent the level of inputs used is typically absent. Agronomic inputs such as water, fertilizers, and chem-ical pesticides are tangible, whereas management time, care in planting, and crop scouting activities are less readily measured. The more measurable among these inputs may be reliably ob-served by a party with no pecuniary interest in the recorded value and who is willing to incur the monitoring costs. In this article we use data from carefully controlled agronomy trials at
© 2004 American Statistical Association Journal of Business & Economic Statistics July 2004, Vol. 22, No. 3 DOI 10.1198/073500104000000235
358
Roosen and Hennessy: Testing for the Monotone Likelihood Ratio Assumption 359
a U.S. Land Grant University to study the relationship between the nitrogen input and corn (Zea mays) output.
Milgrom and Weber (1982) extended work by Milgrom (1981b) on the role of the MLR order as structure on the signals that arise in auctions. They characterized equilibrium in com-mon and private value auctions when values covary across bid-ders according to the afliation property. Under this property, which is also known as multivariate totally positive order 2 (MTP2/, large values for some of the variables make the other
variables more likely (in the likelihood ratio sense) to be large than small. In the context of common value auctions and un-der the assumption of symmetry among bidun-ders, a test for the afliation property coincides with a test for the multivari-ate extension of the MLR property across conditioned densi-ties. The afliation property is dened on lattice structured sets (see Athey 2002; and Shaked and Shanthikumar 1994, pp. 132 and 253, on the relation between the multivariate MLR order). In our case, it sufces to test for the MLR property instead of for afliation, because the standard model in auction theory as-sumes symmetry across agent strategies and beliefs, so that all agents have the same probability function on valuations. Bar-tolucci and Forcina (2000), in contrast, have developed a likeli-hood ratio test for the MTP2property on a distribution of binary
variables. Such a test, were it extended to continuous variables, would make it possible to dispense with the symmetry condition in deriving the test hypothesis. In our second application, we test for evidence of afliation in a multivariate valuation distri-bution. The data has been obtained from second-price auctions. Due to the Vickrey revelation principle for second-price auc-tions, bidders have no private incentive to bid other than their true values. This makes auction data ideal for applying our test. After reviewing the literature on testing for stochastic order, we develop our test for the MLR property. Because we cannot preclude the possibility that external factors generate correla-tions between distribution evaluacorrela-tions, the test allows for such dependence. The two empirical applications are then presented. We nd quite strong support for the assumption of MLR or-der on corn yield distributions as nitrogen application changes. When studying auction experiments, we nd limited evidence in favor of the joint hypothesis that agents are symmetric and valuations are afliated.
2. LITERATURE REVIEW
In recent years, several tests on stochastic order have been developed, most frequently to compare income distributions. Typically, these tests can be adapted to study a variety of sto-chastic orders. Beach and Davidson (1983) have proposed a test of Lorenz curve dominance that explicitly acknowledges that the distribution quantiles are dependent random estimates of the underlying distribution. (Because Lorenz curves are constructed with share data, Lorenz curve dominance may be interpreted as a mean-preserving contraction in the variability of income shares.) However, they treated the compared distri-butions as being independent. Relying on Pearson goodness-of-t tests, Anderson (1996) used a different approach to infer stochastic dominance. Assuming independence, he derived the
asymptotic covariance matrix of the frequency vector for the distributions being compared.
These earlier tests are based on a multiple-comparison ap-proach. Partitioning the range of the random variables into a nite set of k exhaustive intervals, the multiple comparison approach assesses the order of the distributions on each of the intervals. These multiple-hypotheses tests lead to a sta-tistical size bounded by Sidák’s inequality, a renement of Bonferroni’s inequality (Savin 1984, pp. 834–835). This in-equality provides a lower bound on the probability that a mul-tivariate normal vector with mean 0 and arbitrary correlations falls inside a k-dimensional cube centered at the origin. The lower bound is given by this same probability for the case where all correlations are 0. Under this condition, the test statistic has the Studentized maximum modulus distribution, a result that Richmond (1982) applied in the construction of simultaneous condence intervals. Given that these tests are based on Sidák’s inequality, their true size is likely smaller than their nominal size.
These types of tests have been criticized, because the assumption that compared distributions are independently dis-tributed is often inappropriate for the context in question. This criticism is pertinent for income distribution comparisons that rely on panel data, as well as for nancial data where dif-ferent distributions are often conditioned on similar informa-tion sets held by the economic agents. With this concern in mind, Klecan, McFadden, and McFadden (1991) introduced a test of stochastic dominance that is an extended version of the Kolmogov–Smirnov test. Their test does not impose a para-metric form on the distributions. Through the assumptions of exchangeabilityand®-mixing, the test does allow for some de-gree of statistical dependence across space and time. The test is likely inefcient, because it does not explicitly take into ac-count the dependence structure between distributions.
Davidson and Duclos (2000) demonstrated a theorem that constructs estimates of the asymptotic covariance structure over successive integrals of the probability distributions, that is, the cumulative distribution function (cdf ), its integral, and so on. They extended their nding to the case where the quantile of interest (e.g., the poverty line) is random. Zheng and Cushing (2001) derived a similar, albeit more restrictive, result and have used it in tests of income inequality indices. Looking again at Lorenz curves, Zheng (2002) developed a procedure for non-simple random samples resulting from stratied and cluster sampling plans. He showed that treating nonsimple random samples as simple random samples may lead to nontrivial bias in variance-covariance estimates of Lorenz curve coordinates.
In terms of identifying MLR order, Hendricks, Porter, and Wilson (1990) recognized the need to support their theoretical results on auctions by studying gas lease bids by informed and uninformed bidders. To compare the distribution on each per-centile they used a Wilcoxon test, a procedure that does not acknowledge the dependence of distribution quantiles.
Dykstra, Kochar, and Robertson (1995) were the rst to de-velop a formal test for the MLR ordering. They adopted a nonparametric maximum likelihood estimator under the null hypothesis of equality in the probability distribution functions, and their estimator assumes independent random samples. Dardanoni and Forcina (1998) proposed a uniform framework
for likelihood inference on stochastic orders (e.g., the sim-ple stochastic order, the Lorenz order, and the MLR order). Their test leads, after suitable reparameterization, to a system of linear inequalities. They developed a maximum likelihood algorithm based on the expected information matrix, but this estimator relies again on the independence of the distributions. Using this estimator of the test statistic, they applied testing procedures for order-restricted inference. In a further exten-sion, Dardanoni and Forcina (1999) adapted their earlier results to compare multiple (i.e., more than two) distributions for the case of Lorenz curve orderings. The work of most direct rele-vance to our auction application is by Bartolucci and Forcina (2000) who developed a likelihood ratio statistic to test for af-liation among binary variables.
In this article, we develop and apply a test for the MLR order. Our methods generalize to the comparison of three or more dis-tributions, and we develop the test in this more general context. Using the parameterization of Dardanoni and Forcina (1998), we derive a test statistic that may be written as a linear com-bination of inequalities. We capture dependence by exploiting the approach of Davidson and Duclos (2000) to estimating the covariance of the cdf’s.
Davidson and Duclos extended to the dependent samples context the application by Chow (1989) of the central limit the-orem to stochastic inference on dominance orderings with in-dependent samples. They conned their attention to the class of stochastic orderings generated by comparing successive in-tegrations of distribution functions. Although the MLR prop-erty cannot be presented as such, one of the main theorems of Davidson and Duclos (theorem 1) can be readily modied through a transformation to apply to the MLR ordering. We make this transformation. Thus the asymptotic distribution of our test statistic does not require the assumption of indepen-dence among distributions. The derived test statistic, together with the covariance structure, allow us to apply directly the the-ory of order-restricted regressions to test for the MLR order.
Dependence is likely the case for economic applications to contract and auction analysis, because the observed data will almost certainly be conditioned on common environments and structural relations. In the auction setting, a bid value is deter-mined by the bidder’s underlying preferences for the good and by signals about the good. If bidders can be ordered accord-ing to the strength of preference for a good, then this order is likely to be at least partially preserved under alternative sig-nals received from the market. Thus, bids of the same individ-ual in multiple-round auctions are likely to be correlated. In the extreme case, bids should not respond at all to signals if the sig-nals are void of information. For contracts on production out-comes, experimental data evaluating outcomes at varying effort or input levels are likely to be correlated if environmental and weather conditions cannot be perfectly controlled for.
3. A NONPARAMETRIC TEST FOR STOCHASTIC ORDER
Let y»F be a random variable whose distribution func-tion,y»F.yjx/, is conditioned by the decision variable,x, and whose range is limited to the arbitrarily large closed interval A½R. To set up notation for the statistical test, we divide the
range into a partition characterized by the completely ordered vector.a1;a2; : : : ;ak/, and we leta0Dinf.A/. The probability
pi;jDPr.y2[aj¡1;aj]jxDxi/ denotes the conditional proba-bility thaty falls into the jth interval given that the decision variable takes the valuexi. LetpiD.pi;1;pi;2; : : : ;pi;k/0, with pi;kC1D1¡PjkD1pi;j, so that pi fully describes the discrete approximation of the conditional distribution. This notation al-lows us to describe the MLR order in the following manner.
Denition 1. Random variable yiC1 » F.yjxiC1/ is said
to dominate random variable yi »F.yjxi/ according to the monotone likelihood ratio order if, for any partition of the range, pi;j=pi;jC1¸piC1;j=piC1;jC1 8j2 f1;2; : : : ;kg. In this
case, we writeyiC1ºryi.
The denition carries over to the case where more than two distributions are compared. If we letiD f1;2; : : : ;mC1gindex the distributions of interest, then we say that a sequence of dis-tributions is stochastically ordered in the MLR sense whenever ymC1ºrymºr¢ ¢ ¢ ºry1.
When testing for stochastic order among distribution func-tions, randomness arises because the sample data represent the underlying true populationdistribution only imperfectly. A test-ing procedure should take this randomness into account. It should also acknowledge the possibility of dependence through common conditioning environmental and economic factors. Many of the tests for stochastic orderings available in the liter-ature are ill-suited to model the typical economic environment, because these tests suppose that samples are drawn indepen-dently. We overcome this problem by adapting a theorem of Davidson and Duclos (2000) to develop a test that takes explicit account of the covariance structure between conditional distri-butions. This allows us to derive the asymptotic distributions of the variables of interest. We can then apply results for order-restricted inference (see Robertson, Wright, and Dykstra 1988) to test for the MLR order.
This section is structured as follows. After preparing the test statistic, we derive its asymptotic distribution. Then we intro-duce the concepts of order-restricted inference that allow us to proceed with a one-sided test for the MLR order.
3.1 A Presentation of Data for Hypothesis Testing
The hypothesis to be tested involves a comparison ofmC1 conditional empirical distribution functions, and the data pro-cessing algorithm to be used treats the data as a single set. For thepi associated with themC1 evaluations of the condition-ing variable, form ak£.mC1/matrix and denote it by p. Identify by vec.p/the.mC1/k£1 vector formed by stacking the columns inp. Denote thek£kidentity matrix byIk, and denote the upper triangular matrix of 1’s byTk. Observe that the inverse of the latter,T¡k1, has 1’s on the diagonal and¡1’s on the rst upper diagonal. Also, deneDmas them£.mC1/ matrix with entriesdi;j, wheredi;iD1,di;iC1D ¡1, anddi;jD0 otherwise.
Deneµi;jDln.pi;j=pi;kC1/so thatµi;jis the multivariate lo-gistic transformation ofpi. Collect theseµi;jevaluations into a k£.mC1/matrix, and call it 2. Note that ln.pi;j=pi;jC1/D
Roosen and Hennessy: Testing for the Monotone Likelihood Ratio Assumption 361
µi;j¡µi;jC1 forj<kand ln.pi;j=pi;jC1/Dµi;k forjDk. Fol-lowing Dardanoni and Forcina (1998), the MLR order implies that
brD.DmTk¡1/vec.2/¸0; (1)
where premultiplication by matrixT¡k1replaces the numeraire residual probability with an adjacent probability in the ratios given byµi;j, and whereDmgenerates comparisons across the distributions under consideration.
The covariance matrix of the test statistic is a function of the cdf’s. These cdf’s are, in turn, monotone transforms of the data under scrutiny. Consequently, it is important to account for possible correlation among observations when estimating the covariance matrix.
3.2 Asymptotic Properties of the Test Statistic
Davidson and Duclos (2000) presented a theorem, which we adapt to our case as Lemma A.1 in Appendix A, that identies the asymptotic properties of two correlated cdf’s for two sam-ples of sizen. Using their result on the asymptotic properties of the cdf estimates and using the delta method (Lemma A.2, App. A), we can derive the asymptotic properties of the statis-ticsbr. Let vectorFihave thejth ordinateFi;jDPr.y·ajjxi/D
Pj
lD1pi;l;jD1;2; : : : ;k. For theFiassociated with themC1 conditioning variables, form ak£.mC1/matrix and denote it byF. Let vec.F/be the.mC1/k£1 vector obtained after stacking the columns in sequence, whereF1provides the rstk
entries.
Proposition 1.Let6be the covariance matrix of vec.F/. De-ne, fori2 f1;2; : : : ;mg, thek£kmatrix,
The proof is provided in Appendix B. It remains to pose the hypothesis that we seek to test.
3.3 Hypothesis Testing
We wish to test forH0overH1, where
H0:br¸0 (weak order)
and
H1: (The distributions are not ordered in the sense ofH0):
The test is based on a distance statistic and has been developed in the context of order-restricted inference by Robertson et al. (1988), among others. Let0 denote a convex cone contained in Rv, and let the positive denitev£vmatrix Vdescribe a metric. Then the distance between a vectorz2Rº and set0 is dened as
d.z; 0; V/Dinf Q
z20.z¡ Qz/
0V¡1.z¡ Qz/: (4)
Viewing the null and alternative hypotheses as subspaces, H0,H1½Rv, the distance statistic may be written as
D0;1Dn©d.bOr;H0;V/¡d.bOr;H0[H1;V/ª: (5)
The distance statistic equals 0 whenever the sample value of bOr is consistent with the null hypothesis. For pn.Obr ¡ Problem (6) is solved through quadratic programming, and the covariance matrix is estimated by its sample equivalent. Test statistic D0;1 is Â2 distributed such that Pr.D0;1¸c/D
Pmk
lD0Pr.Âl2¸c/w.mk;mk¡l;6r/, and the null hypothesis is evaluated at its least favorable alternative, that is, at brD0 (Wolak 1989, p. 214). The Â2 distribution is a mixture of weighted chi-squared distributions, where the Â02 distribution is dened as the point mass at the origin. The weights given by w.mk;mk¡l;6r/are the probabilities that vectorbr has ex-actlymk¡lpositive elements, where, by denition, these prob-abilities sum to 1. The exact critical values depend explicitly on covariance matrix6r and are difcult to determine fork>4. (See Kudô 1963 for the closed-form solution formulas when k·4).
Following Wolak (1989), we determine these values through Monte Carlo simulations. Drawing 1,000 times from the multi-variate normal distribution with mean0and covariance matrix
6r, we compute vectorbQr for each draw. The weights are the proportions of the 1,000 draws such thatbQr has exactlyl pos-itive elements. All covariance matrices are estimated by their sample equivalents.
4. APPLICATION TO PRODUCTION TECHNOLOGY
Site-level information on the use of nitrogen and other inputs is not available to crop insurance companies. Although these inputs are tangible, and purchases of articial sources of ni-trogen can be documented, the inputs can be stored for future use, sold or bartered on secondary markets, or applied on land other than that planted under the insured crop. Thus crop insur-ers are posed with a moral hazard problem that can be avoided only by incurring prohibitively large monitoring costs. Cham-bers (1989) has shown that the MLR order plays an important role in understanding the moral hazard constraints that a crop insurer countenances when designing a contract. Specically, with an action-induced MLR dominance order and constant absolute risk aversion, the risk-neutral insurer will leave the grower with a positive fraction of incremental crop revenue. In this way, incomplete risk shifting is used to encourage input use
by the grower. Were the risk-neutral insurer perfectly informed, then she would have assumed all the risk. Thus the equilibrium contract is not optimal, but rather is an information-constrained optimum. The moral hazard problem would appear to be par-ticularly severe in crop agriculture. Babcock and Hennessy (1996), among others, have identied moral hazard as one of the main reasons for the failure of commercial crop insurance mar-kets in the United States and elsewhere. Although commercial crop insurance markets do exist in the United States, their vi-ability is underpinned by government subsidies. Also, the U.S. federal government has at times made crop insurance coverage a prerequisite in determining eligibility for agricultural income support.
4.1 Data
Data were obtained from Iowa corn plots grown by the Iowa State University agronomy nitrogen research team during the 5-year period 1987–1991. The data were previously described by Babcock and Hennessy (1996). Four geographically dis-persed farms sites were involved, and 10 different nitrogen ap-plication levels, ranging from 0 to 300 lb=acre, were applied. The rates increment by 25 lb=acre at low application rates and by 50 lb=acre at higher application rates. The dataset comprises 600 observations, where there are 60 observations per nitrogen application rate. To aggregate across years and sites, we cor-rect the distributions by year and site factors. The details are provided in Appendix C.
The input-conditioned empirical distributions of corn yields that we compare are the nine pairs of adjacent nitrogen appli-cation rates; 0 lb=acre versus 25 lb=acre to 250 lb=acre versus 300 lb=acre. To form the partition of the yield range, the vectors of the distributions (two or more) to be compared are stacked and then divided intokC1D5 equiprobable intervals. Then, using these intervals, the empirical cdf is calculated at each ni-trogen application rate. The number of intervals was chosen in order to ensure that each cell receives a strictly positive proba-bility weight for each of the distributions being compared.
Observations in the same year or from the same site are likely to be correlated because of similar weather and soil conditions. Although our data transformation corrects for linear differences in distribution location, it does not affect higher moments of the
distribution.Consequently,it does not remove all possible kinds of dependencies between observations. Remaining dependen-cies are admissible in our test, however, because the test does not require independence among distributions being compared.
4.2 Results
Note that a rejection ofH0, implying thatyiC1does not MLR
dominateyi, does not imply thatyiMLR dominatesyiC1. But
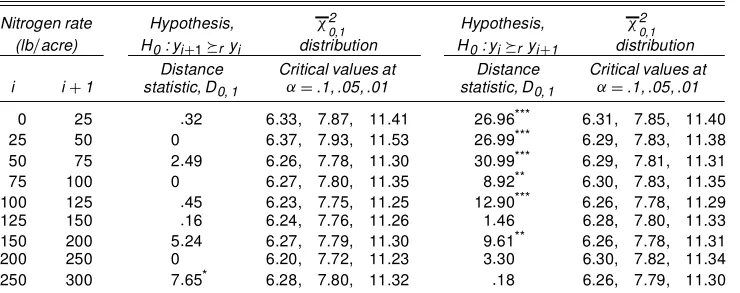
the comparison of distributions can certainly be turned around to test for the latter relationship. We do so, and consequently report two sets of results. Because the random variables can be exchanged in this manner, thebQr vector for the test in one di-rection is the additive inverse of the test in the reverse didi-rection. Table 1 presents the results when comparing two distribu-tions. The rst set of columns (columns 1 and 2) show pairs of nitrogen application rates,iandiC1, for which the distributions are compared. The second set of columns (columns 3 and 4) are labeled yiC1 ºr yi, and compare the distributions in the sense that the yield distribution of the higher nitrogen applica-tion level dominates the yield distribuapplica-tion of the lower nitrogen application level. The third set of columns (columns 5 and 6) are labeledyiºryiC1, and compare the distributions in the
re-versed direction. Columns 3 and 5 report the test statistic forH0 againstH1. Columns 4 and 6 report the .1, .05, and .01 critical
values of theÂ20;1 distribution for the respective comparisons. The exact value depends on the covariance matrix6r, and so the values depend on the pair of distributions under comparison. We observe in column 3 thatH0is not rejected in favor ofH1
for nitrogen applications between 0 lb=acre and 250 lb=acre at any signicance level. This provides strong evidence in favor of the MLR order. These results are again conrmed in the re-verse comparison in Table 1. Here the MLR order, when com-paring distributions in the direction of decreasing order, is re-jected in favor ofH1.no order) at the .05 signicance level in
six of the nine comparisons. The exceptions are for the com-parison of 150 lb=acre versus 125 lb=acre, for the comparison of 250 lb=acre versus 200 lb=acre, and for the comparison of 300 lb=acre versus 250 lb=acre. In Iowa, the commercial nitro-gen application rate is typically between 100 and 200 lb=acre (Duffy and Smith 2003), and commercial rates have not varied much over the past 20 years.
Table 1. Order-Restricted Test for Likelihood Ratio Order
Nitrogen rate Hypothesis, Â2
0,1 Hypothesis, Â
2
0,1 (lb=acre) H0: yiC1ºryi distribution H0: yiºryiC1 distribution
Distance Critical values at Distance Critical values at i iC1 statistic, D0, 1 ®D.1, .05, .01 statistic, D0, 1 ®D.1, .05, .01
0 25 :32 6.33, 7.87, 11.41 26:96*** 6.31, 7.85, 11.40
25 50 0 6.37, 7.93, 11.53 26:99*** 6.29, 7.83, 11.38
50 75 2:49 6.26, 7.78, 11.30 30:99*** 6.29, 7.81, 11.31
75 100 0 6.27, 7.80, 11.35 8:92** 6.30, 7.83, 11.35
100 125 :45 6.23, 7.75, 11.25 12:90*** 6.26, 7.78, 11.29
125 150 :16 6.24, 7.76, 11.26 1:46 6.28, 7.80, 11.33
150 200 5:24 6.27, 7.79, 11.30 9:61** 6.26, 7.78, 11.31
200 250 0 6.20, 7.72, 11.23 3:30 6.30, 7.82, 11.34
250 300 7:65* 6.28, 7.80, 11.32 :18 6.26, 7.79, 11.30
NOTE: *, **, and *** denote signicance at the .1, .05, and .01 levels. Parameterkhas value 4.
Roosen and Hennessy: Testing for the Monotone Likelihood Ratio Assumption 363
In microeconomic analysis, it is common to assume that the MLR order holds globally. We test this hypothesis over the economically relevant range of fertilizer applications of 100–200 lb=acre wheremD3. The hypothesisy200ºry150ºr y125ºry100 generates the test statistic value of 3.53. The
hy-pothesis is not rejected at any conventional signicance level. (The critical values are 9.89, 11.82, and 15.92 at the .1, .05, and .01 signicance levels.) However, the reverse hypothesis, with a test statistic of 40.15, is rejected at the 1% signicance level. (The critical values are 9.94, 11.88, and 15.98 at the .1, .05, and .01 signicance levels.)
5. APPLICATION TO AUCTIONS
Laboratory auctions have received increasing interest in eval-uating decision making, in assessing the acceptance of new products, and in understanding reactions to publicly posted in-formation. Many of these auctions proceed in multiple rounds and post the prevailing market price after every trial. This pro-cedure allows newcomers to gain experience in the “market.” Often only one of multiple rounds is chosen at random as the “binding” auction. This “random trial” design avoids complica-tions of multi unit demand or rapidly declining marginal valua-tions while preserving the incentive to bid the true valuation in every round.
Concern exists that posting price information could alter bids when valuations are correlated in the afliation sense. In our second application, we show how the test can be applied to the hypothesisof an afliated, symmetric distribution of valuations, which is one of the principal assumptions underlying the stan-dard auction model. Because the afliation property coincides with the multivariate extension of the MLR ordering when the bidders are symmetric, if posting the price is found to shift bid distributions in the MLR sense, then strong evidence would ex-ist that the underlying values are drawn from an afliated dis-tribution.
Testing for the property has been of interest in common value auctions under asymmetric information. A common value auc-tion is one in which all bidders place equal, but unknown, value on an asset. A private value auction is one in which bidders place different values on the asset. Using data from oil and gas lease auctions, Hendricks et al. (1990) developed and im-plemented an informal test for the MLR order on the bid dis-tributions among informed and uninformed bidders. The test supported their assumption of an MLR dominating shift be-tween bid data from informed and uninformed bidders.
In a review of empirical auction analyses, Laffont (1997) elaborated a parsimonious set of restrictions—namely, aflia-tion and symmetry—that allows the econometric estimaaflia-tion of structural auction models. Athey and Levin (2001) also relied on the assumption of value afliation in their empirical analysis of U.S. Forest Service Timber auctions. However, as McAfee and McMillan (1997, p. 727) noted, many important results, such as the revenue equivalence theorem of the rst price, sec-ond price, English and Dutch auctions, depend on the appropri-ateness of the underlying assumption of value afliation. The relevance of these results cannot be conrmed without testing
for the afliation property itself, and so there is a signicant unanswered question regarding the empirical relevance of nd-ings in the auction modeling literature.
Possible value afliation has been subject to a critical assess-ment in private-value, multiple-round Vickrey auctions with price posting after every round. Agents extract information on value perceptions from price formation in the market. Conse-quently, price posting allows buyers with afliated values to update their values iteratively as evidence mounts to allay fears of falling foul to the winner’s curse of overbidding. List and Shogren (1999) used least squares methods to ascertain how intermediate-round price information affects bidding behavior in multiple-round auctions. Data were drawn from auction ex-periments evaluating willingness to pay for pathogen-screened meat sandwiches. They found that posted prices do not affect the behavior of the median experienced bidder, but do affect the behavior of the median bidder among bidders unfamiliar with a product. In contrast to List and Shogren (1999), who tested for linear correlation between posted price and the median bid in the subsequent round, we apply our methods to test for the MLR order on distributions of bids cast in consecutive rounds. Because the auctions are Vickrey, the bids reveal the valuations. Therefore, we are testing for the MLR ordering on conditioned distributions of valuations.
5.1 Data
We use data from a laboratory auction where participants were asked for their willingness to pay to exchange a typi-cal meat sandwich with a sandwich that has been carefully screened for eitherCampylobacterorSalmonella contamina-tion (Shogren, Shin, Hayes, and Kliebenstein 1994). The so-licitation mechanism is a second-price, multiple-round auction. For each pathogen, one auction experiment was run with 15 bidders each. The prevailing market price was posted after each round. The auction consists of 10 rounds of naive bids, where subjects did not receive any information on the risk involved in
Campylobacter/Salmonellainfection. However, subjects were
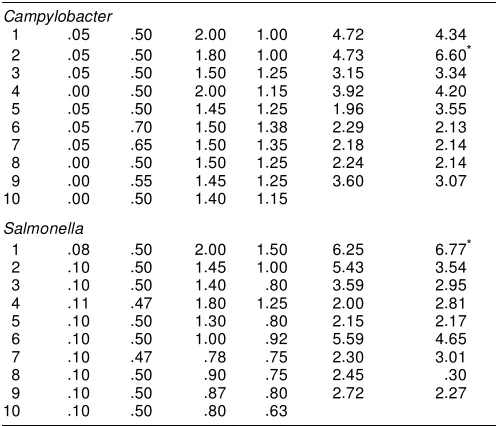
informed that the stringently screened sandwich posed a prob-ability of illness that amounts to 1 in 100 million. At the end of the experiment, one of the 10 rounds was randomly selected as the binding auction. The highest bidder in this round had to exchange his sandwich at the price of the second highest bid in this round. Some summary statistics are provided in Table 2, where the median bid is shown alongside the posted price (the second-highest bid) in each round. The prevailing market price varies between $1.00 and $1.38 for the sandwich screened for
Campylobacterand between $.63 and $1.50 for the sandwich
screened forSalmonella.
5.2 Results
In our data analysis, we chose kD4. Because the condi-tioning variable, the posted price, does not necessarily change monotonically along the sequence of trials, we compare only pairs of distributions.mD1/. Table 2 shows the results in the fourth and fth columns. Of the 36 comparisons, we nd only two rejections, one in the case ofCampylobacterand one in the
Table 2. Auction Bid Distribution After Price Posting
Trial
i Minimum Median Maximum Price H0: yiC1ºryi H0: yiºryiC1
Campylobacter
1 :05 :50 2:00 1:00 4:72 4:34
2 :05 :50 1:80 1:00 4:73 6:60*
3 :05 :50 1:50 1:25 3:15 3:34
4 :00 :50 2:00 1:15 3:92 4:20
5 :05 :50 1:45 1:25 1:96 3:55
6 :05 :70 1:50 1:38 2:29 2:13
7 :05 :65 1:50 1:35 2:18 2:14
8 :00 :50 1:50 1:25 2:24 2:14
9 :00 :55 1:45 1:25 3:60 3:07
10 :00 :50 1:40 1:15
Salmonella
1 :08 :50 2:00 1:50 6:25 6:77*
2 :10 :50 1:45 1:00 5:43 3:54
3 :10 :50 1:40 :80 3:59 2:95
4 :11 :47 1:80 1:25 2:00 2:81
5 :10 :50 1:30 :80 2:15 2:17
6 :10 :50 1:00 :92 5:59 4:65
7 :10 :47 :78 :75 2:30 3:01
8 :10 :50 :90 :75 2:45 :30
9 :10 :50 :87 :80 2:72 2:27
10 :10 :50 :80 :63
NOTE: * denote signicance at the .1 level. Parameterkhas value 4.
case ofSalmonella. This means that to a large extent, a statisti-cally signicant MLR ordering on the distribution shift cannot be discerned for most comparisons.
The two instances where we identify the MLR order are in the comparison of trials 2 and 3 in the instance of Campylobac-terand in the comparison of trials 1 and 2 in the instance of Salmonella. For both pathogens the price signal has shifted the distribution upward in the MLR sense. That is, the price infor-mation was taken by the subjects to be a positive signal, “good news” in the words of Milgrom (1981a).
Our results conrm those of List and Shogren (1999). For newcomers evaluating unfamiliar goods, price posting might lead to weak afliation of the bid distribution. If posted prices are interpreted as informative signals on value, we would expect this to be the case early in the auction. However, the afliation effect disappears after trial 3, when the information adjusted values settle to a new equilibrium.
6. CONCLUSION
In this article we have presented a robust procedure to test for stochastic order between distributionsthat takes into explicit account the correlation structure of the distributions being com-pared. Using agricultural crop trials data, we applied the test to identify stochastic order in the likelihood ratio sense. Our re-sults support the hypothesis of MLR order over a large range of input levels. We conclude that the MLR assumption commonly made in theoretical work is conrmed for our dataset. In a sec-ond application,we studied private evaluations of an unfamiliar good in a multiple-round Vickrey auction to identify some ev-idence in favor of the afliated values assumption commonly used in the economics of imperfect information.
Other stochastic orders also arise in economic models. The test can be readily extended to accommodate alternative
uni-variate stochastic orders such as the reversed-hazard (monotone probability ratio) order that has arisen in portfolio theory (Athey 2002) and elsewhere.
ACKNOWLEDGMENTS
The authors thank, without implication, Brent Hueth for con-versations on empirical contract design issues and Jay Shogren for providing the auction data as well as for insightful discus-sions on value afliation. They also thank two anonymous re-viewers and the associate editor for helpful comments. Most of the research was done while Roosen was assistant professor at the University of Louvain, whose support is gratefully acknowl-edged.
APPENDIX A: LEMMAS
Lemma A.1 is adapted from Davidson and Duclos (2000, p. 1444) when applied to cdf’s. LetFOi.y/be the empirically ob-served cdf corresponding to the true distributionFi.y/. Dene function ind.yi·y/as the indicator function, assuming value 1 when the argument is true and 0 otherwise, and let expression E[ind.yA·y/ind.yB·y0/] be the unconditional expectation on the product of indicator functions for random variablesyA andyB.
Lemma A.1. Fori2 fA;Bg, the statisticpn[FOi.y/¡Fi.y/] is asymptotically normal with mean 0 and asymptotic covariance structure given by
lim
n!1ncov
£O
FA.y/;FOB.y0/
¤
DE£ind.yA·y/ind.yB·y0/¤¡FA.y/FB.y0/: (A.1)
The covariance matrix6D.¾i;j/may be consistently esti-mated from the empirical distribution function (Davidson and Duclos 2000, p. 1445)
O
¾i;jDn¡1 n
X
mD1
ind.yAm·y/ind.yBm·y0/¡ OFi.y/FOj.y0/;
fi;jg 2 fA;Bg: (A.2)
Lemma A.2 provides the delta method (Greene 2000, p. 118) that we use to establish asymptotic distributions.
Lemma A.2. Ifznis aK£1 sequence of vector-valued ran-dom variables such thatpn.zn¡¹/
d
!N.0;6/, and ifc.zn/is a set ofJcontinuous functions ofzn, not involvingn, then
p
n[c.zn/¡c.¹/] d
!N£0;C.¹/6C.¹/0¤
whereC.¹/is theJ£Kmatrix given by@c.¹/=@¹0.
Roosen and Hennessy: Testing for the Monotone Likelihood Ratio Assumption 365
APPENDIX B: PROOF OF PROPOSITION 1
The test statistic is given bybrD.DmTk¡1/vec.2/, where
Because the covariance structure of the cdf’s can be esti-mated using Lemma A.1, (B.1) will allow asymptotic estima-tion of the test statistic moments. Noting thatFi;1Dpi;1,i2
f1;2; : : : ;mC1gandFi;j¡Fi;j¡1Dpi;j,i2 f1;2; : : : ;mC1g, j2 f2;3; : : : ;kg, the derivative ofbrwith respect toF,@br=@F, may be written as themk£.mC1/kmatrix given in (3). The result follows after applying Lemma A.2.
APPENDIX C: TRANSFORMATION OF PRODUCTION DATA
A statistical analysis of Iowa corn yields at the state level identies a clear time trend in the data due to technical progress over the period 1973–1999. To control for this, we postulate a deterministic component of yield depending on time, on-site effects, and a random component. To account for changes in yield due to technical progress, the data are corrected by esti-mating a linear time trend for Iowa corn yields from Iowa av-erage yield over the period 1973–1999 (from the Iowa Dept. of Agriculture). Corn yields are estimated to increase by 1.753 bushels=acre=year, where the regressionR2is .389 and the pa-rameter to the linear time trend has a t value of 3.986. Us-ing the trend-corrected yield data, we tested for equality in means across sites. We rejected the hypothesis of equality at the 5% level withF3;596D3:36. For this reason, we proceeded by
correcting for the mean differences across sites, using a xed-effects model that accounts for correlation among observations coming from the same site.
[Received August 2001. Revised April 2003.]
REFERENCES
Anderson, G. (1996), “Nonparametric Tests of Stochastic Dominance in In-come Distributions,”Econometrica, 64, 1183–1193.
Athey, S. (2002), “Monotone Comparative Statics Under Uncertainty,” Quar-terly Journal of Economics, 117, 187–223.
Athey, S., and Levin, J. (2001), “Information and Competition in U.S. Forest Service Timber Auctions,”Journal of Political Economy, 109, 375–417. Babcock, B. A., and Hennessy, D. A. (1996), “Input Demand Under Yield
and Revenue Insurance,”American Journal of Agricultural Economics, 78, 416–427.
Bartolucci, F., and Forcina, A. (2000), “A Likelihood Ratio Test for MTP2 Within Binary Variables,”The Annals of Statistics, 28, 1206–1218. Beach, C. M., and Davidson, R. (1983), “Distribution-Free Statistical Inference
With Lorenz Curves and Income Shares,”Review of Economic Studies, 50, 723–735.
Chambers, R. G. (1989), “Insurability and Moral Hazard in Agricultural Insur-ance Markets,”American Journal of Agricultural Economics, 71, 604–616. Chow, K. V. (1989), “Statistical Inference for Stochastic Dominance:
A Distribution-Free Approach,” unpublished doctoral thesis, University of Alabama.
Dardanoni, V., and Forcina, A. (1998), “A Unied Approach to Likelihood In-ference on Stochastic Ordering in a Nonparametric Context,”Journal of the American Statistical Association, 93, 1112–1123.
(1999), “Inference for Lorenz Curve Orderings,”Econometrics Jour-nal, 2, 49–75.
Davidson, R., and Duclos, J.-Y. (2000), “Statistical Inference for Stochastic Dominance and for the Measurement of Poverty and Inequality,” Economet-rica, 68, 1435–1464.
Duffy, M., and Smith, D. (2003), “Estimated Costs of Crop Production in Iowa, 2003,” University Extension report, Iowa State University.
Dykstra, R., Kochar, S., and Robertson, T. (1995), “Inference for Likelihood Ratio Ordering in the Two-Sample Problem,”Journal of the American Sta-tistical Association, 90, 1034–1040.
Greene, W. H. (2000),Econometric Analysis(4th ed.), Upper Saddle River, NJ: Prentice-Hall.
Hendricks, K., Porter, R. H., and Wilson, C. A. (1990), “Auctions for Oil and Gas Leases With an Informed Bidder and Random Reservation Price,” Dis-cussion Paper 910, Center for Mathematical Studies in Economics and Man-agement Science, Northwestern University.
Innes, R. (1993), “Financial Contracting Under Risk Neutrality, Limited Lia-bility and Ex Ante Asymmetric Information,”Economica, 60, 27–40. Iowa Dept. of Agriculture (various years),Iowa Agricultural Statistics, annual
publication, Des Moines, IA.
Klecan, L., McFadden, R., and McFadden, D. (1991), ”A Robust Test for Sto-chastic Dominance,” mimeo, Massachusetts Institute of Technology. Koh, W. T. H. (1992), “Note on Modeling Tournaments,”Journal of Economics,
55, 297–308.
Kudô, A. (1963), “Multivariate Analogue of the One-Sided Test,”Biometrika, 50, 403–418.
Laffont, J.-J. (1997), “Game Theory and Empirical Economics: The Case of Auction Data,”European Economic Review, 41, 1–35.
Landsberger, M., and Meilijson, I. (1990), “Demand for Risky Financial Assets: A Portfolio Analysis,”Journal of Economic Theory, 50, 204–213. List, J. A., and Shogren, J. F. (1999), “Price Information and Bidding
Behav-ior in Repeated Second-Price Auctions,”American Journal of Agricultural Economics, 81, 942–949.
McAfee, R. P., and McMillan, J. (1987), “Auctions and Bidding,”Journal of Economic Literature, 25, 699–738.
Milgrom, P. R. (1981a), “Good News and Bad News: Representation Theorems and Applications,”The Bell Journal of Economics, 12, 380–391.
(1981b), “Rational Expectations, Information Acquisition, and Com-petitive Bidding,”Econometrica, 49, 921–943.
Milgrom, P. R., and Weber, R. J. (1982), “Theory of Auctions and Competitive Bidding,”Econometrica, 50, 1089–1122.
Richmond, J. (1982), “General Method for Constructing Simultaneous Con-dence Intervals,” Journal of the American Statistical Association, 77, 455–460.
Robertson, T., Wright, F. T., and Dykstra, R. (1988),Order-Restricted Statisti-cal Inference, New York: Wiley.
Savin, N. E. (1984), “Multiple Hypothesis Testing,” inHandbook of Economet-rics, Vol. II, eds. Z. Griliches and M. D. Intriligator, Amsterdam: Elsevier Science Publishers, pp. 828–879.
Shaked, M., and Shanthikumar, G. J. (1994),Stochastic Orders and Their Ap-plications, San Diego: Academic Press.
Shogren, J. F., Shin, S. Y., Hayes, D. J., and Kliebenstein, J. B. (1994), “Resolv-ing Differences in Will“Resolv-ingness to Pay and Will“Resolv-ingness to Accept,”American Economic Review, 84, 255–270.
Wolak, F. A. (1989), “Testing Inequality Constraint in Linear Econometric Models,”Journal of Econometrics, 41, 205–235.
Zheng, B. (2002), “Testing Lorenz Curves With Non-Simple Random Sam-ples,”Econometrica, 70, 1235–1243.
Zheng, B., and Cushing, B. J. (2001), “Statistical Inference for Testing In-equality Indices With Dependent Samples,”Journal of Econometrics, 101, 315–335.