TOWARDS THEMATIC WEB SERVICES FOR GENERIC DATA
VISUALIZATION AND ANALYSIS
T. Horanont a, *, M. Basa,b R. Shibasaki c a
Institute of Industrial Science, University of Tokyo, 4-6-1 Komaba, Meguro-ku, Tokyo 153-8505, Japan - teerayut@iis.u-tokyo.ac.jp
b Georepublic, 3-24-14 Honmachi, Shibuya, Tokyo 151-0071, Japan - mario@georepublic.co.jp
c Center for Spatial Information Science, University of Tokyo, 5-1-5 Kashiwanoha, Kashiwa, Chiba 277-8568, Japan - shiba@csis.u-tokyo.ac.jp
Commission IV, WG IV/5
KEY WORDS: GIS, Cartography, Services, Mapping, Visualization, Web based, Spatial
ABSTRACT:
Spatial analysis packages and thematic mapping are available in a number of traditional desktop GIS. However, visualizing thematic maps through the Internet is still limited to fix contents and restrict changes of the input data. The users with limited GIS knowledge or people who do not own digital map data are normally having difficulties to create output thematic maps from generic data. In this study, we developed thematic mapping services that can be applied to non-spatial data format served through powerful map services solutions. Novice users who have no GIS software experience or have no digital base map can simply input a plain text file with location identifier field such as place name or gazetteer to generate thematic maps online. We implemented a prototype by using web service standards recommended by the Open Geospatial Consortium (OGC) such as Web Map Service (WMS), Web Feature Service (WFS) and Styled Layer Descriptor (SLD) to provide a principle for communication and allow users to visualize spatial information as thematic maps. The system dedicates a great deal of effort to the initial study of geospatial analysis and visualization for novice users including those with no past experience using Geographic Information Systems.
1. INTRODUCTION
1.1 Online Thematic Mapping for Geographic Information Visualization
A thematic is a type of map or chart especially designed to show a particular theme connected with a specific geographic area. It generally displays spatial patterns of a real world phenomenon and widely uses as qualitative analytical methods to depict and analyze daily life information in geographical space. The most common use of thematic maps is a choropleth map in which areas are shaded or patterned showing the measurement of the statistical variable on the map. Population density or per-capita income is a common example. Thematic mapping has a long history in cartography and in the PC software platform. However, as the Internet developed further and as online applications began to appear and played a more important role in contemporary geospatial processing, especially in the context of geospatial visualization including thematic displays, thus there is a need in driving evolutionary change of map generation and therefore is focussed in this paper.
1.2 Related Work
What it has shown recently is the increasing use of Web Map Services (WMS) for publishing maps in the web environment. Hong et al. (2005) introduced OpenGIS technology for the creation of thematic maps based on a number of OGC standards like GDAS, GLS, and WMS. The proposed service architecture works on the basis of standardized interface and allows data to
be integrated easily. Voss et al (2000) implemented a Descartes system, which is specifically designed to support thematic mapping by automatically proposing alternative visualization of geo-referenced statistical variables and by providing many functions for analysis. Nevertheless, the system still relies on the self-input base map, which has to be loaded by the users.
While the thematic map covers a large geographic area, the amount of base map data needed is enormous, finding good base map data and thematic data for spatial questions has always been difficult (Cammack, 2005). Novice GIS users usually face difficulty in finding digital map and manipulate the data to create thematic maps. Commack proposed a prototypical example of data gathering by using WMS solution to collect base map data from providers in real time and allows the cartographer to focus on developing the best thematic content of the map. Andrienko et al. (2001b) developed a set of tools for classification that facilitate looking on data from various viewpoints such as statistical distribution of attribute values, means for automatic classification, class boundaries and calculation of statistical quality of a classification. These techniques can be applied to automate the process of thematic classification. To identify the geographic feature on the map, people usually use geographic names or gazetteers to denote a certain coordinate. Volz et al. (2007) introduced an ontology-based approach to disambiguate geographical names in texts. All these previous works provide general solutions for generating thematic map using web technology. However, there is no key strategy for non-GIS users, which traditionally had
ISPRS Annals of the Photogrammetry, Remote Sensing and Spatial Information Sciences, Volume I-4, 2012 XXII ISPRS Congress, 25 August – 01 September 2012, Melbourne, Australia
very little interaction with the spatial data. Can they easily use it in their operations?
There are few of existing services available on the Internet at the current review of this study. The Plug and Play Maps created by GISmatters (http://www.plugandplaymaps.com/) is a free web service that lets you embed interactive thematic maps in your web pages with a single line of code that indicates the data you have to map and the way you want to display. Another example is Geobrowser (http://thematicmapping.org/). This site provides Thematic Mapping API that allows you to create KML based thematic maps from your own data source. ArcGIS.com is the most recent web map services provided by ESRI, which allow users to visualize and create thematic contents by providing a neutral background with minimal colors, labels, and features. However, none of them offer a wide range of flexible delivery of the thematic map, for instance, base map registration, simple data input such as cut and paste a generic text from their desktop document and in term of location discovery aspect. The Plug and Play Maps provide a built-in coordinate database for common features but it is limited only to the use of state or country codes. This paper introduces a novel key strategy to use of integrated open source and open standard geospatial technology to facilitate possible resolution of thematic map generation for novice users as a prototype system.
2. DATA INPUT AND CLASSIFICATION SCHEMES
2.1 Data Input
Automated cartographic interpretation of generic data requires an intelligent spatial data discovery and integration of geographic information system to perform a result map. We demonstrate the concept by building a geo-portal site that accepts a generic data input (Figure 1). The generic data required for this system is a simple text format that uses delimiter separated values. This format stores two-dimensional arrays of data by separating the values in each row with specific delimiter characters. The first row is expected as header information and the first column is expected to be place identifier.
Figure 1. A prototype of thematic map service
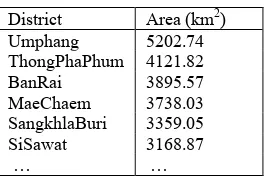
A sample of generic data can be explained as shown in Table 1 and the output thematic map that has been automated classified base on district name and area is presented in appropriated choropleth map (Figure 2).
District Area (km2) Umphang 5202.74 ThongPhaPhum 4121.82
BanRai 3895.57
MaeChaem 3738.03 SangkhlaBuri 3359.05 SiSawat 3168.87
… …
Table 1. Simple data input of district name and area in square kilometers
Figure 2. An output choropleth map produced from thematic mapping service
2.2 Classification Schemes
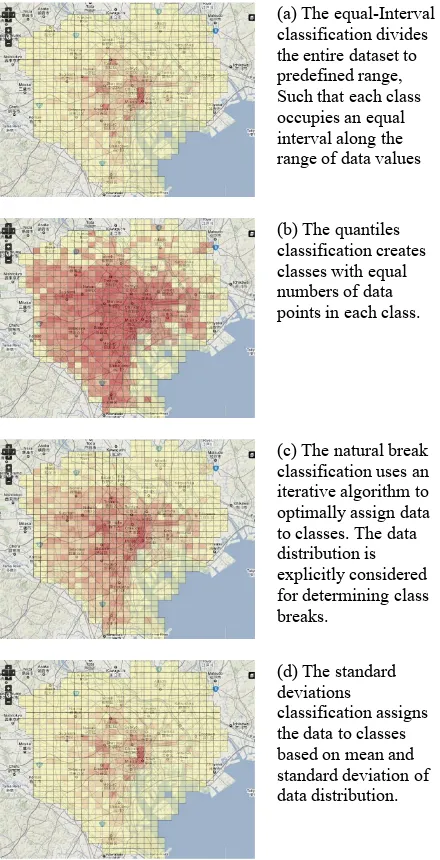
The thematic map is simply used to enhance the understanding of the map's theme and purpose. Data values are classified into ranges and this aids the reader’s interpretation of the map. In this prototype system, 4 major classification schemes are implemented. Each method has advantages and disadvantages that make it suitable for certain data sources. These include the equal-interval classification, the quantiles classification, the natural breaks classification and the standard deviations classification.
Since choropleth map uses map color to represent statistical data. A simple color scheme and division numbers are provided as standard visualization and presentation technique. To choose the proper classification scheme is, however, one of the most important in order to have the correct interpretation of data, and also the most difficult to understand for novice users. The automated selection scheme is provided in this service and it is processed based on statistical distribution assumptions. The automated classification processes make novice users who have no GIS software experience can easily create and understand choropleth maps.
3. THEMATIC MAPPING SERVICE
Service Workflow
The key issue of providing thematic mapping service is the automatic and real-time transformation from generic text data to map through information extraction and knowledge discovery. The thematic engine is developed in order to provide the result thematic maps online.
ISPRS Annals of the Photogrammetry, Remote Sensing and Spatial Information Sciences, Volume I-4, 2012 XXII ISPRS Congress, 25 August – 01 September 2012, Melbourne, Australia
Figure 3. Concept workflow of thematic engine system
The system is designed to cope with the heterogeneity of the Internet components and to ensure future integration and interoperability among other services. This means that the standard data structure and interface are basic requirements of the system. The implementations of web service standards recommended by the Open Geospatial Consortium (OGC), for instance, Web Map Service (WMS), Web Feature Service (WFS) and Styled Layer Descriptor (SLD) provide a principle for communication and allow users to visualize spatial information online. The core system working behind as a thematic engine composes of two important modules. The first module is used for spatial data discovery process and another is thematic cartography, where the map classification and rendering are performed at this stage. Figure 3 explains the flow diagram how thematic map creation processes work in procedural steps. The two core functions were developed mainly using open-source GIS libraries and software. The detailed procedures of the core functions are described in this section.
Spatial Data Discovery Process Flow: The Spatial Data Discovery (SDD) Process is an automated system, which allows the input data prepared in a simple form. For instance, a simple copy and paste from a website or import a comma separated values (csv) file. The data should contain at least one column that represents geographic location or place name and the structure provides a cell separator with equal column in each row. The SDD process searches for the matching place name in the Map-Register database and automate assigns the geographic features of the dataset. In this context, ontologies are expected to play a central role to empower data discovery with semantics.
Thematic Cartography Process Flow: The Thematic Cartography (TC) Process performs thematic classification based on the statistical distribution of the input datasets. The prototype system supports 4 classification schemes as discussed in section 2. Each of data classes is styled based on the Styled Layer Descriptor (SLD) and Symbology in support with an Open Source Mapserver engine. When Mapserver gets a valid SLD through a request, it parses this SLD to extract all the styles attached to the NamedLayers, and then applies these
styles to the map before returning the result choropleth map to the client web browser. Map legend is also created by a support of Mapserver after class break or data range has been defined from the previous step. The successive layer will be parsed to render on top of the mapping system.
4. IMPLEMENTATION AND DISCUSSION
We implemented the thematic mapping described in session 3 as a web service portal. The web mapping system is developed through Free and Open Source Software for Geospatial (FOSS4G). The application framework is built based on OpenLayers and ExtJS. OpenLayers provides the mapping core for the application while ExtJS gives excellent design of graphical user interface (GUI). The webserver is configured with Apache and PHP where spatial data is maintained in PostGIS, the spatial extensions for PostgreSQL database. Core thematic engine and classification schemes are implemented using PHP associated with Mapserver and PostGIS to create automate processes of thematic cartography. In this prototype, the concept of Spatial Data Discovery is demonstrated by developing a PHP class and Map-Register database. The geographical identifier ontologies are expected to integrate with the system in the future development. Figure 4 illustrates the system architecture of the thematic mapping service prototype.
Figure 4. System architecture of Thematic Mapping Service
We demonstrated the use case of thematic mapping service with our previous research output (Horanont et al, 2010). The dataset is the estimated dynamic population in 1 kilometer grid with an hour interval (Table 2).
Table 2. Generic text data parsed from the mobile sensing platform. The first column is the Japanese standard mesh code
and the first row is time in hourly basis.
ISPRS Annals of the Photogrammetry, Remote Sensing and Spatial Information Sciences, Volume I-4, 2012 XXII ISPRS Congress, 25 August – 01 September 2012, Melbourne, Australia
The population has been dynamically calculated from the location of active mobile phone devices in the area. The results provide the estimated population distribution in modular grid tile system within an hour interval. In general, tabulation data is difficult to interpret especially large dataset that explain complex geographic phenomena. Table 2 displays part of the output population data from our previous project. This data describes dynamic population distribution of a normal business day in the central Tokyo area. The code attribute column is recognized as a place identifier and will be automatically assigned with unique geographical feature, in this case, a modular grid cell. Please note that code name in this study is basically a standard mesh ID of Japanese mesh system and that of available in the Map-Register database. Figure 5 illustrates sample outputs of the prototype system to show the difference visualization of each thematic scheme. The outputs confirm that the prototype developed has successfully executed. However, this on-going research requires further improvement of the thematic engine in several points especially in the data discovery process. We need it to process and provide the services in more semantic manner.
(a) The equal-Interval
Figure 5. A sample visualization of choropleth maps created by different classification schemes to display the population density in central Tokyo at 10 am. on the weekday.
5. CONCLUSIONS
Given the technical possibilities, the use case and the program prototype, thematic mapping and online spatial analysis services are at the beginning of a potentially explosive development cycle. Our goal with the research described in this study goes beyond the visualization issues of thematic maps. We aim to automate the thematic map generation so that novice users and people who do not own digital maps are able to visualize their information as thematic maps over the Web. The service allows novice users with no GIS software experience to generate online thematic maps from a plain text input containing a location identifier field. Finally, in order to provide thematic mapping with more semantic manner, retrieving accurate geographical features in the registry is a very important task. Our future work is to implement geographical identifier ontologies to enhance the robustness and accuracy of the data discovery process.
6. REFERENCES
Andrienko, G., Andrienko, N., Savinov, A., 2001b. Choroplethmaps —classification revisited. Proc. ICA 2001, Beijing, China.Chinese Society of Geodesy, Beijing, China, vol. 2, pp. 1109 –111
Cammack, R.G., 2005. Web Mapping Services: A Tool for Thematic Internet Maps, Proceeding in: XXII International Cartographic Conference (ICC2005), A Coruna, Spain. Dietze, L., Zipf, A., 2007. Extending OGC Styled Layer Descriptor (SLD) for Thematic Cartography - Towards the ubiquitous use of advanced mapping functions through standardized visualization rules. In: The 4th International Symposium on LBS and Telecartography, Hong Kong.
Hong, J., Lin, S., 2005. Web-based Thematic Map Service in OpenGIS Environment, Proceeding in: the 26th Asian Conference on Remote Sensing (ACRS 2005), Hanoi, Vietnam. Horanont, T., Shibasaki, R., 2011. Nowcast of Urban Population Distribution using Mobile Phone Call Detail Records and Person Trip Data. Proceeding in: Computers in Urban Planning and Urban Management 2011 Conference, Calgary, Canada.
Sae-Tang, A. & Ertz, O., 2007. Towards web service dedicated to thematic mapping. OSGeo Journal, Vol. 3, pp. 31-34. Sandvik, B., 2008. Thematic Mapping Engine. MSc Thesis in Geographical Information Science, Institute of Geography, School of GeoSciences, University of Edinburgh.
Volz, R., Kleb, J., Mueller, W., 2007. Towards ontology based disambiguation of geographical identifiers. In WWW2007, Banff, Canada.
Voss, H., Andrienko, N., Andrienko, G., Gatalsky, P., 2000. Web-based Spatio-Temporal Presentation and Analysis of Thematic Maps. The Journal of Cities and Regions, Journal of SCORUS, the Standing Committee on Regional and Urban Statistics and Research, November 2000, pp.51-61
Zeng, X., Zhao, F., 2011. Ontology Driven Automatic Web Thematic Mapping Based on Web Service Chain, Proceeding in: the 19th International Conference on Geoinformatics, Shanghai, China.
ISPRS Annals of the Photogrammetry, Remote Sensing and Spatial Information Sciences, Volume I-4, 2012 XXII ISPRS Congress, 25 August – 01 September 2012, Melbourne, Australia