International Journal of Modern Management Sciences
Institute of Petroleum Engineering, Heriot-Watt University, (HWU) Edinburgh, UK
2
University of Mines and Technology, Faculty of Engineering, Tarkwa
3
University of Mines and Technology, Academic and Students Affairs Office, Tarkwa
* To whom correspondence should be addressed; E-Mail:[email protected]
Article history: Received 18 March 2013, Received in revised form 19 April 2013, Accepted 23 April 2013, Published 25 April 2013.
Abstract: The purpose of this paper is to use mathematical models to predict the population growth of Ghana. Ghana is a small country located in West Africa. It borders Burkina Faso, Ivory Cote and Togo and the Gulf of Guinea. The Exponential and the Logistic growth models were applied to model the population growth of Ghana using data from 1960 to 2011. The Exponential model predicted a growth rate of 3.15% per annum and also predicted the population to be114.8207 in 2050. We determined the carrying capacity and the vital coefficients and are and , respectively. Thus the population growth of Ghana according to the logistic model is and
predicted Ghana’s population to be 341.2443 in 2050. The MAPE of was computed as 16.31% for the Exponential model and 95.21 for the Logistic model.
Keywords: Exponential growth model, Logistic growth Model, Population growth, MAPE, Carrying Capacity, Vital Coefficient.
1. Introduction
Projection of any country’s population plays a significant role in the planning as well as in the decision making for the socio-economic and demographic development. Today the major issue of the
world is the tremendous growth of the population especially in the developing countries like Ghana.
A mathematical model is a set of formulas or equations based on quantitative description or
real world phenomenon and created in the hope that the behavior it predicts will resemble the real
(1) The formulation of a real-world problem in mathematical terms: thus the construction of
mathematical model.
(2) The analysis or solution of the resulting mathematical problem.
(3) The interpretation of the mathematical results in the context of the original situation.
A model can be in many shapes, sizes and styles. It is important to emphasize that a model is
not real-world but merely a human construct to help us better understand real-world system. One
uses models in all aspect of our life, in order to extract the important trend from complex processes
to permit comparison among systems to facilitate analysis of causes of processes acting on the
system and to make a prediction about the future. In this paper we model the population growth of
Ghana using the Exponential and the Logistic growth models.
2. Materials and Methods
A research is best understood as a process of arriving at dependent solutions to the problems
through the systematic collection, analysis and interpretation of data. In this paper, secondary
population data was taken from World Development Indicator and Global Development Finance –
Google Public Data Explorer (www.google.com.gh/publicdata/explore). The Exponential and Logistic
growth mathematical models were used to compute the projected population values employing Maple.
The Goodness of fit of the models is assessed using the Mean Absolute Percentage Error (MAPE).
3. The Exponential Growth Model
In 1798 Thomas R. Malthus proposed a mathematical model of population growth. He
proposed by the assumption that the population grows at a rate proportional to the size of the
population. This is a reasonable assumption for a population of a bacteria or animal under ideal
conditions (unlimited environment, adequate nutrition, absence of predators, and immunity from
disease). Suppose we know the population P0 at some given time , and we are interested in
projecting the population P, at some future time , In other words we want to find a population function satisfying .
Then considering the initial value problem
(1)
Integrating by variable separable in (1)
∫ ∫
or
increases as the population increases. Equation (1) is appropriate for modeling population growth
under ideal conditions, thus we have to recognize that a more realistic must reflect the fact a given
environment has a limited resources.
4. The Logistic Growth Model
This model was proposed by the Belgianmathematical biologist Verhulst in the 1840s as model
for world population growth. His model incorporated the idea of carrying capacity. Thus the
population growth not only on how to depends on the population size but also on how far this size is
from the its upper limit i.e. (maximum supportable population. He modified Malthus’s Model to make
a population size proportional to both the previous population and a new term
(3)
where and are the vital coefficients of the population. This term depicts how far the population is
from its maximum limit. Now as the population value gets closer to , this new term will become very
small and tend to zero, providing the right feedback to limit the population growth. Thus the second
term models the competition for available resources, which tends to limit the population growth. So the
modified equation using this new term is:
By the application of separation of variables and integrating, we obtain ∫
At and
Substituting c into (6) and solving for P yields
Therefore the limiting value of is giving by
(14)
5. Mean Absolute Percentage Error (MAPE)
It is an evaluation statistic which is used to assess the goodness of fit of different models in
national and sub national population projections. This statistic is expressed in percentage. The concept
of mean absolute percentage error (MAPE) seems to be the very simple but of great importance in the
selecting a parsimonious model than the other statistics. A model with smaller MAPE is preferred to
The mathematical form of MAPE is given under
∑ ̌ (15)
where ̌ and are the actual, fitted and number of observation of the (dependent variable) population respectively.
Lower MAPE values are better because they indicate that smaller percentages errors are
produced by the forecasting model. The following interpretation of MAPE values was suggested by
Lewis (1982) as follows: Less than 10% is highly accurate forecasting, 10% to 20% is good
forecasting, 21% to 50%is reasonable forecasting and 51% and above is inaccurate forecasting.
6. Results and Discussion
To estimate the future population of Ghana, we need to determine growth rate of Ghana using
the Exponential Growth model in (2). Using the actual population of Ghana in million on table 1 below
with t 0corresponding to the year 1960, we have . We can solve for the growth rate , the fact that when
( )
Hence the general solution
(16)
This suggests that the predicted rate of Ghana population growth is with the Exponential growth model. With this we projected the population of Ghana to 2050.
Again, based on table 1, let correspond to the years 1960, 1961 and 1962 respectively. Then also correspond 6.7421, 8.559313 and 10.784734.
Substituting the values of and into (14) we get This is the
predicted carrying capacity of the population of Ghana.
From equation (12), we obtain hence
.
Therefore the value of . This also implies that the predicted rate of Ghana population growth is approximately with the Logistic growth model.
From and equation (15), we obtained
(17)
As the general solution and we use this to predict population of Ghana to 2050. The predicted
populations of Ghana with both models are presented on the table 1 below.
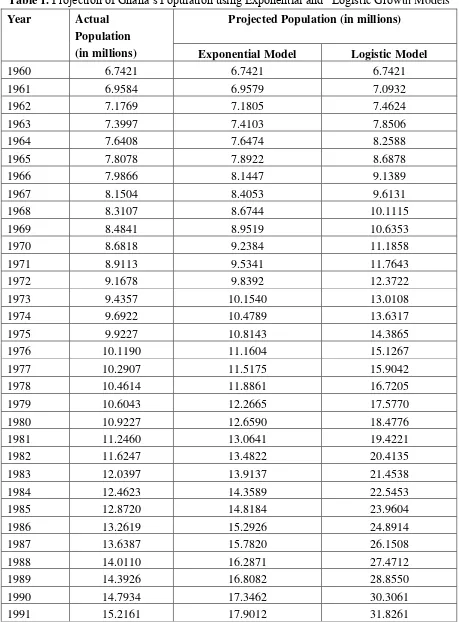
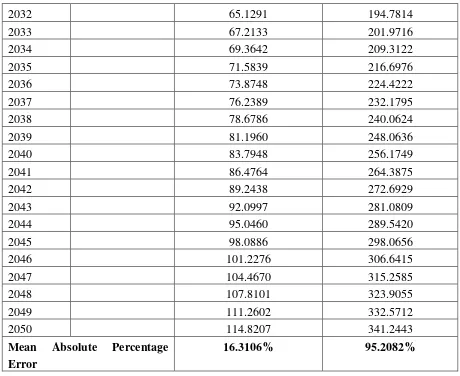
Table 1. Projection of Ghana’s Population using Exponential and Logistic Growth Models
2032 65.1291 194.7814
2033 67.2133 201.9716
2034 69.3642 209.3122
2035 71.5839 216.6976
2036 73.8748 224.4222
2037 76.2389 232.1795
2038 78.6786 240.0624
2039 81.1960 248.0636
2040 83.7948 256.1749
2041 86.4764 264.3875
2042 89.2438 272.6929
2043 92.0997 281.0809
2044 95.0460 289.5420
2045 98.0886 298.0656
2046 101.2276 306.6415
2047 104.4670 315.2585
2048 107.8101 323.9055
2049 111.2602 332.5712
2050 114.8207 341.2443
Mean Absolute Percentage Error
16.3106% 95.2082%
Fig 1 depicts that from 1960 the population of Ghana has increased throughout. This may be
attributed to the improvement in the education, agricultural productively, water and sanitation and
health services. There was a belief in Ghana that the more children one had, one would have a higher
social and economic status, have higher work force in their farms and receive better care in old age.
This coupled with other factors had an overall effect on the increase in population. The exponential
model predicted Ghana’s population to be 114.8207 in 2050 whereas the Logistic model projected it to
be 341.2443. This is presented on figure 2. From equation (14) we calculated the Mean Absolute
Percentage Error (MAPE) of both models. The MAPE for Exponential and the Logistic model are
Fig. 1: Graph of actual population from 1960 to 2011
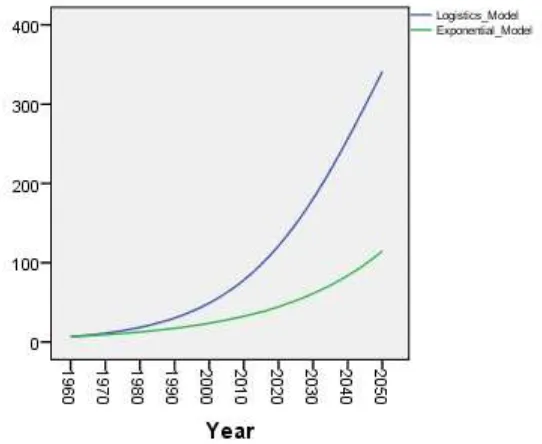
Fig. 2: Graph of predicted population values
Figure 2 above shows the graph of the predicted population of Ghana with both models. The
Logistic Model is in blue and it deviate far from the actual population. The green line represents the
forecast of the exponential model which is quiet similar to the actual population graph.
7. Conclusion
In conclusion the Exponential Model predicted a growth rate of approximately 3% and
predicted Ghana’s population to be 114.8207 million in the year 2050 with a MAPE of 16.3106%. The Logistic Model on the other hand predicted a carrying capacity for the population of Ghana to be
the vital coefficients and are and respectively. Thus the population growth rate of Ghana according to this model is approximately 5% per annum. It also
predicted the population of Ghana to be 341.2443 million in 2050 with a MAPE of 95.2082%.Based
on Lewis (1982) we can conclude that the Exponential Model gave a good forecasting result as
compared to the Logistic model.
Appendix
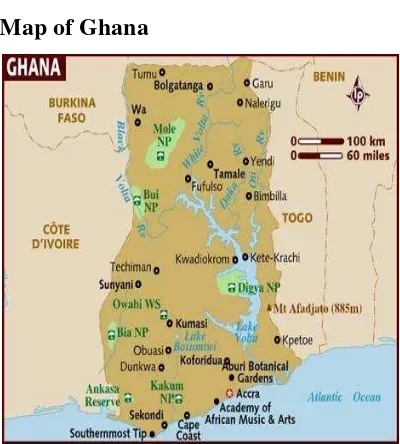
Map of Ghana
Fig. 3: Map of Ghana
References
Glen Ledder, (2005), Differential Equations: A modeling Approach. McGraw-Hill Companies Inc.
USA.
Lewis, C.D (1982). International and business forecasting method; A practical guide to exponential smoothing and curve fitting. Butterworth Scientific, London.
Malthus T.R, (1987). An Essay on the Principle of Population (1st edition, plus excepts 1893 2nd
edition), Introduction by Philip Appeman, and assorted commentary on Malthus edited by
Appleman, Norton Critical Edition, ISBN 0-393-09202-X.
Verhulst P. F., (1838). Noticesur la loique la population poursuitdans son Accroissement,
Correspondance, athematiqueet physique, 10.
World Development Indicators and Global Development Finance (WDIGDF): Google Public Data