Management and Economics Journal
E-ISSN: 2598-9537 P-ISSN: 2599-3402 Journal Home Page: http://ejournal.uin-malang.ac.id/index.php/mec
Volume 2 Number 1, April 2018
THE EFFECT OF INTELLECTUAL CAPITAL ON CORPORATE VALUE
Yayuk Sri Rahayu
Economic development has many methods in development of financial institutions banking. Liquidity management can affect the institution. The crisis in financial sector is caused by low capability of financial institutions to deal fund sources. It affects the development of securities market and real sector. This study aims to analyze the effect of Intellectual Capital on Banking Value in Indonesia. The effect of Intellectual Capital is derived revenue (financial performance) on Banking Value, indirect effect of Intellectual Capital to Company's value of financial performance. This research is a descriptive explanatory research to test the hypotheses. The population is all Indonesia Banking. This research uses 30 banks with 5 years period (series) from year 2011 until 2015. The samples are 5 years x 30 = 150 item data and analyzed by path analysis. The research results indicate that companies should aware to important role of intellectual capital management. Company must manage intellectual capital within company, because it can affect on firm value. Intellectual capital has a significantly and positive effect on financial performance. In addition, there is an indirect effect of Intellectual Capital on firm value through financial performance. Optimal intellectual capital will create value added to company to provide a separate characteristic. The company will be able to compete with its competitors, because it has a unique competitive advantage.
KEYWORDS: intellectual capital, financial performance, corporate value.
| Received January 2018 | Accepted March 2018 | Available online April 2018 | | DOI: http://dx.doi.org
INTRODUCTION
The Effect of Intellectual Capital…
adequately addressed by accountant (Suhendah, 2012). Opinion about the importance of intellectual capital is supported by Petty (2000) that company more focused on importance of knowledge assets. One approaches used in assessment and measurement of knowledge assets is intellectual capital as the focus of attention in various fields, management, information technology, and sociology. This poses a challenge for parties to identify measure and disclose it in financial statements. Intellectual Capital plays an important role to improve corporate value and financial performance. Companies that are able to utilize their intellectual capital efficiently can increase the market value (Sunarsih and Ni Putu, 2012). Appuhami (2007) states that greater the value of intellectual capital makes the more efficient company capital usage, thus creating value added for company.
LITERATURE REVIEW AND HYPOTESHIS
The company's financial statements play an important role in capital market, both for individual investors and market as a whole. It is supported by Petty and Guthrie (2000) that company is currently more emphasize on the importance of knowledge assets. One approach used to asses and measure the knowledge assets are the intellectual capital that has become the focus attention in various fields, management, information technology, sociology and accounting. This poses challenges for accountants to identify measure and disclose it in financial statements (Sunarsi and Ni Putu, 2012). Intellectual Capital is believed to play an important role to increase the firm value.
This study measures the effect of intellectual capital on firm value by taking into account the company's financial performance factor. The company's financial position is affected by controlled resources, liquidity, leverage, profitability, and adaptability to environmental changes. Company performance information, particularly profitability, is needed to assess potential changes in economic resources that may be controlled in future to predict the company's capacity to utilize additional resources. The expenditure and procurement of a company's fund is closely related to company's financial condition. It is reflects the liquidity, solvency, activity and profitability of company. Financial performance is a reflection of many transactions.
Hypothesis
H1: More Intellectual Capital can increases Company's Value H2: Better financial performance can increases the firm value
H3: Intellectual Capital has indirect effect on Company's Values with financial performance as intermediation
H4: Intellectual Capital has indirect effect on Values of Enterprises with intermediation of financial performance
METHOD
Research Design
Rahayu and Widiati
variable and skill and employees capabilities. Financial performance is measured through the dimensions of Revenue Growth. Firm Value variable is measured by the Economic Value Added dimension. This integrated parent model is the main target that will be generated in research.
The research location is Indonesia Banking. The reason to choose the location is the development of Indonesia Banking is significant based on comparison of capital and profitability among demands of considerable efficiency
Population and Sample
Population is the whole object of research from both real objects, abstract, events or symptoms that as the data source and have a certain character and same (Sukandarrumidi, 2006: 47). The study population is all Indonesia Banking.
Data collection uses two methods independently. The secondary data were analyzed using each method. Further analysis is done with meta-analysis to group, differentiate and sought the relationship of one data to others. It can show the data are mutually reinforcing, weakening or contradictory.
The data is collected in a time series. Data is arranged chronologically in according to time on a particular variable and cross section, ie data collected at a point in time, called a data poll with a combined model. This research use 30 bank for 5 years (series) that is year 2011 until 2015. Total samples are 5 years x 30 = 150 item data. The data is collected from published financial report. This is secondary data available and collected by other party, namely from Bank Indonesia monthly report for 2011 to 2015 period.
Data Analysis
Sugiono (2010: 335) explains that data analysis techniques is the process to find and organizing systematically data from interviews, field notes and documentation by organizing the data into categories, describe into units, synthesize, organize into patterns , choose what important and what will be learned and making conclusions to facilitate understanding researchers and others. The analysis stages are as below. Descriptive analysis explains the data descriptions such calculation of mean and variance of variables. It is described tables to facilitate easier reading and understanding.
The Effect of Intellectual Capital…
RESULTS AND DISCUSSION
Classic assumption test
Classic assumption tests as the condition to do path analysis. The data must meet linearity and residual normality assumptions.
Linearity Test
Linearity test aims to test the linearity of relationship between independent variables and dependent variables. A good path model has linear relationship between the two variables. The method used to test the linearity is curve estimation test. The relationship between the two variables is linear when the significance value of test is smaller than the alpha. Test results are presented in table 1 below.
Table 1. Linearity Test Result with Curve Fit
Variables Significance Description
IC GR 0.002 Linear
IC EVA 0.004 Linear
GR EVA 0.003 Linear
Table 1 show that the significance value for IC GR is 0.002, IC EVA is 0.004,
GR EVA is 0.003. The value is less than α 5%. It indicates a linear relationship
between variables.
Path Analysis
Path analysis is used to test the hypothesis. This analysis is used to determine the level of effect on a relationship.
Theoretical Model Development
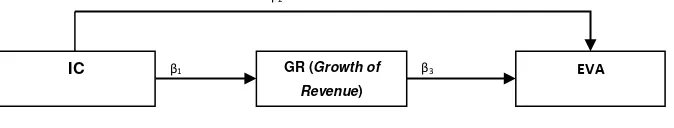
The step to develop theoretical model is done by exploring scientifically variables and relationship between variables through literature review in order to get justification for developed theoretical model. The relationship between variables for the model is shown in figure 1 below.
Figure 1. Path Diagram of Model
Figure 1 above may also be expressed by equation below:
GR = β1IC + εi (Substructure 1)
EVA = β2IC + β3GR + εi (Substructure 2)
Path Coefficient Calculation
The path coefficient calculation uses standardize regression analysis by looking at simultaneously and partially effect of each equation. It uses ordinary least square (OLS) method and calculated by software SPSS version 21.0:
β3
β1
IC GR (Growth of
Revenue)
EVA
Rahayu and Widiati
Hypothesis testing The effect of IC on GR
Standardize regression test results are shown in Table 2 below.
Table 2. Regression Analysis Result of IC to GR
Variables Beta t Sig t Description
IC -0.089 -1.991 0.002 Significant
t(0.05,148) = 1.976
R Square = 0.008
The explanations of Table 2 are below.
a. R Square value is 0.008 or 0.8%. This means that IC (Intellectual Capital) variable affects on GR (Growth of Revenue) variables at 0.8%, while the rest of 99.2% is affected other variables outside the studied variables.
b. Regression equation standardize
EVA = -0.145 IC + 0.075 GR + εi
c. The tcount value indicates that:
The IC variable (Intellectual Capital) has a tcount of -1.091 with
significance of 0.002. Tcount is larger than ttable (1.991> 1.976) or sig t
is smaller than α (0.002 <0.050). It means IC variable (Intellectual
Capital) has significant effect on GR (Growth of Revenue) variable.
The GR (Growth of Revenue) has tcount of 1.922 with significane of
0.003. Tcount is larger than ttable (1.982 > 1.976) ort sig t larger than α
(0.003> 0.050). It means GR (Growth of Revenue) variable has
significant effect on EVA (Value Firm).
The effect of IC and GR on EVA
Standardize regression test results are shown in table 3 below.
Table 3. Regression Analysis Result of IC and GR to EVA
Variables Beta t Sig t Description
IC -0.145 -1.996 0.007 significant
GR 0.075 1.982 0.003 significant
t(0.05,120) = 1.976
R Square = 0.476
a. R Square has value of 0.476 or 47.6%. This means that IC (Intellectual Capital), and GR (Growth of Revenue) variables affect on EVA (Value Firm) at 47.6%, while the rest 52.4% is affected by other variables outside the studied variables.
b. Regression equation standardize
EVA = -0.145 IC + 0.075 GR + εi
c. The tcount value can be explained below.
The IC variable (Intellectual Capital) has a t-test value of -1.996 with a
The Effect of Intellectual Capital…
is smaller than α (0.007 <0.050). It means IC variable (Intellectual
Capital) significantly affects on EVA variable (Value Firm).
The GR (Growth of Revenue) variable has a t-test value of value of
1,922 with a significance of 0.003. Tcount is larger than ttable (1.982>
1.976) or sig t greater than α (0.003> 0.050). It means GR (Growth of
Revenue) variable significantly effects on EVA (Value Firm) variable. Path Interpretation
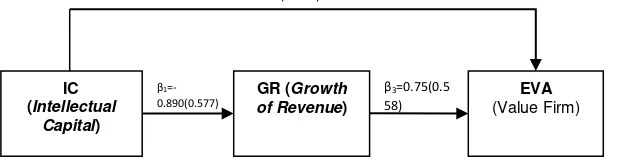
Above two equations can be used to develop path analysis in figure 2 below.
Figure 2. Path diagram of Theoretical Research Model
Goodness of Fit model is tested by the coefficient of total determination. The total data variance that can be explained by model is measured by formula:
R2m = 1 – P2e1 P2e2….P2ep The coefficient of total determination is follows:
R2m = 1 – (0.992 × 0.524) = 0.48 or 48%
R2m calculation results indicate the variance of data that can be explained by model is 0.48 or in other words, the information in data can be explained 48% by model. The remaining 52% of variance is explained by other variables outside the model.
The models in this study are divided into 3 direct effects and 1 indirect effect. The tables 4 and 5 below presents the test results for direct and indirect effects.
Table 4. Hypothesis Testing of Direct Effect
Independent Variables
Dependent
Variables Path p-value Description
Rahayu and Widiati
Table 5. Hypothesis Testing of Indirect Effect
Independent Variable
Intervening Variable
Dependent
Variable Path Description
IC GR EVA 1 0.007 Significant
Indirect Effect Hypothesis
The indirect effect of IC (Intellectual Capital) variable to EVA variable (Value Firm) through GR (Growth of Revenue) variable is obtained from direct effect of IC variable to GR variable and direct effect between GR variable to EVA variable. The indirect effect is 0.089 × 0.075 = 0.007. Because the direct effect of IC variable on GR variable and direct effect of GR variable on EVA variable are all significant, the effect of IC (Intellectual Capital) on EVA (Value Firm) variable through GR (Growth of Revenue) variable is also significant. Therefore, it can be concluded that GR variable can become the mediating variable for the effect of IC to EVA.
The test result shows that Intellectual Capital has a significant and positive effect on Growth of Revenue. High Intellectual Capital will increase Growth of Revenue of company. Terrziovski (2004) explains that Intellectual Capital has been done maximally to support the financial performance of company. It also shows that higher the Intellectual Capital will increase the company's growth. Companies capability to manage every resource maximally will get value added. It makes the company can grow and survive in business activities. Tan. Et.al (2007) shows that higher the value of Intellectual Capital will increase company growth. Solikah et al (2010) also gave similar results for Indonesia companies. This means that company that became the research object has success to maximize the competence, knowledge, motivation, commitment and loyalty of the employees to create value for company. The added value is used to develop the asset company development and the company continues to improve.
CONCLUSION
This study aims to determine the effect of intellectual capital on financial performance as measured by growth revenue to firm value. This research was conducted on 30 Indonesia Banking companies listed in IDX from 2011-2015. This study show following results. First, Intellectual capital must be managed by company, it can affect the firm value. The effect of Intellectual Capital and financial performance on firm value can improve financial performance; Intellectual Capital indirectly affects the firm value through financial performance.
The suggestion for next researcher is the research on intellectual capital disclosure should use various other variables such as earnings per share, annual stock return and other variables. It is suggested that further research uses survey methods to confirm the present findings and can increase the proxy amount of financial performance measurement such as banking financial performance ratio (CAMEL).
REFERENCES
Appuhami, R, 2007. The Impact Of Intellectual Capital On Investors Capital Gains In Shares : An Empirical Investigation Of Thai Banking, Finance & Insurance
The Effect of Intellectual Capital…
Bontis, Keow, dan Richadson. 2000. Intellectual Capital and Bussiess Performance
in Malaysian Industries, Journal of Intellectual Capital, Vol 1, No 1, Hal
85-100
Branco, Manuel Castilo, 2006. Communication of Corporate Social Responsibility by
Portuguese Banks, Corporate Communications. An International Journal
Vol.11 No 3, 2006, pp.232-248, Emerald Group Publishing Limited 1356-3289
Ghozali, Imam. 2008. Structural Equation Modeling Metode Alternatif Dengan Partial
Least Square (PLS), Penerbit: Badan Penerbit Undip, Semarang.
Ni Made Sunarsih dan Ni Putu Yuria Mendra, 2008. Pengaruh Modal Intelektual Terhadap Nilai Perusahaan Dengan Kinerja Keuangan Sebagai Variabel Intervening Pada Perusahaan Yang Terdaftar Di Bursa Efek Indoesia,
Jurnal Fakultas Ekonomi Universitas Mahasaraswati Denpasar
Petty,P and J Guthrie, 2000. Intellectual Capital literature review : measurement,
reporting and management, Journal of Intellectual Capital, Vol 1 No 2
Pp.155-75
Pulic, A, 1998. Measuring the Performance of Intellectual Potential in Knowledge
Economy, available at :www.vaic-on,net
Pulic, 2000. VAIC-An Accounting Tool for IC Management, International Journal of
Technology Management, 20 (5)
Sawarjuwono, Tjiptohadi. 2003. Intellectual Capital: Perlakuan, Pengukuran Dan
Pelaporan (Sebuah Library Research). Jurnal Akuntansi & Keuangan Vol. 5,
No. 1, Mei 2003: 35–57.
Sugiono, 2010. Metode Penelitian Kuantitatif & RND, Bandung : Alfabeta
Suhendah Rousilita, 2012. Pengaruh Intelectual Capital Terhadap Profitabilitas, Produktivitas, dan Penilaian Pasar pada Perusahaan yang Go Public di
Indonesia pada Tahun 2005-2007, Jurnal Simposium Nasional Akuntansi
XV, September 2012
Sukandarrumidi, 2006. Batubara dan Pemanfaatannya, Gajah Mada Unniversity Press, Yogyakarta
Terziovski, Mile, Gloet, Marianne, 2004. Exploring the Relationship Beetween
Kowledge Management Practices and innovation Performance, Journal of