ANALYSIS OF HIGH PERFORMANCE COMPUTING IN
COMPUTER RESOURCE SHARING FOR PARALLEL
PROCESSING USING OPENMPI
Sujoko Sumaryono1), Freddy Kurnia Wijaya2), Teguh Bharata Adji3) Electrical Engineering & Information Technology Department
Engineering Faculty, Gadjah Mada University Yogyakarta, Indonesia
E-mail : [email protected]), [email protected])
Abstract
High performance computing can be associated with a method to improve the performance of an application that has a large computational process. This includes the distribution of computer resources such as processing load, CPU usage and memory usage into multiple units that enable simultaneous distributed processing to improve speed in problem solving.
Cluster system for parallel programming using message passing algorithm interface (MPI) with the implementation of openMPI to test and analyze the ability to distribute the computing process to several computer resources i.e. the processor load, CPU usage, and memory usage as well as the association with network resources i.e. traffic, throughput, and packet. The method used is descriptive analysis by observing responses of the system designed.
Performance analysis was conducted by running parallel programs of which processes were executed at some computer nodes. The relationship between computer resources and network resource is monitored by using ganglia application and the network resource is monitored by using ntop. This research shows that the network and computer resources result in a better computation time compared to sequential computation time.
Keywords: parallel computing, cluster systems, message-passing interface (MPI), OpenMPI, matrix multiplication, ganglia, ntop.
I. INTRODUCTION
Technological developments have brought the whole of human activity into a computerized reference. The most fundamental thing that can be known in general on the field of computer science is the speed of processing. Parallel computing technology has driven the development of parallel computer system including cluster. Cluster system can run computing jobs simultaneously.
The design and implementation of cluster system in this study is to use software tools i.e. openMPI. OpenMPI is designed to be portable to a large number of different platforms, ranging from small cluster to supercomputers [1]. Computer resource allocation process will be seen when a parallel program run with a large process load, which will be distributed among CPU performance, memory usage and network resources.
The condition of computer resources can be viewed using the ganglia application, whilst for monitoring networks then ntop application can be used. These applications can be used to display resource condition of both computer and
network resources at each node. Resources can be distributed to each node by using message passing mechanism in parallel computing. Indications of resource distribution will be seen from the amount of ups and downs of the resource capacity of each component. This distribution will be studied to understand the utilization of computer and network resources.
2. BASIC THEORY
2.1 Message Passing Interface (MPI)
Multicomputer message passing
programming can be achieved by way of [2]: a. Designing a parallel programming language
in particular.
b. The syntax development and served words at a high level sequential programming language that already exists to handle message passing.
c. Using high level sequential programming languages that already exist and provide a library of external procedures for message.
parallel fortran compiler. However, it does not easily applied to message passing because the traditional sequential programming language it self has the concept of message passing. MPI has a synchronous routine that is used for some of the routine that will be returned when the message delivery is completed.Synchronous send routine will wait until the entire message sent is received by the receiver before finally returning.
Simultaneous receiving routine will wait until the message is expected to come and be saved before finally returning. A pair of the process, a process with simultaneous admission process will be harmonized. This was done even though the source and destination process can not be processed until the message has been sent (from the source to the destination) [2].
Figure 1. The call library send () and recv () are synchronized using a three-way protocol[ [2].
Therefore, the source will send a real message. Message passing is synchronous using three-way protocol is shown in Figure 1. In Figure 1(a), the process 2 reached the send () before the process 2 reach the recv() as appropriate. The process should be delayed a few moments process 2 to reaches recv(). At that time, process 2 will generate a process of using a “signal”. After that
both processes can make the transfer. In Figure 1(a), the message is successfully delivered. In Figure 1(b), the two reached send() before the process reaches a send(). Now, the two should be deferred until both processes participate in the transfer process. More appropriate mechanism to suspend and excite the process depends on the system.
2.1 OpenMPI
Open MPI is an open source complete implementation of the MPI 1.2 and MPI-2 standards. Its primary goal is to create a high-efficient, production-quality MPI library for high-performance computing [3].Open MPI relies on new design architecture to implement MPI - it uses the Modular Component Architecture (MCA). MCA defines internal APIs called frameworks that are particular services
such as process launch. Each framework contains one or more components which are specific implementations for a framework. Components can be dynamically selected at runtime. Open MPI provides point-to-point message transfer facilities via multiple MCA frameworks. Open MPI works on three abstraction layers. The Open MPI (OMPI) layer provides standard MPI functions to the user. [3]
OpenMPI also offers advantages for system and software vendors, application developers and researchers in the field of computer science.
2.3 Ganglia
Ganglia is a distributed monitoring system based on open source for the High Performance Computing (HPC). Cluster and grid systems can use the round robin database tool (RRDtool) to store and visualize information to resource cluster / grid so it can be used by administrators to monitor the system [4].
Ganglia monitoring daemon runs as the ganglia monitoring daemon (Gmond) at each node in the cluster network. Gmond residing in each node will transmit statictical data to the master node computer resources via the UDP protocol. Statistical data received by the master node will then be processed and store by a ganglia metric daemon (Gmetad) and will be displayed in a web based on the master node.
2.4 Network Top (Ntop)
Ntop [ntop] is a simple, free and portable traffic measurement and monitoring tool, initially conceived by Luca Deri and Stefano Suin for tackling performance problems on the campus network of the University of Pisa, Italy. [5]Ntop is a simple, open source (GPL), portable traffic measurement and monitoring tool, which supports various management activities, including network optimization and planning, and detection of network security violations. Traffic Measurement [6]:
a. Data sent/received: Volume and packets, according to network/IP protocol.
b. Multicast Traffic. c. TCP Session History.
d. Bandwidth Measurement and Analysis. e. VLAN/AS traffic statistics.
f. VoIP (SIP, Cisco SCCP) Monitoring.
3. SYSTEM DESIGN
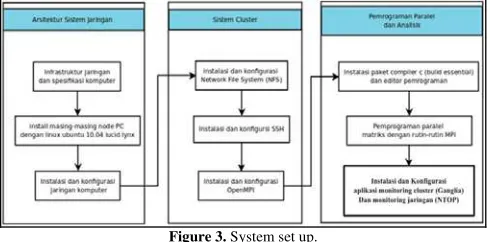
The system design of the cluster system must have the files and packages that must be considered to be installed and configured so that good communication between computers from one to another can occur (see Figure 3). The files and packages includes:
a. Linux operating system Ubuntu LTS 10.04 Lucid Lynx.
b. Installation and configuration of NFS (Network File System) as one service that can allow a computer to perform the process of sharing / mounting a directory that was spesified.
c. Installation and configuration of SSH as a network link between computers when the current communication between the master node and slave nodes.
d. Installation and configuration of OpenMPI for executing parallel programming on a network cluster.
e. Installation and configuration of ganglia cluster monitoring and ntop network monitoring.
Figure 3. System set up.
The cluster architecture is seen on Figure 4 which shows one computer called master and 10 others are slave computers /nodes receiving the
Figure 4. Cluster Architecture 4.TESTING AND ANALYSIS
The purpose of designing and implementing the cluster system is to test the parallel programming with the case of the capability of the computing parallel programming in MPI to divide computing tasks.
4.1Testing system resource cluster
using ganglia application
This study used 11 computers that have the same specs and totally have 16.0 GB of total memory and a total of 933.3 GB disks.
4.2 Resource Monitoring for Paralel
Matrix Multiplication
The calculations were run on a cluster system using C programming language and MPI routines. The communication process is performed between the master and slave nodes to receipt a task to be done on each slave node. To add the total process in running a parallel program using MPI execution command is done in a way as in Figure 5.
mpirun –np [jumlahprosesor/jumlahbeban] –host compute1 matrix
then do the addition of a node by adding the command compute2: mpirun –np [jumlahprosesor/jumlahbeban] –host compute1,compute2 matrix
And so on up until the hostname of the slave ten compute10.
Figure 5. MPI program command execution matrix case.
Computer resources in this regard are the processor load, memory usage, and CPU usage. The amount of computer resource capacity that is
used by each slave node will vary as shown in Table.1
Table 1 Processor Load
Node Used Total Process
100 200 300
compute1 3.2 3.9 -
compute1 s/d 2 3.4 15.0 31.0 compute1 s/d 3 2.2 22.0 16.0 compute1 s/d 4 3.2 15.0 9.0 compute1 s/d 5 2.3 7.2 14.0 compute1 s/d 6 0.8 7.0 3.0 compute1 s/d 7 1.2 2.5 2.6 compute1 s/d 8 0.4 0.0 0.3 compute1 s/d 9 1.4 0.9 5.0 compute1 s/d 10 0.0 3.5 2.0
Table 1 shows that the program will be tailored to run in parallel with the total process is given to the slave node, which is the result of the magnitude of the load of the processor that runs by the addition of nodes. Hostname on each slave node is referred as compute1 until compute 10, while the parallel program to be tested with a
total process which has been defined as many as 100, 200, and 300.
Figure 6. Of Processor Load Graph
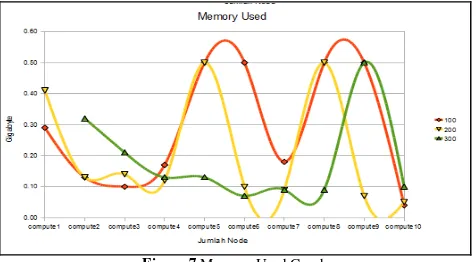
In a cluster system, memory usage is also urgently needed to save the calculated results coming from the slave computation nodes. The process that runs on each node is stored before hand in memory buffered. When memory
capacity increases, the computational processes that are stored there temporarily buffered in memory and cached memory, as shown in table 2.
Table 2 Memory Node Used Total Process
100 200 300
compute1 0.29 0.41 -
compute1 s/d 2 0.13 0.13 0.32 compute1 s/d 3 0.10 0.14 0.21 compute1 s/d 4 0.17 0.12 0.13 compute1 s/d 5 0.50 0.50 0.13 compute1 s/d 6 0.50 0.10 0.07 compute1 s/d 7 0.18 0.09 0.09 compute1 s/d 8 0.50 0.50 0.09 compute1 s/d 9 0.50 0.07 0.50 compute1 s/d 10 0.04 0.05 0.10
Computers resources at each slave node will use the memory when performing the computing process. Memory usage in each slave node will
vary according to the ability of each computer, as shown in Figure 7.
Figure 7 Memory Used Graph
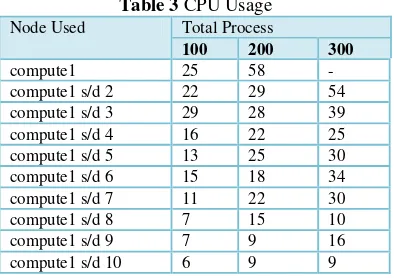
The next computer resource is the CPU usage that works when computing process is executed. Table 3 shows that processing time depend on
Table 3 CPU Usage Node Used Total Process
100 200 300
compute1 25 58 -
compute1 s/d 2 22 29 54 compute1 s/d 3 29 28 39 compute1 s/d 4 16 22 25
compute1 s/d 5 13 25 30
compute1 s/d 6 15 18 34 compute1 s/d 7 11 22 30
compute1 s/d 8 7 15 10
compute1 s/d 9 7 9 16
compute1 s/d 10 6 9 9
It can be seen from Figure 8 that the percentage difference does not look so far between one node to another until it reaches ten nodes.
Figure 8 CPU Usage Graph
4.3 Monitoring Network Resources
with The Increment of The
Number of PCs
The performance of the cluster system is not only measured on any computer resource, but resource on the network must also be considered. Network resource can affect the communication process in a cluster system.
Resource network consisting of throughput and packet traffic can be monitored using ntop as a network monitoring application, Ntop is a real time application that can view the network resource on each connected host. Throughput capacity is very influencing with the number of processor loads and the more CPU usage.
Tabel 4 Throughput
Node Used Total Process
100 200 300
compute1 0.6 1.0 5.4
compute1 s/d 2 0.7 1.2 5.4
compute1 s/d 3 0.6 0.7 2.6 compute1 s/d 4 0.7 0.8 3.3 compute1 s/d 5 0.7 0.5 1.6 compute1 s/d 6 0.4 0.4 1.2
compute1 s/d 7 0.8 0.3 1.1
compute1 s/d 8 0.7 0.4 1.6 compute1 s/d 9 0.4 0.4 1.0 compute1 s/d 10 0.3 0.5 0.8
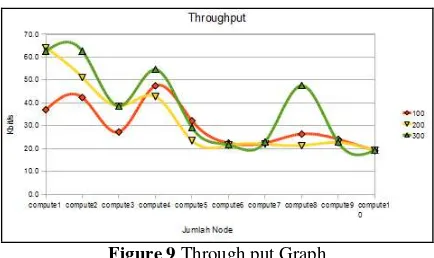
Table 4 shows that when the cluster system runs parallel program with a total process 100, 200, and 300, then the throughput varies. Throughput
Figure 9 Through put Graph
Figure 9 shows that there is a large throughput at compute2, compute4, and compute8. This means that those computers perform better utilization. Network traffic must also be taken into account in network resources. Network traffic is data
traffic that occurs within the cluster network media.
Table 5 Traffic Node Used Total Process
100 200 300
compute1 37.0 64.2 62.7
compute1 s/d 2 42.4 51.2 62.7 compute1 s/d 3 27.3 38.6 38.6 compute1 s/d 4 47.5 42.8 54.6 compute1 s/d 5 32.2 23.5 29.2 compute1 s/d 6 22.5 21.5 21.7 compute1 s/d 7 22.5 22.0 23.0 compute1 s/d 8 26.4 21.4 47.6 compute1 s/d 9 24.1 22.7 22.7 compute1 s/d 10 19.1 19.2 19.2
Table 5 shows that the density of traffic depends on the total process is given when the computing process is executed.
Figure 10 Traffic Graph
As in Figure 10, it is clear that the traffic is up and down, and the high traffic density occurs when the total process is 300 and occurs in compute2, compute4, and compute8. This is due
.
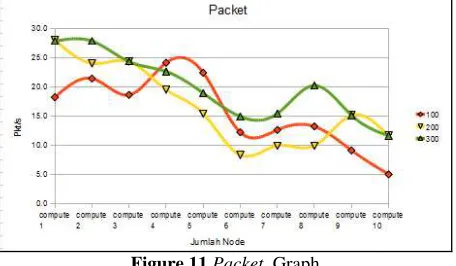
Table 6 Packet Node Used Total Process
100 200 300
compute1 18.2 28.0 27.8
compute1 s/d 2 21.4 24.0 27.8 compute1 s/d 3 18.6 24.3 24.3 compute1 s/d 4 24.1 19.5 22.6 compute1 s/d 5 22.4 15.4 18.9 compute1 s/d 6 12.2 8.3 14.9 compute1 s/d 7 12.6 9.9 15.4 compute1 s/d 8 13.2 9.9 20.2 compute1 s/d 9 9.1 15.1 15.1 compute1 s/d 10 5.0 11.6 11.6
Table 6 shows that most packets per second were high when with the higher total process used. The amount of the package depends on the density of traffic and throughput. As seen in Figure 11, the number of packets on each node
will always vary, so the difference in the number of this package will affect other resource related to computational processes that run parallel programs.
Figure 11 Packet Graph
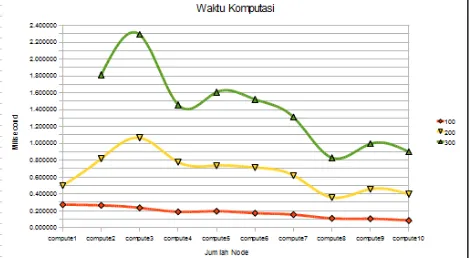
The scenario with the addition of nodes in the computing process will result in computing time as shown in Table 7.
Table 7 Matrix Computations Times Node Used Total Process
100 200 300
compute1 0.273058 0.500085 1.814229 compute1 s/d 2 0.264578 0.818579 1.814229 compute1 s/d 3 0.235191 1.066283 2.290834 compute1 s/d 4 0.187828 0.778543 1.458757 compute1 s/d 5 0.194564 0.737488 1.608058 compute1 s/d 6 0.172111 0.713793 1.522688 compute1 s/d 7 0.154436 0.619769 1.311394 compute1 s/d 8 0.110611 0.359201 0.828630 compute1 s/d 9 0.105787 0.457480 0.994496 compute1 s/d 10 0.084395 0.396363 0.900297
The results occur because of the length of the computing process in each slave node in completing the process of computing. Computational process is assigned to be run by
Figure 12 Matrix Computation Time Graph
Figure 12 shows that the addition of test nodes for computing process proves that the tasks distribution occurs in each computer resource, regardless how good the condition of each resource is.
5.CONCLUSION
a. Testing with the total process of 100, 200 and 300 were done using only one slave node so it will produce high processor load. Meanwhile, if the computation is done by adding nodes up to ten nodes, then the processor load will be shared among other nodes and the computation time will be faster than just using one slave node. b. When the slave node has large throughput
capacity, then the performance of computer
resources would be better. This is because the computing is done on the node that the media coined a good network for data transmission.
c. Capacity that occurs on every computer resource has a relation with the performance of network resources. The greater throughput and traffic then this will affect the performance of computer resources when doing computing.
d. When the slave node has a large traffic load, this causes the network traffic becomes high and this will lead the load to be shared among CPUs and memories in the entire nodes by adjusting the amount of the load and the nodes configuration.
REFERENCES
[1] Aiko Pras, Aiko, NTOP – Network TOP.2000. : University Of Twente: The Netherlands, June 2000
[2] Deri, Luca.2008. Open Source in Network Administration: the ntop Project :ftp://ftp.cs.pu.edu.tw/network/ntop/
OpenSourceConf_Athens2008.pdf
[3] Georgiev, Stefan.2009. Evaluation of Cluster Middleware in a Heterogeneous Computing Environment : Johannes Kepler University, ISI-hagenberg , july 2009
[4] Massie, Matthew L;Chun,Brent N; Culler, David E. 2004. The ganglia distributed monitoring system: design, implementation, and experience, University of California, Berkeley and Intel Research Berkeley. [5] Varshneya, Pooja. 2010.Distributed And
Adaptive Parallel Computing For Computational Finance Applications :
Thesis, Nashville, Tennessee, August 2010.
[6] Wilkinson, Barry; & Allen,
Michael.2005.Parallel Programming
Techniques and Applications Using Networked Workstations and Parallel Computer, New Jersey : Prentice Hall, Inc
![Figure 1. The call library send () and recv () are synchronized using a three-way protocol[ [2]](https://thumb-ap.123doks.com/thumbv2/123dok/3987746.1931166/2.612.221.448.191.325/figure-library-send-recv-synchronized-using-way-protocol.webp)