115
Luwak
Coffee Classification Using UV-Vis Spectroscopy Data: Comparison
of Linear Discriminant Analysis and Support Vector Machine Methods
Diding Suhandy
1*and Meinilwita Yulia
21Department of Agricultural Engineering, Faculty of Agriculture, The University of Lampung, Jl. Prof. Dr. Soemantri Brojonegoro No.1 Bandar Lampung 35145, Lampung, Indonesia
2Department of Agricultural Technology, Lampung State Polytechnic, Jalan Soekarno-Hatta No.10, Rajabasa, Bandar Lampung, Lampung Indonesia, 35141 discriminant analysis (LDA) and support vector machines classification (SVMC) methods for Luwak coffee classification. UV-Vis spectral data of 50 samples of pure Luwak coffee and 50 samples of pure non-Luwak coffee were acquired using a UV-Vis spectrometer in transmittance mode. The results show that UV-Vis spectroscopy combined with LDA and SVMC was effective method to classify Luwak and non-Luwak coffee samples. The classification result was acceptable and yielded 100% classification accuracy for both LDA and SVMC methods. However, due to the simplicity and volume of required calculation, in this present study LDA method is superior to SVMC method.
Keywords: Luwak coffee, authentication, linear discriminant analysis, Support Vector Machine UV-Vis spectroscopy.
Introduction
Luwak coffee or Asian palm civet coffee or Kopi Luwak (Indonesian words for coffee and palm civet)
is well known as the world’s priciest and rarest coffee (Marcone, 2004). Luwak coffee is any coffee bean (arabica or robusta coffee) which has been eaten and passed through the digestive tract of Asian palm civet (Paradoxurus hermaphroditus), which uses its keen senses to select only the best and ripest berries. As a result,
its rarity as well as the coffee’s exotic and unique production process ultimately accounts for its high selling
price, approximately a hundred times higher than regular coffee (International Coffee Organization, http://www.ico.org/prices/pr-prices.pdf).
Luwak coffee has been a target for fraud trading by mixing Luwak coffee with other cheaper coffee.
In order to protect the authenticity of Luwak coffee and protect consumer from Luwak coffee adulteration,
it is very important to develop a robust and easy method for adulteration detection and quantification in
Luwak coffee. Recently, food authentication is a major challenge that has become increasingly important due to the drive to guarantee the actual origin of a product and for determining whether it has been adulterated with contaminants or filled out with cheaper ingredients (Ashurst and Dennis, 1996).
At recent situation, there is no internationally accepted method of verifying whether a bean is Luwak
coffee or non-Luwak coffee. Traditionally, coffee aroma has been used to characterize coffee quality.
Sensory panel evaluation is commonly used to assess the aroma profile of coffee. However, this technique has some limitations. For example, it is quite difficult to train the panel effectively in order to limit subjectivity of human response to odors and the variability between individuals (Shilbayeh and Iskandarani, 2004).
Several studies have reported the development of reliable and specific coffee authentication methods.
Near infrared (NIR) spectroscopy, mid infrared spectroscopy, gas chromatography–mass spectrometry and
high performance liquid chromatography (HPLC) have been used for quality control, classification and
Aceh International Journal of Science and Technology
ISSN: p-2088-9860; e-2503-2398
116
authentication of coffee samples (Briandet et al., 1996; Domingues et al., 2014; Pizarro et al., 2007; Tavares
et al., 2012). However, most of these instrumental techniques require harmful reagents and/or expensive
equipment with large operational/maintenance costs (Souto et al., 2015; Souto et al., 2010). In this context,
ultraviolet and visible (UV-Vis) spectroscopy would be a simpler and less costly alternative.
In the previous study, UV-Vis spectroscopy has been used together with linear based method, SIMCA
and PLS-DA, for classificationof Luwak and non-Luwak coffee samples with good result (Suhandy et al.,
2016; Yulia and Suhandy, 2017). However, due to variability of the resources of Luwak coffee (origin,
processing methods etc.), a non-linear relationship may be occurred and linear-classification based method may not be sufficient to handle it. For this reason, development a robust model based on non-linear approach is needed. In this study, the comparison between linear method (linear discrimination analyses/LDA) and non-linear method (support vector machines classification/SVMC) was investigated to
classify Luwak and non-Luwak coffee samples.
Materials and Methods Samples
A number of 100 samples were provided (1 gram weight for each samples). There are two types of
samples: Luwak coffee samples (robusta pure Luwak coffee, 50 samples) and non-Luwak coffee samples
(robusta pure non-Luwak coffee, 50 samples).Luwak and non-Luwak coffee samples were directly collected
from coffee farmer at Liwa, Lampung, Indonesia. An aqueous extraction procedure of the coffee samples was performed based on Suhandy and Yulia (2017a; 2017b). For multivariate analysis, the samples were divided into two groups: calibration sample set (70 samples) and prediction sample set (30 samples).
UV-Vis Spectral Data Acquisition
The UV-Vis spectral data of aqueous coffee samples were acquiredin the range of 200-400 nm by
using a UV-Vis spectrometer (Genesys™ 10S UV-Vis, Thermo Scientific, USA). This spectrometer was
equipped with a quartz cell with optical path of 10 mm. The spectral acquisition was done at spectral resolution of 1 nm at a room temperature. The raw spectra (without any preprocessing) and Savitzky-Golay
2nd derivative spectra (11 windows) were used for further analysis.
Linear Discriminant Analysis (LDA) Method
Linear discriminant analysis (LDA) is a classical statistical approach for feature extraction and
dimension reduction and mostly employed among many supervised pattern recognition methods (Chen et
al., 2011; Jia et al., 2016). LDA is used for classifying objects into groups or clusters by determining the
similarity of unknown samples (Marques et al., 2016). LDA computes the optimal transformation
(projection), which minimizes the ratio of intra-class difference (of the dataset) and maximizes the ratio of inter-class difference simultaneously thereby guaranteeing maximal separability. More details about LDA
can be found in several previous reported studies (Sánchez and Sarabia, 1995; Belousov et al., 2002)
It is noted that for an LDA to be a well-posed problem, the number of samples in the calibration set should be larger than the number of variables. Often variable selection is used during model development when LDA is applied to spectral data. In this study, variable selection was done based on visualization of
Savitzky-Golay 2nd derivative spectra. The wavelengths with high absorbance was selected for input in the
LDA.
Support Vector Machine Classification (SVMC)
Support vector machines (SVM) were initially been developed by Vapnik and his co-workers (Bishop,
2007; Vapnik, 1995) as a binary classification tool. SVM is one of machine learning method that has
recently become popular and widely used and investigated because of its ability in prediction for both,
classification and regression (Ghasemi-Varnamkhasti et al., 2015). SVMC was originally developed for the
linear classification of separable data, but is applicable to non-linear data with the use of kernel functions. SVMC is used in machine learning, optimization, statistics, bioinformatics, and other fields that use pattern recognition. Theoretically, SVMC maps the original data points from the original data space to a high or
infinite dimensional feature space. Then, a hyper plane is created to classify the classes (Luts et al., 2010).
Mapping of data from real space to feature space is performed by using a kernel function
(Khanmohammadi et al., 2014).SVMC usually combined with some features selection methods since SVMC
may cause some problems when dealing with large number of input variables (Noori et al., 2011). In the
117
interval) to 20 principal components (PCs,) which was then used for developing SVM models. More details
about SVMC can be found in the literatures(Hearst et al., 1998; Amendolia et al., 2003).
In this present study, SVMC is developed using The Unscrambler® 10.5, a multivariate software from
CAMO (Oslo, Norway). The SVMC algorithm used within The Unscrambler® is based on code developed and released under a modified BSD license by Chih-Chung Chang and Chih-Jen Lin of the National Taiwan University (Chang and Lin, 2011). Two SVMC types are available in The Unscrambler®. These are based on different means of minimizing the error function of the classification: C-SVMC and nu-SVMC. In this study, algorithm of C-SVMC was selected for developing SVMC model. In the C-SVMC, a capacity factor, C, can be defined. The value of C should be chosen based on knowledge of the noise in the data being modeled. The C parameter tells the SVMC optimization how to avoid misclassifying the training samples. The kernel function to be used as a separation of classes can be chosen from the following four options: linear, polynomial, radial basis function (RBF) and sigmoid. Here we used RBF as kernel function. RBF is a simple function and can model systems of varying complexity. RBF can classify multi-dimensional data better than linear kernel function and it has fewer parameters than the polynomial kernel to set (Konduru
et al., 2015). A grid search where the values of key parameters such as C are varied systematically in order to monitor the cross-validation error is therefore recommended. All calculation of LDA and SVMC
methods were performed using The Unscrambler® 10.5, a multivariate software from CAMO (Oslo,
Norway).
Results and Discussions
Spectral Analysis of Luwak and Non-Luwak Coffee Samples
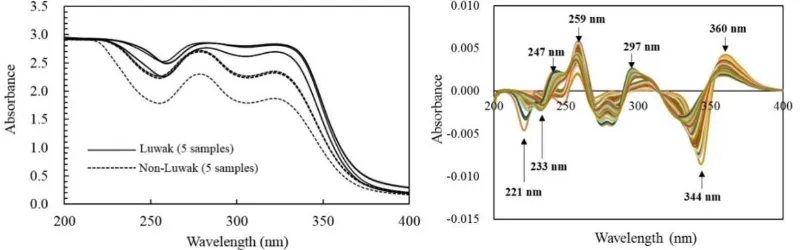
Figure 1 (left) shows the raw spectral data of Luwak (5 samples) and non-Luwak (5 samples) coffee
samples in the range 200-400 nm (UV-Vis). The spectra highly overlap. However, Luwak coffee samples
tends to have higher absorbance than that of non-Luwak coffee samples. It can be seen that high variability
of spectra was observed for Luwak and non-Luwak coffee samples. This may be due to baseline different.
For this, we applied Savitzky-Golay (SG) 2nd derivation on the raw spectra with width of windows 11.
Figure 1 (right) shows the SG spectra for all samples (100 samples). Several wavelengths with high absorbance were observed at 221 nm, 233 nm, 247 nm, 259 nm, 297 nm, 344 nm and 360 nm. Those wavelengths are closely related to absorbance of several constituents in coffee. For example, wavelength at 297 nm is closely related to the absorbance of caffeic acid, while wavelength at 360 nm are closely related to the absorbance of chlorogenic acid (CGA) (Suhandy and Yulia, 2017b). The wavelength at 259 nm is closely related to the absorbance of vanillic acid.Those wavelengths will be used for variable input in linear discrimination analysis (LDA) method.
Figure 1. Absorbance of raw spectra (left) and SG 2nd derivative spectra (right) of Luwak and non-Luwak
coffee samples in the range 200-400 nm.
Discrimination Analysis Using LDA Method
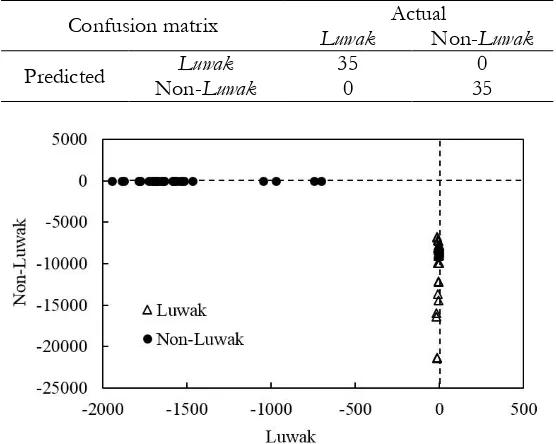
Table 1 shows the result of discrimination using LDA (35 Luwak coffee and 35 non-Luwak coffee
samples). The LDA was performed using 7 variables (wavelength at 221 nm, 233 nm, 247 nm, 259 nm, 297 nm, 344 nm and 360 nm). The discrimination rate was 100% in calibration which all samples were properly classified to appropriate class. Figure 2 shows the discrimination plot of LDA result. The discrimination plot is a visualization of the LDA results for the calibration or training samples. Every sample is displayed and the axes are for two of the classes in the model. Samples lying close to zero for a class are associated
non-118 Luwak class).
Table 1. The result of discrimination in calibration sample set using LDA method.
Confusion matrix Actual
Luwak Non-Luwak
Predicted Luwak 35 0
Non-Luwak 0 35
Figure 2. Discrimination plot of LDA result for calibration samples.
Discrimination Analysis Using SVMC Method
The SVMC model is shown in Figure 3. This SVMC model was developed using RBF function with
the following parameters: C=100, gamma=10 and number of support vectors (SVs) =18. In this figure it
is apparent that the Luwak and non-Luwak samples are well separated (100% accuracy). The confusion
matrix for calibration samples using SVMC model is shown in Table 2.
Figure 3. The SVMC model for Luwak and non-Luwak classification using 2 PCs.
Table 2. The result of discrimination in calibration sample set using SVMC method.
Confusion matrix Actual
Luwak Non-Luwak
Predicted Luwak 35 0
Non-Luwak 0 35
Classification New Samples Using LDA and SVMC Models
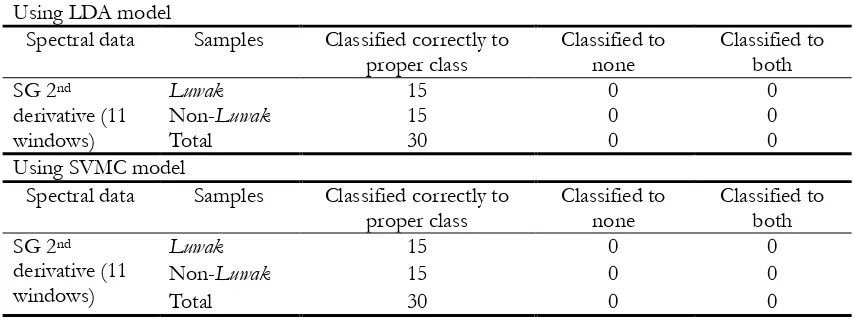
To evaluate the performance of the developed LDA and SVMC models, a prediction using different
(new) samples was performed. A number of 30 samples (15 Luwak and 15 non-Luwak samples) was
119
class both in LDA and SVMC models (100% classification accuracy for both models). This result shows
that a discrimination model for simple and consistent determination of Luwak and non-Luwak coffee using
UV-Vis spectroscopy coupled with linear (LDA) and non-linear (SVMC) methods could be developed and well tested.
Table 3.Classification results for Luwak and non-Luwak coffee samples in prediction set using LDA and
SVMC models. Using LDA model
Spectral data Samples Classified correctly to
proper class
Spectral data Samples Classified correctly to
proper class
In general, it can said that the SVM classifier in most reported works consistently outperformed LDA
(Konduru et al., 2015). For example, Balabin et al. (2010) used several linear and nonlinear classifier to
classify gasolines near infrared (NIR) spectral data. The result showed that the accuracy of SVM (100%)
was better than that of LDA (87%). Previously, Naseer et al. (2013) presented an fNIRS-based online binary
decision decoding framework based on the signals acquired from the prefrontal cortex. The LDA and SVM
classifiers were used to decode the binary decisions as “yes” or “no”. The average SVM classification
accuracy was 82.14 %, whereas the average LDA accuracy was 74.28 %. Recently, Shao et al. (2017) utilized
NIR spectroscopy and several classifiers to develop a rapid classification of Chinese quince fruit provenance. It was demonstrated that using raw spectra, the accuracy of SVM (98%) is better than LDA (96%). In our recent work, both LDA and SVM classifier worked well with 100% of accuracy achieved. As
mentioned by Balabin et al.(2010), if there is no difference in term of accuracy, we can consider several
aspects to select appropriate classifier: simplicity for investigator (comprehensibility of main algorithms, availability and price of software, etc.) and volume of required calculations (capacity of computers for
realization, time and price of a model creation, etc.) (Balabin et al., 2008). With respect to these parameters,
the LDA is simpler (ease of use) and faster (less computation time needed) classifier comparing to SVM classifier.
Conclusion
UV-Vis spectroscopy combined with linear (LDA method) and non-linear (SVMC method)
classification algorithm could be applied successfully to classify Luwak and non-Luwak coffee samples. In
the calibration samples, the confusion matrix shows 100% accuracy for LDA and SVMC methods. All prediction samples were correctly classified to proper class both in LDA and SVMC models. The result of
this present study offers a simple and accurate method for monitoring Luwak coffee authentication. This
method is useful to detect and quantify adulteration in Luwak coffee. However, in this present study with
respect to simplicity and volume of required calculation, the LDA method is more recommended than SVMC method.
Acknowledgements
This research was supported by the Indonesian Ministry of Research, Technology and Higher
Education (KEMENRISTEKDIKTI) through Penelitian Strategis Nasional (STRANAS Grant No.
120
References
Amendolia, S.R., Cossu, G., Ganadu, M.L., Golosio, B., Masala, G.L. and Mura, G.M.2003. A comparative study of K-Nearest Neighbour, Support Vector Machine and Multi-Layer Perceptron for
Thalassemia screening. Chemometrics and Intelligent Laboratory Systems, 69: 13–20.
Ashurst, P.R. and Dennis, M.J. (Eds.). 1996. Food Authentication, Blackie Academic & Professional, London, UK.
Balabin, R.M., Safieva, R.Z. and Lomakina, E.I. 2010. Gasoline classification using near infrared (NIR)
spectroscopy data: Comparison of multivariate techniques. Analytica Chimica Acta, 671: 27–35.
Balabin, RM., Safieva, R.Z. and Lomakina, E.I. 2008. Wavelet neural network (WNN) approach for calibration model building based on gasoline near infrared (NIR) spectra. Chemometrics and
Intelligent Laboratory Systems, 93 (1): 58–62.
Belousov, A.I., Verzakov, S.A. and von Frese, J. 2002. A flexible classification approach with optimal generalisation performance: support vector machines. Chemometrics and Intelligent Laboratory
Systems, 64: 15–25.
Bishop, C.M. 2007. Pattern Recognition and Machine Learning, Springer.
Briandet, R.,Kemsley, E.K. and Wilson, R.H.1996. Approaches to adulteration detection in instant coffees using infrared spectroscopy and chemometrics. Journal of the Science of Food and Agriculture, 71:
359 – 366.
Chang, C.C. and Lin, C.J. 2011. LIBSVM: A library for support vector machines. ACM Transactions on
Intelligent Systems and Technology, 2: 1–27.
Chen, Q., Cai, J., Wan, X. and Zhao, J. 2011. Application of linear/non-linear classification algorithms in discrimination of pork storage time using Fourier transform near infrared (FT-NIR) spectroscopy.
LWT Food Science and Technology, 44:2053–2058.
Domingues, D.S., Pauli, E.D., Abreu, J.E.M., Massura, F.W., Cristiano, V., M.J. Santos, M.J. and Nixdorf, S.L. 2014. Detection of roasted and ground coffee adulteration by HPLC by amperometric and by
post-column derivatization UV–Vis detection. Food Chemistry, 146: 353–362.
Ghasemi-Varnamkhasti, M., Mohtasebi, S.S., Siadat, M., Ahmadi, H. and Razavi, S.H. 2015. From simple classification methods to machine learning for the binary discrimination of beers using electronic
nose data. Engineering in Agriculture, Environment and Food, 8:44–51.
Hearst, M.A., Scholkopf, B., Dumais, S., Osuna, E. and Platt, J. 1998. Support vector machines. IEEE
Intelligent Systems, 13:18–28.
Jia, S., Yang, L., An, D., Liu, Z., Yan, Y., Li, S., Zhang, X., Zhu, D. and Gu, J. 2016. Feasibility of analyzing frost-damaged and non-viable maize kernels based on near infrared spectroscopy and chemometrics.
Journal of Cereal Science, 69:145–150.
Khanmohammadi, M., Karami, F., Mir-Marques, A., Garmarudi, A.B., Garrigues, S. and Guardia, M.D. 2014. Classification of persimmon fruit origin by near infrared spectrometry and least
squares-support vector machines. Journal of Food Engineering, 142: 17–22.
Konduru, T., Rains, G.C. and Li, C. 2015. Detecting sour skin infected onions using a customized gas sensor
array. Journal of Food Engineering, 160: 19–27.
Luts, J., Ojeda, F., Plas, R.V., Moor, B.D., Huffel, S.V. and Suykens, J.A. 2010. A tutorial on support vector machine-based methods for classification problems in chemometrics. Analytica Chimica Acta, 665:
129–145.
Marcone, M. F. 2004. Composition and properties of Indonesian palm civet coffee (Kopi Luwak) and
Ethiopian civet coffee. Food Research International, 37: 901–912.
Marques, A.S., Castro, J.N., Costa, F.J., Neto, R.M. and Lima, K.M. 2016. Near infrared spectroscopy and variable selection techniques to discriminate Pseudomonas aeruginosa strains in clinical samples.
Microchemical Journal, 124:306–310.
Naseer, N., Hong, M.J. and Hong, K.S. 2014. Online binary decision decoding using functional near-infrared
spectroscopy for the development of brain–computer interface. Experimental Brain Research, 232
(2):555–564.
Noori R., Karbassi, A., Moghaddamnia, A., Han, D., Zokaei-Ashtiani, M. and Farokhnia, A. 2011. Assessment of input variables determination on the SVM model performance using PCA, Gamma test, and forward selection techniques for monthly stream flow prediction. Journal of Hydrology,
401:177–89.
121
Analytica Chimica Acta, 585: 266–276.
Sánchez, M.S. and Sarabia, L.A. 1995. Efficiency of multi-layered feed-forward neural networks on classification in relation to linear discriminant analysis, quadratic discriminant analysis and
regularized discriminant analysis. Chemometrics and Intelligent Laboratory Systems, 28: 287–303.
Shao, W., Li, Y., Diao, S., Jiang, J. and Dong, R. 2017. Rapid classification of Chinese quince (Chaenomeles speciosa Nakai) fruit provenance by near-infrared spectroscopy and multivariate calibration.
Analytical and Bioanalytical Chemistry, 409: 115–120.
Shilbayeh, N.F. and Iskandarani, M.Z. 2004. Quality control of coffee using an electronic nose system.
American Journal of Applied Sciences, 1: 129–135.
Souto, U.T.C.P., Barbosa, M.F., Dantas, H.V., Pontes, A.S., Lyra, W.S., Diniz, P.H.G.D., Araújo, M.C.U. and
Silva, E.C. 2015. Identification of adulteration in ground roasted coffees using UV–VIS spectroscopy
and SPA-LDA. LWT - Food Science and Technology, 63: 1037–1041.
Souto, U.T.C.P., Pontes, M.J.C., Silva, E.C., Galvão, R.K.H., Araújo, M.C.U., Sanches, F.A.C., Cunha, F.A.S.
and Oliveira, M.S.R.2010. UV–Vis spectrometric classification of coffees by SPA–LDA. Food
Chemistry, 119: 368–371.
Suhandy, D. and Yulia, M. 2017a. The use of partial least square (PLS) regression and spectral data in UV-visible region for quantification of adulteration in Indonesian palm civet coffee. International Journal of Food Science, 2017: 1-7.
Suhandy, D. and Yulia, M. 2017b. Peaberry coffee discrimination using UV-visible spectroscopy combined with SIMCA and PLS-DA. International Journal of Food Properties, 20: S331-S339.
Suhandy, D., Yulia, M., Waluyo, S., Sugianti, C., Iriani, R., Handayani, F.N. and Apratiwi, N. 2016. The potential use of ultraviolet-visible spectroscopy and soft independent modelling of class analogies
(SIMCA) for classification of Indonesian palm civet coffee (kopi Luwak). In Proceedings of the
USR International Seminar on Food Security, pp. 245-253.
Tavares, K. M., Pereira, R.G.F.A., Nunes, C.A., Pinheiro, A.C.M., Rodarte, M.P. and Guerreiro, M.C.2012. Mid-infrared spectroscopy and sensory analysis applied to detection of adulteration in roasted coffee
by addition of coffee husks. Quimica Nova, 35: 1164–1168.
Vapnik, V.N. 1995. The Nature of Statistical Learning Theory, Springer Verlag, New York.
Yulia, M. and Suhandy, D. 2017. Indonesian palm civet coffee discrimination using UV-visible spectroscopy