Al AND Fe IN PM 2.5 AND PM 10 SUSPENDED PARTICLES IN SOUTH-CENTRAL FLORIDA: THE IMPACT OF THE LONG RANGE
TRANSPORT OF AFRICAN MINERAL DUST
JOSEPH M. PROSPERO1∗, ILHAN OLMEZ2and MICHAEL AMES3 1University of Miami, Rosenstiel School of Marine and Atmospheric Science, Miami, U.S.A.;
2Fatih University, Beylikduzu, Buyuk Cekmece, Istanbul, Turkey
3Environmental Research and Radiochemistry, Nuclear Reactor Laboratory, Massachusetts
Institute of Technology, Cambridge, U.S.A.
(∗author for correspondence, e-mail: [email protected]; fax: +1 (305) 3614891)
(Received 6 May 1999; accepted 3 February 2000)
Abstract. Aluminum and iron were measured in daily samples collected at urban and rural sites near Ft. Myers, Florida, in 1995–1996 using a dichotomous sampler. Al and Fe concentrations were low during most of the year but they increased dramatically during summer when African dust was advected into Florida. The ratio of fine (less than 2.5µm diameter) to coarse (2.5–10µm) Al and Fe is relatively constant in African dust events with the fine accounting for a third to a half of the total. Also the mass ratio of Al-to-Fe is relatively constant at 1.8, a value similar to average crustal material. In contrast, in non-African dust the fine-to-coarse and Al-to-Fe ratios are extremely variable and generally much lower than those during African events when dust concentrations ranged up to 86µg m−3. The timing and magnitude of the Ft. Myers dust peaks closely matched those measured concurrently in Miami, 200 km to the southeast. Large areas of the eastern United States are fre-quently impacted by African dust every summer. Although dust concentrations can reach very high values it seems unlikely that African dust events alone will cause a violation of the Environmental Protection Agency’s standards for PM 2.5 or PM 10. However, African dust in conjunction with emissions from local and regional sources could conceivably present a problem with compliance. The probability of such an occurrence is heightened by the fact that dust concentrations are highest in the summer when pollution levels are often at a maximum in the eastern states.
Keywords:aerosols, Africa, air quality, aluminum, iron, mineral dust, PM 2.5, PM 10, Sahara, soil
1. Introduction
Mineral dust has come to be recognized as an important aerosol constituent (An-dreae, 1996). On a global scale, dust can affect the radiative properties of the
atmosphere (Tegenet al., 1997; Sokolik and Toon, 1996), it can serve as a reactive
surface for atmospheric gases (Denteneret al., 1996), and it is a major source of
minerals (Duce, 1995; Prospero, 1981, 1996) and associated nutrients (Prospero
et al., 1996) to the global ocean. There is considerable evidence that mineral dust
transported from sources in North Africa could also play an important role in air quality in the eastern United States. Studies carried out on Barbados, West Indies
(13.17◦N, 59.43◦W), continuously since 1965 show that large quantities of mineral
Water, Air, and Soil Pollution 125: 291–317, 2001.
dust are carried from sources in North African, including the Sahara, across the
North Atlantic every year by the trade winds (Prospero and Nees, 1986; Liet al.,
1996; Li-Jones and Prospero, 1998). Recently Prospero (1999) reported the results of a continuous aerosol sampling program carried out at a coastal site in Miami, Florida, for the period 1974–1996. These data show that large amounts of African mineral dust are periodically carried into Florida every summer yielding daily
concentrations that are typically in the range of about 10–100µg m−3. Dust events
usually last at least several days and can extend over several weeks. Maximum dust
concentrations usually occur in July (monthly mean, 16.3µg m−3) but relatively
high concentrations are also observed in June (8.4µg m−3) and August (9.8µg
m−3). Over the entire 23 yr period, dust concentrations varied considerably from
year-to-year in response to various meteorological and climatological factors. The greatest dust amounts were obtained in 1983–1984 at the time of severe drought in North Africa (Prospero and Nees, 1986). Despite the year-to-year variations in dust transport, African dust was always the dominant aerosol constituent during the summer months over the 23 yr of record.
The meteorological conditions associated with African dust advection into the Caribbean have been well documented (Carlson and Prospero, 1972; Prospero and
Carlson, 1972; Karyampudi and Carlson, 1988; Westphal et al., 1987). Dust is
commonly carried in a layer that extends from the surface to roughly 3 km over
the western Atlantic (Karyampudiet al., 1999) and the southeastern United States
(Prospero et al., 1987; Gatz and Prospero, 1996). Isentropic air mass trajectories
(Merrill, 1994) show that during most of the month of August, trajectories con-sistently arrive from the southerly sectors; over the tropical Atlantic they hook to the east, toward Africa. The pattern of these dust-bearing trajectories is consistent with the general large-scale dust transport patterns observed on Barbados (Savoie
et al., 1989, 1992) and on Bermuda (32.27◦N, 64.87◦W) (Arimotoet al., 1992,
1995). These same patterns are observed in Miami every year in conjunction with dust events. The temporal variability and the spatial scale of African dust events is consistent with satellite depictions of aerosol distributions over the western North
Atlantic and the Caribbean. The AVHRR aerosol optical depth product (Husaret
al., 1997) and the TOMS absorbing aerosol product (Hermanet al., 1997) show
huge ‘plumes’ of aerosol covering this region during much of the summer every year. These plumes can also be cleary seen in the conventional meteorological
satellites such as GOES and METEOSAT (Karyampudi et al., 1999) and in the
ocean color satellite, SeaWiFS.
The advection of African dust into the United States must be considered in the context of the National Air Quality Standard (NAAQS) for suspended particulate matter (PM). The Environmental Protection Agency (EPA) recently established a
new standard (Federal Register, 1997) for particles 2.5µm diameter and smaller
(henceforth, the PM 2.5 standard) that specifies an annual mean of 15 µg m−3
and a 24 hr mean of 65 µg m−3 (based on the 98th percentile of the frequency
PM 2.5 AND PM 10 SUSPENDED PARTICLES IN SOUTH FLORIDA 293
Figure 1.Map of South Florida showing the locations of the sampling sites in Ft. Myers and Miami.
matter focused on particles having a diameter of 10µm and smaller (PM 10). The
EPA, which is required by the Clean Air Act to set standards for air quality at levels that protect public health with an adequate margin of safety, selected a size
threshold of 2.5µm diameter based on studies that show that particles less than
this diameter can efficiently penetrate into the lungs (Wilson and Spengler, 1996) and on epidemiological studies. During African dust events, the concentration of PM 2.5 dust coupled with particles from local emissions could conceivably yield aerosol concentrations that challenge the EPA’s PM 2.5 standard (Prospero, 1999). Because African dust incursions are synoptic-scale events, African dust could
af-fect a much larger region than south Florida. Recently Perryet al. (1997) used data
from the IMPROVE (Interagency Monitoring of Protected Visual Environments) network to show that African dust has a significant impact on PM 2.5 air quality over a large area of the United States. The effects are greatest in the southern states but they are readily discernable in the central and northeastern states as well. Thus African dust events could affect compliance with EPA standards across a broad region of the country.
dust in Miami, 200 km to the southeast (Figure 1). Both Al land Fe are major soil components; average crustal material contains 6–8% Al and 5% Fe (Wedepohl, 1995; Taylor and McLennan, 1985). The Ft. Myers aerosol data reveal several periods in the summer of 1995 and 1996 when Al and Fe concentrations increased dramatically. Aerosol data collected at a coastal site in Miami (Prospero, 1999) show that mineral dust concentrations were very high during those same time peri-ods. By comparing the differences and similarities in the concurrently-collected samples from these sites, we are able to characterize the properties of aerosols derived from local and regional sources in contrast to those advected across the Atlantic from Africa.
2. Sampling Sites
2.1. FT. MYERS
Measurements were carried out at two sites in the Ft. Myers-Cape Coral area dur-ing 1995–1996. One site was at Terry Park, located adjacent to route 80, midway between Route 25 and Route 41 on the south shore of the Calloosahatchee River and on the northern side of the Ft. Myers urban center (Figure 1). We henceforth refer to the Terry Park location as the ‘Urban’ site because of its proximity to the cities of Ft. Myers and Cape Coral, which together have a population of about 150 000. A second sampling system was installed 16 km northeast of Terry Park at Franklin Locks; here the population density is low and consequently we refer to it as the ‘Rural’ site. At the Urban site sampling began on 2 June 1995 and ended on 30 October 1996; at the Rural site sampling began later, 26 October 1995, and ended at approximately the same time as the Urban site, 26 October 1996.
2.2. MIAMI
The Miami data are fully discussed in Prospero (1999). Because the sampling techniques and analytical protocol are different from that in Ft. Myers, we briefly discuss them here. Aerosol sampling is carried out on Virginia Key at the campus of the Rosenstiel School of Marine and Atmospheric Science (RSMAS), University of Miami, located at the water’s edge on the southern end of Virginia Key, about 4 km east of mainland Miami. During 1995–1996 the filter was mounted at the top of a 16 m fold-over tower on top of a 12-m high building located 2 m above mean sea level and 10 m from the water’s edge. The aerosol sampling system was electronically controlled so that the sampler was activated only when the winds
blew from over the ocean and when the wind speed was greater than 1 m s−1 as
PM 2.5 AND PM 10 SUSPENDED PARTICLES IN SOUTH FLORIDA 295
RSMAS campus. Most of the island is set aside as park areas and, thus, the island is largely covered with trees and shrubbery; the coast lines of much of the island are densely covered with mangrove. A small residential community is located towards the southern end of the island. There are no industrial activities on the island. The only substantial types of pollution would be emissions from automobiles.
3. Experimental Protocols
3.1. FT. MYERS
At both the Urban and Rural sites, aerosol samples were collected by means of automatic dichotomous samplers (Graseby/Anderson Instruments, Smyrna,
Geor-gia). The inlet has a 50% cut-off size at 10µm aerodynamic diameter; the second
stage is a virtual impactor having a cut point at 2.5µm diameter. The two size
frac-tions are collected on 37 mm diameter TeflonTMmembrane filters (pore size 0.2µm
diameter). Henceforth we refer to the 2.5–10µm size sample as the ‘coarse’
frac-tion and the less-than 2.5µm sample, the ‘fine’ fraction. The flow rate through the
sampler is 1 m3hr−1; flow through the fine and coarse filters was 0.9 and 0.1 m3
hr−1, respectively.
The sampling program began on 2 June 1995 at the Urban site. Initially each sample was collected over a nominal 24 hr time period beginning at noon. On 26 October 1995 (the date when sampling was also begun at the Rural site) the protocol was changed so that the sample duration was 12 hr with sample changes at noon and midnight. Samples were changed automatically over the course of a one week period. At weekly intervals, the filters were removed from the sampler, the flow rate data for each channel was noted, and a new set of filters was installed in the system.
Exposed filters were packaged in individual sealed petri dishes and shipped to MIT for instrumental neutron activation (INA) analysis. A subset of samples was selected for analysis and of these only a limited number of samples were analyzed for both the fine and coarse fractions; most effort concentrated on the fine fraction. For a detailed description of the neutron activation procedures, see Olmez (1989). At MIT, sample processing was carried out in a class-100 laminar flow clean
hood. The filters were placed in HNO3-washed polyethylene vials which were
subsequently irradiated in the MIT Research Reactor (MITR-11) in a neutron flux
of 8×10¹² n cm−2 s−1. The samples were irradiated for 10 min and the emitted
radiation measured shortly thereafter to observe the decay of radioisotopes with
short half lives, ranging from 2.2 min (28Al) to 15 hr (24Na). After a
(SRM1633), mercury in sediment (RM8408), and orchard leaves (SRM1571). The concentration of individual elements in the sample was determined on the basis of the intensity of specific gamma rays that are characteristic for the element (Olmez, 1989). Gamma spectra from the irradiated samples and standards were measured using four High Purity Germanium (HPGe) detector systems (Canberra Industries, Meriden, CT) connected to a VAX 3100 workstation which runs interactive neutron activation analysis software (Canberra Industries). Because the focus of this article is on the role of mineral dust, at this time we report only on the results of the analyses of Fe and Al.
3.2. MIAMI
The Miami protocol is presented in detail by Prospero (1999). Samples are col-lected daily except over weekends when samples are three-days long and over holidays when samples may be longer. Bulk aerosol samples were collected by
drawing air through 20×25 cm Whatman 41 (W41) filters at a flow rate of about
1.1 m3min−1. The filter cassette is covered by a protective hat. The hat does not
significantly affect the collection efficiency of the filters with regard to particle size. Comparisons were made of an upward-facing uncovered filter and a hatted filter at a site in the Canary Islands, off the coast of Africa, where the particle size distribution had a considerably larger fraction of large particles; there was no significant difference in the amounts of mineral dust collected by the two systems
(Maringet al., 2000). The water-soluble ions are extracted with Milli-Q de-ionized
water. Dust is determined by ashing the extracted filter at 500◦C for about 14 hr
(i.e., overnight) to destroy all organic matter. The weight of the ash residue less that of the average blank is referred to as the ‘mineral ash’. Dust concentrations are calculated using the ash weight multiplied by factor of 1.3 to correct for the loss of soluble minerals during the extraction procedure and, during ashing, for the loss of volatiles and combustibles (e.g., organics) and the breakdown of some mineral phases (e.g., carbonates) (Prospero, 1999).
4. Results Ft. Myers
4.1. AlANDFeCONCENTRATION TRENDS
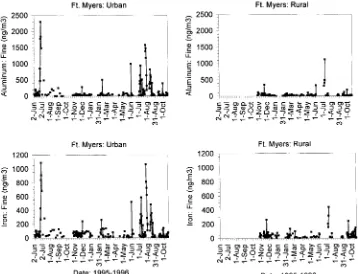
The time series of Al-fine (Alf) and Fe-fine (Fef) are shown in Figure 2 for both
the Urban and Rural sites. In general, concentrations are low except for several periods during which concentrations increase sharply; as will be shown in a latter section, these periods were concurrent with the appearance of high concentrations of African dust at the Miami site.
PM 2.5 AND PM 10 SUSPENDED PARTICLES IN SOUTH FLORIDA 297
Figure 2.The time series of PM 2.5 Al (Al-fine or Alf) and PM 2.5 (Fe-fine or Fef) for the Urban
sites (left side of figure) and Rural sites (right side of figure) in Ft. Myers.
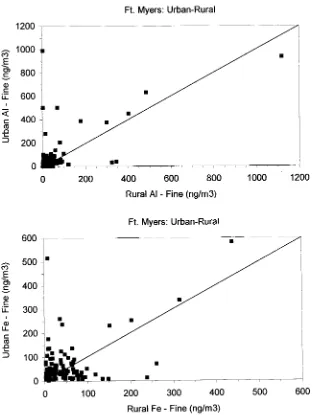
a scatter plot of Urban-fine versus Rural-fine for both Al and Fe during periods of concurrent operations. The four points along the 1:1 line are those obtained during the single dust event in July 1996. There are a number of moderately high concentration values that do not match up well. Especially notable is the Urban Alf
value of 991 ng m−3which matches to a Rural value close to zero; this corresponds
to the isolated Urban Alf peak on 31 May 1996 (Figure 2). A value at 503 ng m−3
corresponds to the single-value peak on 14 February 1996; the matching value in
the Rural data is 70 ng m−3. A third high value at 275 ng m−3is matched in the
Rural data by one at 15 ng m−3. Similarly in the Rural Alf data there are values at
344 ng m−3(20 November 1995) and 324 ng m−3(3 June 1996) that are associated
with single-point peaks; the corresponding samples from the Urban site are quite
low (28 ng m−3and 35 ng m−3, respectively) and within the limits of ‘background’
Figure 3.Top: Scatter plot of Urban Alf against Rural Alf. Bottom: Scatter plot of Urban Fef against Rural Fef.
across a network of two or more widely-separated samplers. This point is further discussed in a later section.
4.2. THE RELATIONSHIP BETWEEN FINE AND COARSE AEROSOL
CONCENTRATIONS
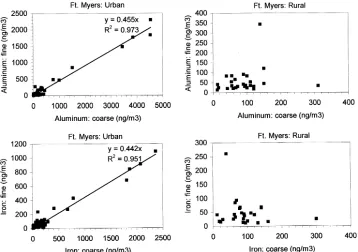
In Figure 4 the concentrations of the fine fraction of Al (Alf) and Fe (Fef) are
PM 2.5 AND PM 10 SUSPENDED PARTICLES IN SOUTH FLORIDA 299
Figure 4.Scatter plots of the concentrations of the fine fraction of Al and Fe against the coarse fraction for the Rural and Urban sites.
Rural sites (note the differences in the concentration scales). At the Urban site when
Alf and Fef concentrations are high there is an excellent correlation between the
two size fractions in both the Al and the Fe data; in contrast at the Rural site where no dust events occurred during the time when both fine and coarse factions were collected, the fine and coarse fractions are poorly correlated. In the Urban Al data
set, linear regression through zero yields a line with slope 0.455 (r2= 0.973). The
regression for Fef/Fec is essentially identical, 0.442 (r2= 0.951). Both the slope
of the lines and the high correlation are driven by 7 high concentration values. The 6 highest were obtained during the period 24–29 June 1995; the remaining value was obtained on 9 July 1995.
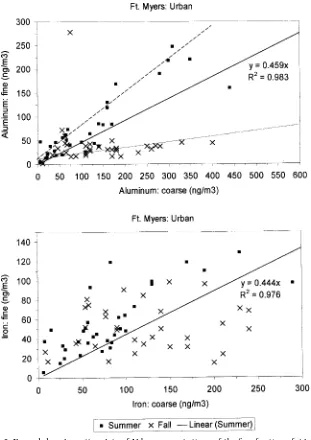
Figure 5 presents the same data as in Figure 4 (urban site only) but with the scales expanded at the lower end. In each panel the data are split into two groups, one for the time period 2 June through 7 September 1995 (i.e., a ‘summer’ group that encompasses the dust peaks in Figure 2) and the second group for the period 13 September to 29 November 1995 (i.e., a ‘fall’ group, when dust concentrations were consistently low). In Figure 5, the ‘summer’ Al values yield a regression line
through zero with a slope of 0.459 (r2= 0.983); the regression is largely driven by
Figure 5.Expanded scale scatter plots of Urban concentrations of the fine fraction of Al and Fe against the coarse fraction for the ‘summer’ season samples (filled square) and the ‘fall’ samples (X’s). Top: Alf vs. Alc. The solid line is the linear regression through all summer samples, many
of which are off-scale (see Figure 5). The heavy dashed line shows the trend of the intermediate ‘summer’ dust concentrations; the fine dashed line shows the trend of the intermediate ‘fall’ dust concentrations. Bottom: Same as top but for Fef and Fec. The solid line is the regression through all
PM 2.5 AND PM 10 SUSPENDED PARTICLES IN SOUTH FLORIDA 301
of 0.75. Thus, these two lines with slopes of (roughly) 0.5 to 0.8 encompass all the high and intermediate summer dust Al values.
In contrast, the ‘fall’ Al values in Figure 5 are more scattered and a regres-sion line through zero is not warranted. An unforced linear regresregres-sion yields an
equation: y = –0.021 + 42.2 (r2= 0.0022). The dust in the ‘fall’ population is
char-acterized by much higher concentrations of Alc particles relative to Alf particles,
a feature consistent with impacts from proximate sources. The topmost 7 data points on this line were obtained from samples collected between 26 October and 28 November 1995, 5 between 16–28 November. A line through these 7
val-ues yields a Alf/Alc slope of 0.12. Thus, even at intermediate dust-Al
concen-trations, there appears to be a clear distinction between African dust and local dust. The well-defined slope obtained from the November 1995 dust ‘events’ sug-gests that there may be local sources that could be responsible for moderately enhanced dust concentrations and that these sources have a fairly well defined
ratio of Alf-to-Alc which, in conjunction with other factors, could serve as an
identifying characteristic.
Figure 5 also shows an expanded scatter plot of Fef against Fec with the
val-ues separated into ‘summer’ and ‘fall’ groups. The summer group yields a linear regression that is essentially identical to that of the entire ensemble shown in Fig-ure 4. In contrast to the Al data in FigFig-ure 5, the fall group is very widely scattered and shows no coherent pattern. Thus the data in Figure 5 suggest that during the ‘fall’ months Al and Fe have different sources that are relatively independent of one another.
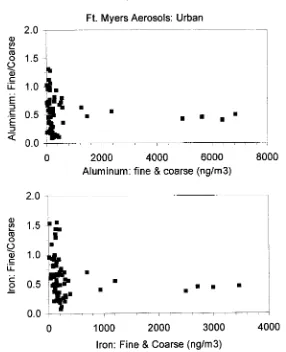
The relationship between the fine and coarse fractions of Al and Fe is depicted in a different way in Figure 6 which shows scatter plots of the Urban fine/coarse ratios against the combined fine and coarse fractions of Al and of Fe. At
concen-trations less than several hundred ng m−3the Urban fine/coarse ratios for both Al
Figure 6.Scatter plots of the fine/coarse ratio against the combined fine and coarse fractions for Al and for Fe from the Urban site. The data sets are truncated on the ordinate to show more detail of the ratio distributions in the dust peak.
4.3. Al-BASED DUST TIME SERIES
Previous studies (Liet al., 1996; Li-Joneset al., 1998; Prospero, 1999) have shown
that African dust collected in the western North Atlantic yields an Al/dust mass ratio of about 0.08, a value consistent with that reported for average crustal material (Taylor and McLennan, 1985; Wedepohl, 1995). We can estimate dust
concentra-tions based on the assumpconcentra-tions that Alf constitutes about 1/3 of the total Al (Alf
plus Alc) concentration (as shown in Section 4.2, above) and that Al comprises 8% of the total dust:
dustAl−f = (Alf)×3/0.08 = (Alf)×37.5 (1)
PM 2.5 AND PM 10 SUSPENDED PARTICLES IN SOUTH FLORIDA 303
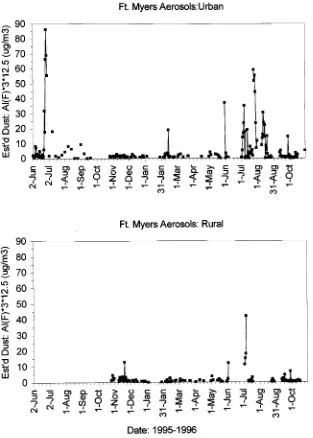
about one week; for four days, dust concentrations were in excess of 50µg m−3. In
the summer of 1996 there was a long period of enhanced dust concentrations. The first event began on 4 July and lasted for four days. The second event began on 25 July and continued through 15 August. Thus for a period of about 25 days during
the summer, dust concentrations exceeded 10µg m−3; because there are long gaps
in the data during this period, the number of dust days was actually greater as we will show in a later section.
4.4. Al/FeRATIO TRENDS RELATED TO AEROSOL SOURCE
Previous studies of African dust events (Glaccum, 1978; Glaccum and Prospero, 1980) suggest that the mineralogical and elemental composition of dust in indi-vidual dust episodes are relatively constant. To investigate this aspect with the
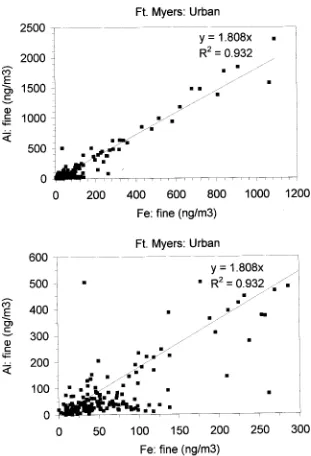
Ft. Myers data, we use the full data set to generate a scatter plot of Urban Alf
against Fef (Figure 8). This shows a very good relationship at the higher
aero-sol concentrations, yielding a Alf/Fef ratio of 1.81 (r2 = 0.932). At low aerosol
concentrations (Figure 8, bottom) the relationship is poor. The low-concentration samples reflect the impact of local sources; these clearly have a much more variable
Alf/Fef composition which might reflect the variability of the soils or the impact
of other types of sources for these two elements. In particular, it appears that at low Al and Fe concentrations, Fe becomes increasingly more important and more
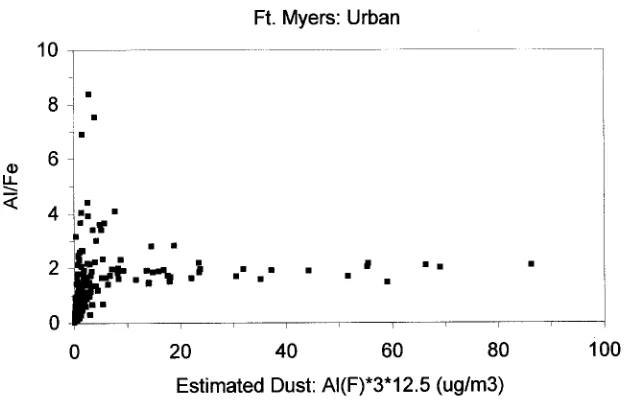
variable relative to Al in the fine fraction. The constancy of the ratio Alf/Fef in
African dust is displayed more clearly in Figure 9 which is a scatter plot of the
Alf/Fef against the estimated dust concentration based on Alf using Equation (1).
The vast majority of the data points yield Alf/Fef ratios below about 1.5; these
are associated with low estimated dust concentrations. In contrast, the higher dust
concentrations (values above about 5–10µg m−3) have ratios that are mostly in
the range 1.5–2.2 with the peak centered on 1.8. This ratio is consistent with that measured for average upper continental crustal material: 1.84 (Wedepohl, 1995); 2.30 (Taylor and McLennan, 1985).
Note that during low dust conditions (below about 5–10µg m−3), the use of
Alf as the estimator for mineral dust becomes less precise because of two factors:
the ratios of fine-to-coarse particles and of Al-to-Fe become much more variable at low concentrations.
5. Comparison of Ft. Myers and Miami Aerosol Data
Figure 7.Ft. Myers dust concentrations calculated on the basis of Alf concentrations assuming that the Alf/Alcratio is 1:2 and that Al constitutes 8% of the mineral dust mass. Top: Urban site; Bottom: Rural site.
PM 2.5 AND PM 10 SUSPENDED PARTICLES IN SOUTH FLORIDA 305
Figure 9.Scatter plot of the ratio Al/Fe against the estimated dust concentration based on fine-particle Al. The top panel shows the full data set; the bottom panel presents the same data with the ordinate restricted to show more clearly the ratios at lower values.
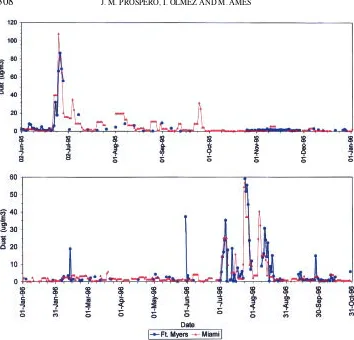
conditions. To meld the data sets, blank lines were inserted for days in which there were no Miami or Ft. Myers samples. For multi-day Miami samples, the average for the period was inserted for the appropriate days. The data from both sites are plotted as time series in Figure 10. In most cases, the major peaks are closely matched in terms of the timing of the dust peaks at the two sites and the absolute concentrations. The latter is especially impressive in light of the two very different approaches used to estimate dust concentrations and the different protocols that were used (that is, one based on the concentration of Al in the fine fraction and one based on the ash weight of a total aerosol filter). The agreement between the two data sets substantiates our assumptions about the relative constancy of the Al fine/course ratio and that the Al concentration in African mineral dust is about 8%. The data during the summer of 1996 are particularly impressive. Although the dust concentrations were not very high during the summer of 1996 relative to the long-term record (Prospero, 1999), they were substantial and they persisted over a relatively long time period (almost two months). During this period, the concen-trations varied considerably, producing many peaks. Both the Miami and Ft Myers sites captured this variability rather well, most notably the events around 2–12 July and 23–31 July. Indeed, where concurrent data are available at both sites, the four major dust peaks (26–27 June 1995; 7–8 July, 25–26 July, 12–13 August, 1996) are exactly coincident. This suggests that the dust-laden air masses traversed the 200 km between the two sites quite rapidly.
PM
Ft. Myers urban and Miami monthly mineral aerosol statistics
Month Year Ft. Myers – Urban Miami Notes
Estimated PM 2.5 dusta Estimated total dustb
Count Median Max Mean Count Median Max Mean Mean
June 1995 28 0.75 28.75 4.51 28 2.25 86.25 13.62 15.81
July 1995 5 0.59 6.06 1.65 5 1.78 18.17 4.95 8.97 1
Augustus 1995 5 1.48 2.72 1.28 5 4.45 8.16 3.85 8.61 2
September 1995 4 0.57 3.09 1.06 4 1.70 9.27 3.19 4.78 3
October 1995 5 0.38 0.47 0.34 5 1.14 1.40 1.02 0.6 2
November 1995 28 0.44 3.47 0.54 28 1.23 2.69 1.30 1.39
December 1995 8 0.41 0.96 0.46 8 1.23 2.88 1.37 0.98
January 1996 2 0.38 0.48 0.38 2 1.14 1.45 1.14 0.81
February 1996 11 0.45 6.29 1.02 11 1.34 18.87 3.05 2.07
March 1996 6 0.48 0.94 0.55 6 1.44 2.83 1.64 1.64
April 1996 1 0.39 0.39 0.39 1 1.16 1.16 1.16 1.56
May 1996 9 0.73 12.39 1.94 9 2.18 37.18 5.82 1.01 4
June 1996 4 0.31 1.10 0.44 4 0.94 3.29 1.31 1.45
July 1996 28 2.09 19.68 4.95 28 6.26 59.04 14.86 14.73
Augustus 1996 19 1.79 10.17 2.87 19 5.38 30.51 8.62 7.48
September 1996 19 0.26 4.85 0.66 19 0.77 14.54 1.98 0.88
October 1996 19 0.16 4.85 0.62 20 0.42 14.54 1.77 0.91
aEstimated dust in the PM 2.5 fraction based on Al and assuming 8% Al content in dust. bEstimated total (fine + coarse) dust based on PM 2.5 Al assuming a third of total in fine fraction.
Figure 10. Dust concentration data from Ft. Myers and Miami plotted as a time series. Top: June–December, 1995; Bottom: January-October, 1996. (Note the difference in the ordinate scales). The Ft. Myers dust concentrations are estimated on the basis of the fine-particle Al concentrations; Miami dust data are based on filter ash residue weights. Note that in the case of the dust event in late July 1996, the data points for the Ft. Myers and Miami samples for 25–26 July lie directly on top of one another.
data are presented in Table I along with the monthly maximum and median values. Note that at Ft. Myers the sample counts for many months are rather low which makes it difficult to make a valid comparison with Miami values. In particular the Ft. Myers means are low relative to Miami in July, August and September 1995 because no samples were taken during some of the large dust events that occurred during that period as can be seen in Figure 10. The agreement is excellent in 1996 when the sample continuity from the Ft. Myers Urban site is quite good.
Finally, it should be noted (in Figures 10, 11 and in Table I) that winter-spring
dust concentrations are low at both sites, typically around 1µg m−3. The monthly
mean dust concentration for the period October 1995 to April 1996 was 1.47µg
PM 2.5 AND PM 10 SUSPENDED PARTICLES IN SOUTH FLORIDA 309
Figure 11.Monthly mean mineral dust concentrations at Ft. Myers and Miami. Ft. Myers dust concentrations are estimated on the basis of the fine-Aluminum fraction as described above.
February 1996 when concentrations were relatively high at both sites; if the
Feb-ruary values are excluded the mean for the Fall-Winter period is about 1.2µg m−3
for both sites. Because the Miami sampling system is gated so as to sample only when winds blow from the ocean, we would not expect to see substantial impacts from local dust sources and, thus, low dust values are expected. But the low values
at Ft. Myers are surprising. Winter is the dry season in Florida (Henryet al., 1994).
It is also the agricultural season, when fields are plowed and cultivated across much of the State. Also, wind speeds are often quite high in winter, especially with the passage of vigorous cold fronts which typically begin in early winter and extend
into the spring. Despite this, the Ft. Myers Alf and Fef concentrations remain
low and relatively steady. The Ft. Myers data suggest that the impact of local dust sources is small all year long, even during fall and winter.
6. Trajectory Studies
(http://www.arl.noaa.gov/ ready.html). Trajectories (96 hr) were computed for three altitudes: 500, 1000 and 2000 m for 1800Z using the model version that incorpor-ates vertical velocities. Several conclusions can be made from this brief study. On most occasions the trajectories at Ft. Myers and Miami track one another fairly closely; this is not surprising since they are separated by only 200 km. At both sites high dust concentrations are associated with easterly and southerly trajectories. On some occasions high dust concentrations are measured at Ft. Myers with westerly winds, but the back trajectories eventually hook to the south and east.
Trajectories from the north are associated with low dust concentrations. This suggests that the state of Florida itself and the continental United States as a whole are poor sources of mineral dust that can be transported over great distances, a
factor emphasized by Perryet al. (1997). This is consistent with our earlier
obser-vation that at Ft. Myers dust concentrations were quite low during the winter when soils were dry and when fronts passed through the regions. This conclusion can not be stated so emphatically for the Miami data because of the fact that the sampler is sectored to the open ocean; but the results from Miami are none-the-less consistent in this regard with respect to northeasterly trajectories.
The trajectory studies are consistent with satellite imagery showing the time
progression of plumes across the Atlantic (Husaret al., 1997; Hermanet al., 1997;
Chiapelloet al., 1999). Over the western Atlantic the African dust plumes follow
two types of paths: one moves over the windward islands directly to the south-eastern states; another travels deep into the Caribbean and subsequently moves north over the Gulf of Mexico and either into the Central United States or to the east over Florida and the southeastern states. The association between African dust
and satellite products is clearly shown in Chiapello et al. (1999) who compared
the TOMS satellite aerosol index (Herman et al., 1997) with concurrent
meas-urements of mineral dust made at four sites in the North Atlantic: the Canary Islands and Cape Verde Islands, located off the west coast of Africa; Barbados and Miami. They found a very close correlation between major dust events as indicated by high concentrations of dust and the TOMS index. Indeed, individual events could be followed across the Atlantic in both the satellite product and the ground measurements.
PM 2.5 AND PM 10 SUSPENDED PARTICLES IN SOUTH FLORIDA 311
dramatically. On the 27th, the dust concentrations reached their maximum at both
sites, over 80µg m−3; at both sites, the trajectories at all levels arrive from the SW
but they hook strongly to the SE over Cuba. On the 28th, dust concentrations start to fall; the trajectories arrive from the SW but, as on the 27th, they hook strongly to the SE a short distance to the S of Florida. On the 29th and 30th, trajectories at both sites are strongly from the N but, once again, there is a very pronounced turn in the trajectories so that several days upstream the trajectories come from the S. By this time, dust concentrations have decreased sharply.
During the winter, trajectories reflect the dominant air flow in Central and South Florida which is from the NE except during the passage of cold fronts. As stated earlier, these winds tend to carry very low concentrations of mineral dust. The results of the trajectory studies for Miami and Ft. Myers are entirely consistent
with past trajectory studies of dust transport across the Atlantic (Savoieet al., 1992;
Merrillet al., 1994; Elliset al., 1993).
7. Discussion
This study shows that large areas of south and central Florida are frequently im-pacted by advected air masses that contain high concentrations of African mineral
dust. Perryet al. (1997) show that the influence of African dust events can extend
over a large area of the central and eastern United States. In their study they assess the temporal and spatial variability of PM 2.5 particle concentrations in a network of approximately 70 sites located in national parks and wilderness areas during the period 1992–1995. They note that the highest individual PM 2.5 dust concentra-tions were associated with sites in the eastern United States during the summer, not in the arid southwest as one might expect. Furthermore, there was a large-scale coherence in the temporal variability of the high PM 2.5 values, suggesting that they were associated with synoptic scale processes that are typical of incursions
of African dust. Perryet al. (1997) focus primarily on PM 2.5 concentrations and
composition characteristics. Although they do not present any data on fine/coarse soil dust concentrations for the southeastern states, they do present data for a limited number of African dust events observed in Shenandoah National Park, Virginia, from March 1993 to March 1994. Five dust events yielded a fine/coarse soil dust ratio of 0.8 (as estimated from their Figure 6). In comparison at Ft. Myers we obtained fine/coarse ratios of 0.46 for Al and 0.44 for Fe (our Figure 4); low-concentration dust events (our Figure 5) yielded values up to 0.8. For non-African
soil dust samples, Perryet al. (1997) obtained a value of about 0.2 (estimated from
their Figure 6). Our spread of values was larger than those of Perryet al. (1997)
The comparison of the Perryet al. (1997) fine/coarse concentration data and ours is limited by two factors: first, they report data from a site in Virginia for the period 1993–1994; second, our fine/coarse data only include one large dust event and it is for the period 1995–1996 and a larger set of low dust concentration
events. Nonetheless the data presented here and that in Perryet al. suggest that in
African dust events a third to a half of the PM 10 soil dust mass falls into the PM 2.5 fraction. Our conclusion is consistent with other aerosol size measurements of African dust made over the western North Atlantic. Li-Jones and Prospero (1998) present the results of size distribution (cascade impactor) measurements made on Barbados in April 1994 during which time four large African dust events occurred
(Liet al., 1996); 43% of the dust mass was less than 2.5µm aerodynamic diameter
and 18% less than 1.25µm diameter. Hardyet al. (1976) made size distribution
measurements with a 5 stage cascade impactor at three sites in the Miami area during 8–18 July 1974. Independently, aerosol measurements had begun at the University of Miami site in early 1974 (Prospero, 1999); these data show that
African dust concentrations were high during much of the Hardyet al. study,
ran-ging from 2.3–33.0µg m−3(average 14.7µg m−3). The African dust event was not
recognized as such by Hardyet al. at the time of their field study nor in the ensuing
publication although they do comment on the surprisingly high concentration of crustal material which they attribute to local sources such as road dust. The size
distribution of Fe (computed from Table I, Hardyet al. 1976) shows that 32% of
the mineral dust mass was less than 2 µm diameter and 73% was below 4 µm
diameter.
Viewed in the context of the 23 yr of African dust measurements made at the Miami site (Prospero, 1999), the dust events that occurred in 1995 and 1996 were somewhat below average. The mean dust concentrations during the months of June
and July were 11.96 and 8.84µg m−3 in 1995 and 1996, respectively. Over the
period of our entire Miami record, the June–July average was lower in only four
years: 1975, 8.75 µg m−3; 1988, 3.35 µg m−3; 1990, 6.94 µg m−3; and 1991,
8.21 µg m−3. In contrast the highest mean values for June–July were obtained
in the period 1983–1986 and in 1993 with means in the low 20’sµg m−3. Thus,
the presence of mineral dust during the summer months over the southeast United
States should be regarded as a normal situation, a point emphasized by Perryet
al. (1997) based on their more limited period of measurements, 1992–1995. The
incursion of African dust into south Florida is readily recognized by the very hazy appearance of the sky which is normally quite clear in the summer. However, in other regions of the southeast summer pollution events are common and the appearance of haze and reduced visibility due to dust could be misinterpreted as a pollution event. Dust can have a strong impact on visibility; in the Caribbean,
dust has forced the closure of airports (Liet al., 1996) because of poor visibility.
PM 2.5 AND PM 10 SUSPENDED PARTICLES IN SOUTH FLORIDA 313
and Prospero, 1972; Karyampudi and Carlson, 1988; Westphalet al., 1987, 1988;
Karyampudiet al., 1999).
Although dust concentrations can reach very high values, it seems unlikely that an African dust event in itself will cause a violation of the PM 10 or PM 2.5 standards either on the basis of the annual standard or the 24 hr standard. During the 1990’s (Prospero, 1999) the maximum dust concentration occurred on 29–30
June 1993, 121 µg m−3; if we assume that a third to a half of the dust is under
2.5µm diameter, then the PM 2.5 concentration would be about 40–60 µg m−3.
The highest dust concentration obtained over the 23 yr of measurements in Miami
was 149 µg m−3, obtained on 16–18 July 1983; this would have yielded a PM
2.5 concentration in the range of 49–74 µg m−3. Although dust concentrations
in themselves are unlikely to trigger a violation of the standard, dust in conjunc-tion with emissions from local and regional sources could conceivably present a problem. The probablity of such an occurrence is heightened by the fact that dust concentrations are highest in the summer when pollution levels are often at a maximum in the eastern states.
The EPA has the authority to discount or de-weight air quality data that are af-fected by ‘exceptional events’ caused by natural sources (Federal Register, Vol. 62, No. 138, appendix K, 2.4a; 18 July 1997). In this category the EPA (Nichols, 1996) specifically identifies volcanic eruptions, wild land fires, and high-wind events; the last category implicitly addresses the possible impact of soil dust under the assump-tion that soil dust will be derived from local sources and that a direct associaassump-tion can be made on the basis of the occurrence of high wind speeds. However African dust incurrsions are not associated with high winds. Thus, in order to account for the impact of such events, it will be necessary to develop a set of diagnostic indicators for African dust.
As previously stated, the ratio of Al/Fe in the Ft. Myers samples collected
during dust events yields a characteristic ratio of 1.8. Perry et al. also report on
the ratio of Al/Fe during a widespread African dust event over the eastern United States 23 June–7 July 1993; they obtain a ratio of 2.11. These values are close to those obtained for average crustal material (Wedepohl, 1995; Taylor and McClel-lan, 1985). While the ratio of Al/Fe alone would not be a reliable indicator of the presence of African dust, the constancy of the ratio across a network of sampling sites would serve as strong evidence of subtantial dust impacts. The constancy in
composition has been noted for other elements as well. Perry et al. (1997) and
Gatz and Prospero (1996) showed that during African dust events the ratios of a wide variety of other elements were quite constant and distinctly different from elemental ratios observed during periods when African dust was not present.
Numerous studies in North Africa and the Mediterranean region have shown that the elemental composition of African dust is relatively uniform and that the concentration of many elements is quite similar to that of average crustal mater-ial (Schutz, 1989; Molinaroli, Guerzoni, and Rampazzo, 1993; Gullu, Olmez and
first row transition metals, the concentrations of V, Cr, Mn, Fe, Co and Ni appear to
be close to average crustal values (Guieu and Thomas, 1996; Chesteret al., 1996;
Gulluet al., 1996). In PM 2.5 African dust particles Zn can be as high as ten times
greater than in average crustal material (Gulluet al., 1996; Molinaroliet al., 1993)
but in some regions it is close to average crustal abundances (Schutz, 1989; Rahn
et al., 1979; Chesteret al., 1996). In contrast, the concentrations of many elements
that are often associated with pollutant sources are often greatly increased in dust. In particular Mo, Cd, As, Sb, and Se are enriched by factors ranging from about
20 to 500 (Gulluet al., 1996) and Pb, 42 (Molinaroli et al., 1993). Nonetheless,
it is not clear to what extent these enriched elements are due to pollution inputs and how much is naturally a part of the dust matrix. The origin of the elements is important because it is well established that the anthropogenic component is much
more soluble than the soil dust component (Chesteret al., 1996).
Thus, on the basis of the limited data currently available, it seems that it should be possible to develop a consistent set of diagnostic elemental ratio indicators and particle size relationships for African dusts which, in conjunction with meteorolo-gical analyses and satellite products, could provide strong evidence of African dust impacts and the temporal and spatial coverage of such impacts.
Finally, it should be noted that African dust events are often associated with
increased concentrations of NO−
lutant sources (Savoieet al., 1989, 1992; Prosperoet al., 1995; Prospero, 1999).
Pollutants from Europe are advected over North Africa where they can mix and
react with dust raised from the surface (Denteneret al., 1996). Although the
con-centrations of pollutant species is relatively low they could be significant. For example, the presence of acid species on dust could conceivably affect the solu-bility or biological availasolu-bility of trace elements that might otherwise be rigidly locked into the mineral particle matrix. However, studies thus far do not show a strong effect. Consider the behavior of iron. African dust particles are heavily coated with iron which accounts for the characteristic red-brown color of filters samples collected during dust events. In cascade impactor samples, a considerable
portion of the nss-SO2−
4 and NO3 is found in the supramicrometer size fraction
(Li-Jones and Prospero, 1998). Even so, only about 6% of the total Fe content of
dust is easily extracted from dust samples under acid conditions (Zhuet al., 1992,
1997).
8. Conclusions
The Ft. Myers and Miami aerosol data show that African dust events can have a dramatic impact on soil aerosol concentrations in south and central Florida. In the absence of African dust, the concentration of soil aerosol was negligibly small.
The work of Perryet al. (1997) shows that the effects of African dust on air quality
PM 2.5 AND PM 10 SUSPENDED PARTICLES IN SOUTH FLORIDA 315
unlikely that African dust events in themselves will cause a violation of EPA’s new PM 2.5 standard, the concentration of dust combined with that of particles emitted from local and regional sources could challenge the standard. The presence of high concentrations of African dust will also complicate the assessment of source-receptor relationships. To that end, it will be necessary to characterize the elemental ‘signature’ of African dust and its temporal and spatial variability. The work carried out thus far, although limited, suggests that the composition of African dust and its size distribution are relatively uniform and could serve as identifying features of dust events. These conclusions could be easily verified through a coordinated study of aerosol composition in a network of sites in the Southeastern United States during the summer months.
Acknowledgements
We thank L. Custals for assistance in processing the Miami dust samples and T. Snowdon for operating and maintaining the aerosol sampling site in Miami. The aerosol study performed in the Ft. Myers region was supported by Florida Power and Light Company, Juno Beach, Florida. The Miami aerosol data were obtained with partial support from National Science Foundation grant ATM-9414812 as a part of the Atmosphere-Ocean Chemistry Experiment (AEROCE).
References Andreae, A. O.: 1996,Nature380, 389.
Arimoto, R., Duce, R. A., Savoie, D. L. and Prospero, J. M.: 1992,J. Atmos. Chem.14, 439. Arimoto, R., Duce, R. A., Ray, B. J., Ellis Jr., W. G., Cullen, J. D. and Merrill, J. T.: 1995,J. Geophys.
Res.100, 1199.
Carlson, T. N. and Prospero, J. M.: 1972,J. Appl. Meteorol.11, 283.
Chester, R., Nimmo, M. and Keyse, S.: 1996, ‘The Influence of Saharan and Middle Eastern Desert-Derived Dust on the Trace Metal Composition of Mediterranean Aerosols and Rainwaters: An Overview’, in S. Guerzoni and R. Chester (eds),The Impact of Desert Dust Across the Mediterranean, Kluwer Academic Publishers, Dordrecht, pp. 153–173.
Chiapello, I., Prospero, J. M., Herman, J. R. and Hsu, N. C.: 1999,J. Geophys. Res.104, 9277. Dentener, F. J., Carmichael, G. R., Zhang, Y., Lelieveld, J. and Crutzen, P. J.: 1996,J. Geophys. Res.
101, 22,869.
Duce, R. A.: 1995, ‘Sources, Distributions, and Fluxes of Mineral Aerosols and Their Relationship to Climate’, in R. J. Charlson and J. Heintzenberg (eds),Dahlem Workshop on Aerosol Forcing of Climate, Berlin, pp. 43–72.
Ellis Jr., W. G., Arimoto, R., Savoie, D. L., Merrill, J. T., Duce, R. A. and Prospero, J. M.: 1993,J. Geophys. Res.98, 12,673.
Federal Register: 1997, Vol. 62, No. 138, appendix K, 2.4a; 18 July 1997. Gatz, D. F. and Prospero, J. M.: 1996,Atmos. Environ.30, 3789.
Glaccum, R. A. and Prospero, J. M.: 1980,Mar. Geol.37, 295.
Guieu, C. and Thomas, A. J.: 1996, ‘Saharan Aerosols: From the Soil to the Ocean’, in S. Guerzoni and R. Chester, R. (eds),The Impact of Desert Dust Across the Mediterranean, Kluwer Academic Publishers, Dordrecht, pp. 207–216.
Gullu, G. H., Olmez, I. and Tuncel, G.: 1996, ‘Chemical Concentrations and Elements Size Distri-butions of Aerosols in the Eastern Mediterranean During Strong Dust Storms’, in S. Guerzoni, and R. Chester, (eds),The Impact of Desert Dust Across the Mediterranean, Kluwer Academic Publishers, Dordrecht, pp. 389.
Hardy, K. A., Akselsson, R., Nelson, J. W. and Winchester, J. W.: 1976,Environ. Sci. Technol.10, 176.
Henry, J. A., Portier, K. M. and Coyne, J.: 1994,The Climate and Weather of Florida, Pineapple Press, Inc., Sarasota, FL, 279 pp.
Herman, J. R., Bhartia, P. K., Torres, O., Hsu, C., Seftor, C. and Celarier, E.: 1997,J. Geophys. Res.
102, 16,911.
Husar, R. B., Prospero, J. M. and Stowe, L. L.: 1997,J. Geophys. Res.102, 16,889. Karyampudi, V. M. and Carlson, T. N.: 1988,J. Atmos. Sci.45, 3102.
Karyampudi, M. V., Palm, S. P., Reagen, J. A., Fang, H., Grant, W. B., Hoff, R. M., Moulin, C., Pierce, H. F., Torres, O., Browell, E. V. and Melfi, S. H.: 1999,Bull. Amer. Meteorological Soc.
80(6), 1045.
Li, X., Maring, H., Savoie, D., Voss, K. and Prospero, J. M.: 1996,Nature380, 416. Li-Jones, X. and Prospero, J. M.: 1998,J. Geophys. Res.103, 16073.
Maring, H., Savoie, D., Izaguirre, M., McCormick, C., Arimoto, R., Prospero, J. and Pilinis, C.: 2000,J. Geophys. Res.105, 14,677.
Merrill, J. T.: 1994,J. Geophys. Res.99, 25,881.
Molinaroli, E., Guerzoni, S. and Rampazzo, G.: 1993, ‘Contribution of Saharan Dust to the Central Mediterranean Basin’, in M. Johnson and A. Basu (eds),Processes Controlling the Composition of Clastic Sediments, Geol. Soc. Am. SP284, pp. 303–312.
Nichols, M. D.: 1996, EPA Memo:Areas Affected by PM-10 Natural Events, 30 May 1996. Olmez, I.: 1989, ‘Instrumental Neutron Activation Analysis of Atmospheric Particulate Matter’, in
Methods of Air Sampling and Analysis, 3rd ed., Lewis Publishers, Inc., pp. 142–150.
Perry, K. D., Cahill, T. A., Eldred, R. A., Dutcher, D. D. and Gill, T. E.: 1997,J. Geophys. Res.102, 11,225.
Prospero, J. M.: 1981, ‘Aeolian Transport to the World Ocean’, in C. Emiliani (ed.),The Sea, Vol. 7, The Oceanic Lithosphere, Wiley Interscience, New York, U.S.A., pp. 802–974.
Prospero, J. M.: 1996, ‘The Atmospheric Transport of Particles to the Ocean’, in V. Ittekkot, S. Honjo and P. J. Depetris (eds),Particle Flux in the Ocean, SCOPE Report 57, John Wiley & Sons Ltd., pp. 19–52.
Prospero, J. M.: 1999,J. Geophys. Res.104, 15,917.
Prospero, J. M. and Carlson, T. N.: 1972,J. Geophys. Res.77, 265. Prospero, J. M. and Nees, R. T.: 1986,Nature320, 735.
Prospero, J. M., Nees, R. T. and Uematsu, M.: 1987,J. Geophys. Res.92, 14,723.
Prospero, J. M., Schmitt, R., Cuevas, E., Savoie, D. L., Graustein, W. C., Turekian, K. K., Volz-Thomas, A., Diaz, A., Oltmans, S. J. and Levy II, H.: 1995,Geophys. Res. Lett.22, 2925. Prospero, J. M., Barrett, K., Church, T., Dentener, K., Duce, R. A., Galloway, J. N., Levy II, H.,
Moody, J. and Quinn, P.: 1996,Biogeochemistry35, 27.
Rahn, K. A., Borys, R. D., Shaw, G. E.., Schutz, L. and Jaenicke, R.: 1979, ‘Long Range Impact of Desert Aerosol on Atmospheric Chemistry: Two Examples’, in C. Morales (ed.),Saharan Dust: Mobilization, Transport and Deposition, SCOPE Vol. 14, John Wiley & Sons, Chichester, pp. 243–266.
PM 2.5 AND PM 10 SUSPENDED PARTICLES IN SOUTH FLORIDA 317
Savoie, D. L., Prospero, J. M., Oltmans, S. J., Graustein, W. C., Turekian, K. K., Merrill, J. T. and Levy II, H.: 1992,J. Geophys. Res.97, 11,575.
Schutz, L.: 1989, ‘Atmospheric Mineral Dust – Properties and Source markers’, in M. Leinen and M. Sarnthein (eds.),Paleoclimatology and Paleometeorology: Modern and Past Patterns of Global Atmospheric Transport, Kluwer Academic Publishers, Dordrecht, pp. 359–384.
Sokolik, I. N. and Toon, O. B.: 1996,Nature381, 681.
Taylor, S. R. and McLennan, S. M.: 1985,The Continental Crust: Its Composition and Evolution, Blackwells, Oxford.
Tegen, I., Hollrig, P., Chin, M., Fung, I., Jacob, D. and Penner, J.: 1997,J. Geophys. Res.102, 23,895. Wedepohl, K. H.: 1995,Geochim. Cosmochim. Acta59, 1217.
Westphal, D. L., Toon, O. B. and Carlson, T. N.: 1987,J. Geophys. Res.92, 3027. Westphal, D. L., Toon, O. B. and Carlson, T. N.: 1988,J. Atmos. Sci.45, 2145.
Wilson, R. and Spengler, J.: 1996,Particles in Our Air: Concentrations and Health Effects, Harvard University Press, 254 pp.
Zhu, X. R., Prospero, J. M., Millero, F. J., Savoie, D. L. and Brass, G. W.: 1992,Mar. Chem.38, 91. Zhu, X. R., Prospero, J. M. and Millero, F. J.: 1997,J. Geophys. Res.102, 21,297.

