See discussions, stats, and author profiles for this publication at: https://www.researchgate.net/publication/7523363
Analysis of the extension of Q-waves after
infarction with body surface map: Relationship
with infarct size
Article in International Journal of Cardiology · August 2006 DOI: 10.1016/j.ijcard.2005.08.012 · Source: PubMed
CITATIONS
11
READS
55
10 authors, including:
Some of the authors of this publication are also working on these related projects:
Development and validation of a predictive model of risk of rupture in Abdominal Aortic Aneurysm
based on morphological and biomechanical individual analysis by geometrical modeling and numerical simulation using medical imaging data View project
Juan Sanchis
University of Valencia. University Clinic Hospi…
511PUBLICATIONS 4,633CITATIONS
SEE PROFILE
Julio Nuñez Villota
University of Valencia
316PUBLICATIONS 3,829CITATIONS
SEE PROFILE
David Moratal
Universitat Politècnica de València
178PUBLICATIONS 1,427CITATIONS
SEE PROFILE
Angel Llàcer
University of Valencia
234PUBLICATIONS 2,965CITATIONS
SEE PROFILE
All content following this page was uploaded by David Moratal on 18 December 2016.
Analysis of the extension of Q-waves after infarction with body
surface map: Relationship with infarct size
B
Vicente Bodı´
a,*, Juan Sanchis
a, Marı´a S. Guillem
b, Julio Nu´n˜ez
a, Marı´a P. Lo´pez-Lereu
c,
Cristina Go´mez
a, David Moratal
b, Francisco J. Chorro
a, Jose´ Millet
b, A
` ngel Lla`cer
aa
Department of Cardiology, Clinic University Hospital, Universidad de Valencia, Blasco Iba´n˜ez 17, 46010-Valencia, Spain
b
Group of Bioengineering, Electronics and Telemedicine, Universidad Polite´cnica de Valencia, Spain
c
Unit of Cardiovascular Magnetic Resonance Imaging, ERESA, Valencia, Spain
Received 13 June 2005; received in revised form 2 August 2005; accepted 6 August 2005 Available online 20 October 2005
Abstract
Aims: We aimed to characterize the extension of Q-waves after a first ST-segment elevation myocardial infarction using body surface map (BSM) and its relationship with infarct size quantified with cardiovascular magnetic resonance imaging (CMR).
Methods and results: Thirty-five patients were studied 6 months after a first ST-segment elevation myocardial infarction (23 anterior, 12 inferior). All cases had single-vessel disease and an open artery. The extension of Q-waves was analyzed by means of a 64-lead BSM. Infarct size was quantified with CMR. Absence of Q-waves in BSM was observed in 5 patients (14%), 2 of whom (40%) had > 1 segment with transmural necrosis. Absence of Q-waves in 12-lead ECG was observed in 8 patients (23%), 7 of whom (87%) had > 1 segment with transmural necrosis. Patients with inferior infarctions (n= 12, 34%) showed a larger number of Q-waves in BSM (18T7.1 leads) than patients with anterior infarctions (n= 23, 66%; 3.7T3.6 leads;p< 0.0001). When the study group was analysed as a whole, the total number of Q-waves detected in BSM did not correlate with the number of necrotic segments (r= 0.15;p= 0.4). In anterior infarctions, a number of Q-waves > median (2 leads) was related to a higher number of necrotic segments (5.1T2.4 vs. 2T2.2 segments;p= 0.004). The same was observed in inferior infarctions (median 20 leads: 3.5T1.9 vs. 1.2T1.2 segments;p= 0.03).
Conclusion: In a stable phase after a first ST-segment elevation myocardial infarction, absence of Q-waves does not mean non-transmural necrosis. Using BSM, extension of Q-waves is much higher in inferior infarctions; a separate analysis depending on infarct location is necessary. A major BSM-derived extension of Q-waves is related to larger infarct size both in anterior and in inferior infarctions. D2005 Elsevier Ireland Ltd. All rights reserved.
Keywords:Myocardial infarction; Electrocardiography; Q-waves; Magnetic resonance imaging
1. Introduction
The electrocardiogram (ECG) remains a crucial tool in the management of myocardial infarction [1]. The inter-pretation of Q-waves in a chronic phase after infarction has been one of the more controversial signs in electrocardiog-raphy[2 – 6]. Recent works have suggested that the presence
of Q-waves in the 12-lead ECG is not a reliable marker of transmural necrosis—this suggesting that the classical distinction between transmural and non-transmural infarc-tions based on the presence of Q-waves is not acceptable [2 – 4].
Previous studies have focused on the significance of the presence of Q-waves (but not on their extension) [2,4,5]. Body surface map (BSM) allows an accurate analysis of the extension of several ECG markers in different clinical scenarios[7 – 10]. Cardiovascular magnetic resonance imag-ing (CMR) has become a reference tool for evaluatimag-ing infarct size [11 – 13]. We aimed to characterize the BSM-derived extension of Q-waves after a first ST-segment
0167-5273/$ - see front matterD2005 Elsevier Ireland Ltd. All rights reserved.
doi:10.1016/j.ijcard.2005.08.012
i
No conflict of interest exists in the present study which was supported by the Spanish Ministry of Health (RECAVA-FIS and PI030013 grants), the Spanish Society of Cardiology (Bayer-2004 grant) and a grant from Boston Scientific.
* Corresponding author. Tel./fax: +34 96 3862658. E-mail address:[email protected] (V. Bodı´) .
elevation infarction as well as its significance in terms of necrosis extent—this parameters being quantified by means of CMR.
2. Methods
2.1. Study group
We prospectively included 57 consecutive patients with a first ST-elevation myocardial infarction treated with throm-bolytic therapy within the first 6 h after chest pain onset. The inclusion criteria were (1) stable clinical course without complications during the first 6 months, (2) single-vessel disease and a patent (TIMI 3 flow and residual stenosis < 50%) infarct-related artery at the end of pre-discharge cardiac catheterization and in the sixth month, (3) no contraindications to CMR, and (4) good quality BSM recordings. We excluded 22 patients because of multivessel disease (10 cases), TIMI flow < 3 (2 cases), re-stenosis (5 cases), claustrophobia (2 cases), re-infarction (1 case) and bad quality BSM recordings (2 cases). Therefore, the final study group comprised 35 patients. The local ethics committee approved the research protocol. Informed con-sent was obtained from all subjects.
Infarct location (23 anterior, 12 inferior) was defined by the position of ST-segment elevation (I, aVL, V1 to V6
anterior; II, III, aVF inferior), the presence of an unstable lesion in angiography (in the left anterior descending artery in anterior infarctions and in the right coronary artery in inferior infarctions) and the area of regional systolic dysfunction. No case in which the culprit artery was the left circumflex artery accomplished the criteria for being included in the study group. Baseline characteristics are shown inTable 1.
2.2. Body surface map
BSM recordings were taken 180T7 days after infarction.
Briefly, the BSM system consists of a commercial 64-lead recording system for biopotential measurements (Active One, Biosemi, The Netherlands) adapted to our purposes. ECG signals were sampled at 2048 Hz with a quantization of 1AV/bit and stored on hard disk for its later processing. Electrodes were distributed non-uniformly upon the chest in a similar manner to previous works [7 – 10], with 16 electrodes on the back and 48 on the anterior side, with a higher density at positions overlaying the heart (Fig. 1).
BSM signals were processed using MATLAB 6.5 (The Mathworks Inc., Natick, Massachusetts, USA) software package. All signals were manually edited to select a 10-s time interval with the lowest noise level. Several signal conditioning algorithms were applied to this selection: (a) baseline fluctuations reduction (high pass filtering with a off frequency of 1 Hz); (b) low pass filtering (with a cut-off frequency of 60 Hz); (c) electrode cut-offset removal; and (d) 50 Hz filtering. After signal conditioning, all leads were visually inspected; patients with more than 3 useless leads were excluded from the study to assure data integrity. A useless lead was defined by visual inspection as a lead for which an averaged PQRST cycle could not be computed without error.
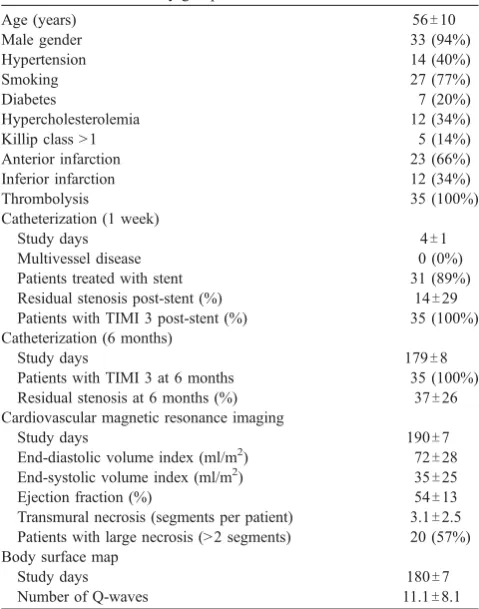
Q-waves were automatically detected and classified for each lead from averaged PQRST cycles. Q-wave peak was defined as the point of minimum voltage before the QRS peak, only for leads presenting a first negative deflection in Table 1
Characteristics of the study group
Age (years) 56T10
Patients treated with stent 31 (89%)
Residual stenosis post-stent (%) 14T29
Patients with TIMI 3 post-stent (%) 35 (100%)
Catheterization (6 months)
Study days 179T8
Patients with TIMI 3 at 6 months 35 (100%)
Residual stenosis at 6 months (%) 37T26
Cardiovascular magnetic resonance imaging
Study days 190T7
End-diastolic volume index (ml/m2) 72T28
End-systolic volume index (ml/m2) 35T25
Ejection fraction (%) 54T13
Transmural necrosis (segments per patient) 3.1T2.5
Patients with large necrosis (> 2 segments) 20 (57%)
Body surface map
Study days 180T7
Number of Q-waves 11.1T8.1
Fig. 1. Body surface map of a patient with inferior infarction. The wide scattering of ECG signal towards non-anterior electrodes may explain the large number of Q-waves detected in inferior infarctions.
the QRS complex. Q-wave onset was determined as the closest zero of the first derivative before the Q-wave peak presenting a second derivative value lower than a pre-defined threshold. Q-wave offset was pre-defined as the next zero of the first derivative after the Q-wave peak.
Q-waves were classified as pathological according to the following criteria:[1]length greater than 40 ms;[2]absolute peak value greater than 25% the absolute value of the QRS peak; and[3]Q-wave depth (integral value of the Q-wave) greater than a pre-defined threshold for each lead. Q-wave thresholds were defined as the maximum Q-wave depth present in healthy subjects by analyzing a database of 19 healthy subjects. Q-wave detection and classification was manually edited in order to assure a satisfactory perform-ance. Two independent observers reviewed Q-wave detec-tion and no differences were found between detecdetec-tions except for two cases solved by consensus. For the present study purposes, only pathological Q-waves were taken into account.
For each patient, the number of leads presenting pathological Q-waves was computed for the anterior and non-anterior zones. BSM leads were defined as belonging to the anterior or non-anterior area according to previously established criteria[7,8].
In the same session, a usual 12-lead ECG was digitally recorded using the same system and software package. Measurement for defining Q-waves was undertaken accord-ing to the Minnesota Code [14] and the number of pathological Q-waves in the 12-lead ECG was evaluated.
2.3. Cardiac catheterization
Cardiac catheterization was performed 4T1 days and
179T8 days after infarction. Percutaneous coronary
revas-cularization was carried out at pre-discharge in patients with a lumen narrowing in the infarct-related artery > 50%. The infarct-related artery was the left anterior descending artery in 23 patients and the right coronary artery in 12 patients. Only patients with TIMI 3 flow and residual stenosis < 50% at sixth-month cardiac catheterization were included in the study group.
2.4. Cardiovascular magnetic resonance imaging
CMR (Sonata Magnetom, Siemens, Erlangen, Germany) was performed 190T7 days after infarction. All images were
acquired by use of a phased-array body surface coil during breath-holds and were ECG-triggered. Cine images (true fast imaging in steady state precession (TrueFISP), repeti-tion time/echo time: 25 ms/1.6 ms, flip angle: 61-, matrix:
256128, slice thickness: 6 mm) were acquired throughout the entire left ventricle in different views (2, 3, 4-chamber and short-axis every 1 cm from the mitral valve until the apex).
Late enhancement imaging was acquired 10 min after administering 0.1 mmol/kg
gadolinium-diethilenetriamine-pentaacetic acid (Magnograf, Juste S.A.Q.F., Madrid, Spain) at a flow rate of 3 ml/s using a segmented inversion recovery TrueFISP sequence (repetition time/echo time: 2.5/ 1.1 ms, slice thickness: 6 mm, flip angle: 50-, matrix:
195192) and nullifying myocardial signal.
CMR data were analyzed by an experienced and independent observer using a custom software package (Syngo, Siemens, Erlangen, Germany) and the 17-segment model was applied[15]. End-diastolic, end-systolic volumes indexes (ml/m2) and ejection fraction (%) were obtained from short-axis views in cine images. The transmural extent of necrosis (%) was quantified (abnormal if > 50%) in the late enhancement imaging [12,13]. Large necrosis was considered in the case of > 2 segments with transmural extent of necrosis (> 50%). In our laboratory, intraobserver variability for detecting large necrosis (as defined in the present study) is 4% [16].
2.5. Statistical analysis
Continuous data were expressed as meanTstandard
deviation. The normal distribution of continuous variables was confirmed using the one-sample Kolmogorov-Smirnov test. Comparisons between groups were made by use of 2-sample t-tests for continuous data andv2tests for discrete data. Taking into account the important differences between inferior and anterior infarctions with regard to the number of Q-waves detected with BSM, a separate analysis was performed in each case. Patients were categorized according to the presence or not of a number of Q-waves > median. Sensitivity, specificity, positive and negative predictive values as well as the area under the receiver operating characteristics curve (AUC) for detecting large necrosis were determined. Correlation between the extension of Q-waves and infarct size was analyzed using the Pearson’s coefficient. SPSS statistical package (version 11.0, SPSS Inc., Chicago, Illinois, USA) was used. A value of p< 0.05 was regarded as significant.
3. Results
As a whole BSM detected 11.1T8.1 (median = 10, range
0 – 27) Q-waves per patient whereas 12-lead ECG detected 2T1.3 (median = 2, range 0 – 4) Q-waves per patient
(p< 0.0001).
Using BSM, patients with inferior infarctions (n= 12, 34%) had a larger number of Q-waves (18T7.1 leads)
than patients with anterior infarctions (n= 23, 66%; 3.7T3.6 leads; p< 0.0001). An opposite trend was
observed in the 12-lead ECG (2.3T1.2 leads in anterior
infarctions vs. 1.4T1.5 leads in inferior infarctions; p= 0.06).
(3.5T2.7 vs. 2.3T1.9 segments;p= 0.2), larger end-diastolic
(74T34 vs. 68T9 ml/m2;p= 0.4) and end-systolic volumes
(38T30 vs. 30T9 ml/m2; p= 0.3) and more depressed
ejection fraction (53T14 vs. 56T12%; p= 0.4).
3.1. Non-Q-wave infarctions
Absence of Q-waves in BSM was observed in 5 patients (14%), 2 of whom (40%) had > 1 segment with transmural necrosis (2 segments in one case and 4 segments in the other). Out of 30 patients with Q-wave (1 lead) infarction, 26 (87%) had > 1 segment with transmural necrosis (p= 0.04 vs. non-Q-wave infarctions).
Absence of Q-waves in 12-lead ECG was observed in 8 patients (23%), 7 of whom (87%) had > 1 segment with transmural necrosis. Out of 27 patients with Q-wave (1 lead) infarction, 21 (77%) had > 1 segment with transmural necrosis (p= 0.8 vs. non-Q-wave infarctions).
3.2. Relationship between Q-waves extension and infarct size
3.2.1. 12-lead ECG
The total number of Q-waves detected in 12-lead ECG predicted the presence of large necrosis. A number of Q-waves in 12 lead-ECG > 2 (median) showed sensitiv-ity = 80%, specificsensitiv-ity = 80%, positive predictive value= 84%, negative predictive value = 75% and AUC with 95% confidence intervals = 0.81 [0.66 – 0.97] for identifying large necrosis. The number of Q-leads detected in 12-lead ECG correlated with the number of segments with transmural extent of necrosis (r= 0.48;p= 0.004).
3.2.2. BSM in the whole group
When the study group was analyzed as a whole, the total number of Q-waves detected in BSM failed to predict large necrosis (AUC with 95% confidence intervals = 0.65 [0.46 – 0.84]). The total number of Q-waves detected in BSM did not correlate with the number of segments with transmural extent of necrosis (r= 0.15;p= 0.4). This was probably due to the large difference in Q-waves extension between anterior and inferior infarctions.
3.2.3. BSM in anterior infarctions
When anterior infarctions were analyzed separately (n= 23), the extension of Q-waves in BSM was a good predictor of the presence of large necrosis (Table 2). A significant correlation was observed between the number of Q-waves and the number of segments with transmural extent of necrosis (r= 0.52;p= 0.01).
Patients with anterior infarctions and a number of Q-waves in the anterior area > 2 (median),n= 11, had a greater number of segments with transmural extent of necrosis (5.1T2.4 vs. 2T2.2 segments;p= 0.004) than patients with
anterior infarction and a number of Q-waves in the anterior area > 2 (n= 12).
3.2.4. BSM in inferior infarctions
When inferior infarctions were analyzed separately (n= 12), the extension of Q-waves in BSM was a good predictor of the presence of large necrosis (Table 2).
Patients with inferior infarctions and a number of Q-waves in the inferior area > 20 (median),n= 6, had a greater number of segments with transmural extent of necrosis (3.5T1.9 vs. 1.2T1.2 segments;p= 0.03) than patients with
inferior infarctions and a number of Q-waves in the inferior area > 20 (n= 6). Again, a significant correlation was observed between the number of Q-waves and the number of segments with transmural extent of necrosis (r= 0.65; p= 0.02).
4. Discussion
The main findings of the present study are (a) BSM-derived extension of Q-waves is greater in the case of inferior infarctions, (b) transmural necrosis is frequently present in non-Q-wave infarctions, (c) Q-waves extension is related to infarct size.
In order to avoid confusing factors (previous infarctions, multivessel disease, residual ischemia, re-infarction, etc.) which could alter the interpretation of ECG and BSM data, and to assure an adequate epicardial perfusion (which permitted myocardial recovery in the case of residual viability) we included a homogeneous study group com-posed by patients with a first MI, single-vessel disease and TIMI 3 flow both in the first week and in the sixth month after MI.
4.1. Anterior and inferior infarctions
The total BSM-derived extension of Q-waves was bigger in inferior than in anterior infarctions. This could be explained by two facts:
(1) The analysis of usually silent zones (right ventricle, posterior wall) may increase the number of Q-waves in inferior infarctions [8]. However, inferior and Table 2
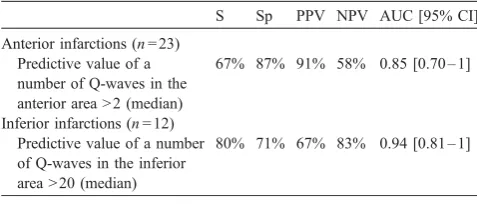
Predictive value of body surface map-derived number of Q-waves for detecting large necrosis
S Sp PPV NPV AUC [95% CI]
Anterior infarctions (n= 23) Predictive value of a number of Q-waves in the anterior area > 2 (median)
67% 87% 91% 58% 0.85 [0.70 – 1]
Inferior infarctions (n= 12) Predictive value of a number of Q-waves in the inferior area > 20 (median)
80% 71% 67% 83% 0.94 [0.81 – 1]
AUC[95% CI] = area under the receiver operating characteristics curve with 95% confidence intervals. NPV = negative predictive value. PPV = positive predictive value. S = sensitivity. Sp = Specificity.
anterior infarctions showed a similar infarct size. Therefore, the greater number of Q-waves detected in inferior with respect to anterior infarctions cannot be explained solely by the presence of a larger infarcted area.
(2) The main reason of the imbalance of BSM-derived extension of Q-waves depending on infarct location probably relies on the scattering of ECG signal in a wider area in the case of inferior infarctions. Heart anatomy and the BSM leads setting provoke that, in anterior infarctions, the propagation of ECG signal focuses on a few leads located in the anterior wall close to the infarcted area, whereas in the case of inferior infarctions a wider signal propagation takes place (Figs. 1 and 2) facilitating the spreading of the same ECG observation in numerous leads. A practical application of this finding is that for the analysis of Q-waves extension by means of BSM a separate evaluation of anterior and inferior infarctions is advisable and individualized thresholds of abnormality (number of Q-waves) should be established depending on infarct location.
4.2. Non-Q-wave infarctions
In our study group, presence of non-Q-wave infarction was not a good predictor of non-transmural necrosis. In the case of 12-lead ECG, 77% of patients with and 87% of patients without Q-waves had at least 1 segment with transmural necrosis. Though BSM suggested a lower probability of transmural necrosis in non-Q-wave infarc-tions (40% vs. 87% in the case of Q-wave infarcinfarc-tions), the high prevalence of transmural necrosis in non-Q-wave infarctions lessens significance to this finding.
Several authors studying 12-lead ECG [2,4] and BSM [17]have found few differences between Q-wave and
non-Q-wave infarctions. Recent works, using 12-lead ECG and CMR, obtained similar results to ours. Moon et al. [2] detected Q-waves in 28% of subendocardial and in 29% of transmural infarctions. Kaandrop et al. [4] analyzed 69 patients with a previous infarction; in this series, 67% of patients who had a Q-wave infarction and 43% of those who had a non-Q-wave infarction showed at least 1 segment with transmural necrosis. Therefore, current data suggest that the usefulness of the distinction between Q-wave and non-Q-Q-wave infarctions, if any, cannot rely on the presence or not of transmural necrosis since this finding appears frequently in non-Q-wave infarctions whereas areas of non-transmural necrosis within the infarcted territory are present in almost all cases with Q-wave infarctions [3].
4.3. Extension of Q-waves and infarct size
Whereas the presence of Q-waves is not a reliable marker of transmural necrosis, it seems to be related to infarct size [2 – 4]. Both Moon et al. [2] and Kaandrop et al. [4] concluded that the extent (rather than the presence) of transmural necrosis was the best predictor of Q-wave infarction in 12-lead ECG.
Previous works have addressed the significance of Q-waves but the impact of the extension of this ECG marker on infarct size has not been widely investigated [7]. BSM yields an ideal tool for the analysis of the extension of several ECG markers in different scenarios [7 – 10]. Sim-ilarly, CMR has become a standard for evaluating infarct size [11 – 13]. We focused on the significance of the extension of Q-waves in patients with a previous ST-segment elevation infarction. Our results indicate that, in a homogeneous setting of patients in whom puzzling factors like multiple infarctions or residual ischemia had been excluded, an accurate interpretation of the extension of Q-waves (using BSM) is in accordance with the classical and
Fcommon sense_ thought that the larger the number of
Q-waves the greater the infarct size [3].
BSM allowed an accurate characterization of Q-waves extension and it is an attractive tool especially in the investigational field. However, this is a time-consuming and not routinely used technique whereas 12-lead ECG afforded comparable results. Therefore, for the present study purpose, it does not seem necessary to include BSM in the daily armamentarium for evaluating post-infarction patients.
4.4. Limitations
The results obtained can only be generalized to patients with characteristics similar to our own. Less severe inclusion criteria would have increased sample size and information about patients with multivessel disease, TIMI flow < 3 or left circumflex artery narrow would be available.
4.5. Conclusions
In a stable phase after ST-segment elevation infarction, BSM-derived extension of Q-waves is greater in inferior infarctions mainly because of a wider propagation of ECG signal; a separate analysis of anterior and inferior infarctions is advisable. The presence of Q-waves is barely useful for distinguishing between transmural and non-transmural necrosis. A major extension of Q-waves, both in BSM and 12-lead ECG, is related to a larger necrotic area. In the era of high-resolution imaging techniques, ECG contains interesting information for a non-invasive and inexpensive prediction of infarct size.
References
[1] Zimetbaum PJ, Josephson ME. Use of the electrocardiogram in acute myocardial infarction. N Engl J Med 2003;348:933 – 40.
[2] Moon JC, Pe´rez de Arenaza D, Elkington AG, et al. The pathologic basis of Q-wave and non-Q-wave myocardial infarction. A cardiovas-cular magnetic resonance study. J Am Coll Cardiol 2004;44:554 – 60. [3] Arai AE, Hirsch GA. Q-wave and non-Q-wave myocardial infarctions through the eyes of cardiac magnetic resonance imaging. J Am Coll Cardiol 2004;44:561 – 3.
[4] Kaandrop TA, Bax JJ, Lamb HJ, et al. Which parameters on magnetic resonance imaging determine Q-waves on the electrocardiogram? Am J Cardiol 2005;95:925 – 9.
[5] Bodı´ V, Sanchis J, Lla´cer A, et al. ST-segment elevation on Q-leads at rest and during exercise. Relationship with myocardial viability and left ventricular remodeling within the first six months postinfarction. Am Heart J 1999;137:1107 – 15.
[6] Bodı´ V, Sanchis J, Lla´cer A. Stress-induced ST-segment elevation on Q leads after myocardial infarction. Eur Heart J 2001;22:182 – 3.
[7] Tonooka I, Kubota I, Watanabe Y, et al. Isointegral analysis of body surface maps for the assessment of location and size of myocardial infarction. Am J Cardiol 1983;52:1174 – 80.
[8] Menown IB, Allen J, McAnderson JM, et al. Early diagnosis of right ventricular or posterior infarction associated with inferior wall left ventricular acute myocardial infarction. Am J Cardiol 2000;85: 934 – 8.
[9] Menown IB, Allen J, McAnderson JM, et al. ST depression only on the initial 12-lead ECG: early diagnosis of acute myocardial infarction. Eur Heart J 2001;22:218 – 27.
[10] Boudik F, Anger Z, Aschermann M, et al. Dipyridamole body surface potential mapping: noninvasive differentiation of syndrome X from coronary artery disease. J Electrocardiol 2002;35:181 – 91.
[11] Lauerma K, Niemi P, Ha¨nninen H, et al. Multimodality MR imaging assesment of myocardial viability: combination of first-pass and late contrast enhancement to wall motion dynamics and comparison with FDG PET-initial experience. Radiology 2000;217:729 – 36.
[12] Bodı´ V, Sanchis J, Lo´pez-Lereu MP, et al. Usefulness of a comprehensive cardiovascular magnetic resonance imaging assess-ment for predicting recovery of left ventricular wall motion in the setting of myocardial stunning. J Am Coll Cardiol 2005;46:1747 – 52. [13] Pohost GM, Hung L, Doyle M. Clinical use of cardiovascular
magnetic resonance. Circulation 2003;108:647 – 53.
[14] Prineas RJ, Crow RS. The Minnesota code manual of
electrocardio-graphic findings. Littleton, MA’ John Wright & Sons Ltd., 1982.
p. 16 – 48.
[15] Cerqueira MD, Weissman NJ, Dilsizian V, et al. Standardized myocardial segmentation and nomenclature for tomographic imaging of the heart. Circulation 2002;105:539 – 42.
[16] Bodı´ V, Sanchis J, Lla`cer A, et al. Significance of exercise-induced ST segment elevation in Q leads in patients with a recent myocardial infarction and an open infarct related artery. Analysis with angiog-raphy, intracoronary myocardial contrast echocardiography and cardiac magnetic resonance. Int J Cardiol 2005;6:164 – 74.
[17] Montague TJ, Johnstone DE, Spencer A, et al. Non-Q-wave acute myocardial infarction: body surface potential map and ventriculo-graphic patterns. Am J Cardiol 1986;58:1173 – 80.
V. Bodı´ et al. / International Journal of Cardiology 111 (2006) 399 – 404 404