27
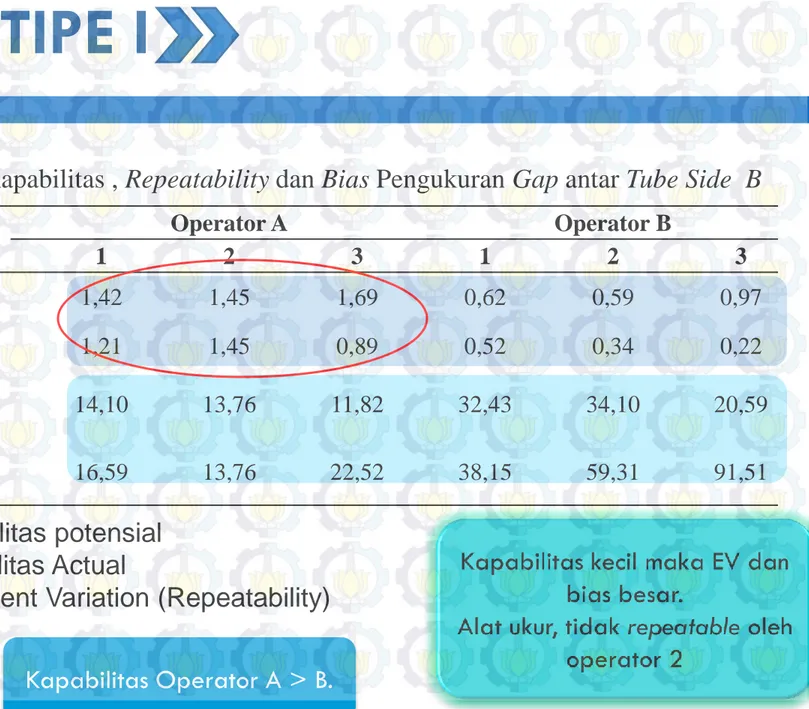
Cg = Kapabilitas potensial
Cgk = Kapabilitas Actual
EV = Equitment Variation (Repeatability)
Tabel Nilai Kapabilitas , Repeatability dan Bias Pengukuran Gap antar Tube Side B
Operator A
Operator B
1
2
3
1
2
3
Cg
1,42
1,45
1,69
0,62
0,59
0,97
Cgk
1,21
1,45
0,89
0,52
0,34
0,22
EV (%)
14,10
13,76
11,82
32,43
34,10
20,59
EV dan
Bias (%)
16,59
13,76
22,52
38,15
59,31
91,51
MSA TIPE I
Kapabilitas Operator A > B.
28
Source
P-value (Side A)
P-value (Side B)
Part
0,000
0,003
Operator
0,264
0,591
Interaksi
0,460
0,000
ANOVA Dua Arah Hasil Pengukuran Gap antar Tube
Persentase Study Variation, Tolerance dan Number of Distinct Category
Variabel
Sumber
Percent of Study
Variation
Percent of
Tolerance
Number of
distinct
category
Side A (X
1
)
Gage R&R
11,33
15,64
12
Repeatability
11,25
15,53
Reproducibility
1,34
1,85
Side B (X
2
)
Gage R&R
12,54
15,87
11
Repeatability
10,37
13,13
Reproducibility
7,05
8,93
MSA acceptable
dengan syarat
MSA TIPE II
Operator Mampu
Membedakan
Ukuran part dengan
29
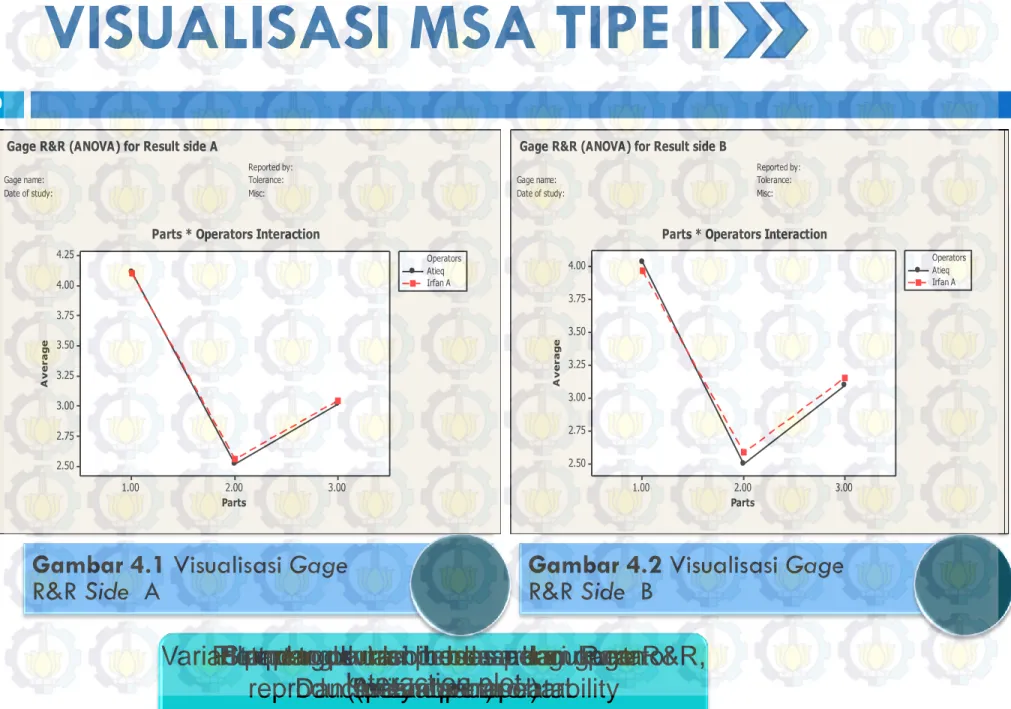
Gambar 4.1 Visualisasi Gage
R&R Side A
Gambar 4.2 Visualisasi Gage
R&R Side B
Part-to-Part Reprod Repeat Gage R&R 100 50 0 P e r c e n t % Contribution % Study Var % Tolerance 3.00 2.00 1.00 3.00 2.00 1.00 0.100 0.075 0.050 Parts S a m p le S tD e v _ S=0.07045 UC L=0.10495 LC L=0.03595 A tieq Irfan A 3.00 2.00 1.00 3.00 2.00 1.00 4.2 3.6 3.0 Parts S a m p le M e a n __ X=3.222 UC L=3.270 LC L=3.175 A tieq Irfan A 3.00 2.00 1.00 4.0 3.2 2.4 Parts Irfan A A tieq 4.0 3.2 2.4 Operators 3.00 2.00 1.00 4.2 3.6 3.0 Parts A v e r a g e Atieq Irfan A Operators
Gage name: POBREP 1 Date of study: 14 Jan-14 Apr 2013
Reported by: Atieq & Irfan A. Tolerance: Misc:
Components of Variation
S Chart by Operators
Xbar Chart by Operators
Result side B by Parts
Result side B by Operators
Parts * Operators Interaction
Gage R&R (ANOVA) for Result side B
Part-to-Part Reprod Repeat Gage R&R 100 50 0 P e r c e n t % Contribution % Study Var % Tolerance 3.00 2.00 1.00 3.00 2.00 1.00 0.12 0.08 0.04 Parts S a m p le S tD e v _ S=0.08896 UC L=0.13253 LC L=0.04539 A tieq Irfan A 3.00 2.00 1.00 3.00 2.00 1.00 4.2 3.6 3.0 Parts S a m p le M e a n __ X=3.224 UC L=3.284 LC L=3.163 A tieq Irfan A 3.00 2.00 1.00 4.0 3.2 2.4 Parts Irfan A A tieq 4.0 3.2 2.4 Operators 3.00 2.00 1.00 4.2 3.6 3.0 Parts A v e r a g e Atieq Irfan A Operators
Gage name: POBREP 1 Date of study: 14 Jan-14 Apr 2013
Reported by: Atieq & Irfan A. Tolerance: Misc:
Components of Variation
S Chart by Operators
Xbar Chart by Operators
Result side A by Parts
Result side A by Operators
Parts * Operators Interaction
Gage R&R (ANOVA) for Result side A
Varian part to part lebih besar dari gage R&R,
reproducibility dan repeatability
Standar deviasi proses pengukuran
Dan spesial x-bar chart
Plot pengukuran berdasarkan Part
(mean part)
Plot pengukuran berdasarkan operator
(mean operator)
Interaction plot
VISUALISASI MSA TIPE II
Part-to-Part Reprod Repeat Gage R&R 100 80 60 40 20 0 P e rc e n t % Contribution % Study Var Gage name: Date of study: Reported by: Tolerance: Misc:
Components of Variation
Gage R&R (ANOVA) for Result side A
Part-to-Part Reprod Repeat Gage R&R 100 80 60 40 20 0 P e rc e n t % Contribution % Study Var Gage name: Date of study: Reported by: Tolerance: Misc:
Components of Variation
Gage R&R (ANOVA) for Result side B
3.00 2.00 1.00 3.00 2.00 1.00 0.125 0.100 0.075 0.050 Parts S a m p le S tD e v _ S=0.08896 UCL=0.13253 LCL=0.04539 Atieq Irfan A 3.00 2.00 1.00 3.00 2.00 1.00 4.0 3.5 3.0 2.5 Parts S a m p le M e a n __ X=3.224 UCL=3.284 LCL=3.163 Atieq Irfan A Gage name: Date of study: Reported by: Tolerance: Misc:
S Chart by Operators
Xbar Chart by Operators
Gage R&R (ANOVA) for Result side A
3.00 2.00 1.00 3.00 2.00 1.00 0.125 0.100 0.075 0.050 Parts S a m p le S tD e v _ S=0.07045 UCL=0.10495 LCL=0.03595 Atieq Irfan A 3.00 2.00 1.00 3.00 2.00 1.00 4.0 3.5 3.0 2.5 Parts S a m p le M e a n __ X=3.222 UCL=3.270 LCL=3.175 Atieq Irfan A Gage name: Date of study: Reported by: Tolerance: Misc:
S Chart by Operators
Xbar Chart by Operators
Gage R&R (ANOVA) for Result side B
3.00 2.00 1.00 4.5 4.0 3.5 3.0 2.5 Parts Gage name: Date of study: Reported by: Tolerance: Misc:
Result side A by Parts
Gage R&R (ANOVA) for Result side A
3.00 2.00 1.00 4.25 4.00 3.75 3.50 3.25 3.00 2.75 2.50 Parts Gage name: Date of study: Reported by: Tolerance: Misc:
Result side B by Parts
Gage R&R (ANOVA) for Result side B
Irfan A Atieq 4.5 4.0 3.5 3.0 2.5 Operators Gage name: Date of study: Reported by: Tolerance: Misc:
Result side A by Operators
Gage R&R (ANOVA) for Result side A
Irfan A Atieq 4.25 4.00 3.75 3.50 3.25 3.00 2.75 2.50 Operators Gage name: Date of study: Reported by: Tolerance: Misc:
Result side B by Operators
Gage R&R (ANOVA) for Result side B
3.00 2.00 1.00 4.00 3.75 3.50 3.25 3.00 2.75 2.50 Parts A v e ra g e Atieq Irfan A Operators Gage name: Date of study: Reported by: Tolerance: Misc:
Parts * Operators Interaction
Gage R&R (ANOVA) for Result side B
3.00 2.00 1.00 4.25 4.00 3.75 3.50 3.25 3.00 2.75 2.50 Parts A v e ra g e Atieq Irfan A Operators Gage name: Date of study: Reported by: Tolerance: Misc:
Parts * Operators Interaction
Gage R&R (ANOVA) for Result side A
30
Variabel
Korelasi
P-value
Part 1
Side A
0,183
0,259
Side B
Part 2
Side A
0,336
0,034*
Side B
Part 3
Side A
0,159
0.327
Side B
Part 1, 2 dan 3
Side A
0.981
0.034*
Side B
Variabel
Nilai
Distribusi
Part 1
0,600
Bivariat normal
Part 2
0,650
Bivariat normal
Part 3
0.375
Tidak bivariat normal
Nilai t Uji Distribusi Bivariat Normal
Korelasi Side A dan Side B Gap antar Tube
Semua part memiliki
korelasi
berdasarkan
kenyataan di
Lapangan
Data Berdistribusi
bivariat normal
31
X
A
Z
1
UCL
A
BSA
z
1
LCL
A
BSB
z
1
Hasil Gage study Bivariat dengan Pendekatan POBREP
Variabel
Sumber Varian
Percent of Study
Variation
Percent of
Tolerance
Number of
distinct category
Z
1
Gage R&R
11,33
15,64
12
Repeatability
11,25
15,53
Reproducibility
1,34
1,85
Z
2
Gage R&R
9,45
12,45
14
Repeatability
8,40
11,07
Reproducibility
4,32
5,70
1
1
0
1
A
1
1
0
1
1
A
Source
P-value Z
1
P-value Z
2
Part
0,000
0,001
Operator
0,264
0,481
Interaksi
0,460
0,003
MSA BIVARIAT POBREP
Operator sudah dapat
membedakan ukuran part
32
P art-to-P art Reprod Repeat G age R&R 100 50 0 P e rc e n t % Contribution % Study Var % Tolerance 3.00 2.00 1.00 3.00 2.00 1.00 0.12 0.08 0.04 P ar ts S a m p le S tD e v _ S=0.08896 U C L=0.13253 LC L=0.04539 O perator A O perator B 3.00 2.00 1.00 3.00 2.00 1.00 4.2 3.6 3.0 P ar ts S a m p le M e a n __ X=3.224 U C L=3.284 LC L=3.163 A tieq Irfan A 3.00 2.00 1.00 4.0 3.2 2.4 P ar ts Irfan A A tieq 4.0 3.2 2.4 O per ator s 3.00 2.00 1.00 4.2 3.6 3.0 P ar ts A v e ra g e Atieq Irfan A OperatorsGage name: POBREP 1 Date of study: 14 Jan-14 Apr 2013
Reported by: Atieq & Irfan A. Tolerance: Misc:
Components of Variation
S Chart by Operators
Xbar Chart by Operators
POBREP A by Parts
POBREP A by Operators
Parts * Operators Interaction
Gage R&R (ANOVA) for POBREP A
P art-to-P art Reprod Repeat G age R&R 100 50 0 P e rc e n t % Contribution % Study Var % Tolerance 3.00 2.00 1.00 3.00 2.00 1.00 0.20 0.15 0.10 P ar ts S a m p le S tD e v _ S=0.1248 U C L=0.1860 LC L=0.0637 O perator A O perator B 3.00 2.00 1.00 3.00 2.00 1.00 8.4 7.2 6.0 P ar ts S a m p le M e a n __ X=6.446 U C L=6.531 LC L=6.361 A tieq Irfan A 3.00 2.00 1.00 8.0 6.5 5.0 P ar ts Irfan A A tieq 8.0 6.5 5.0 O per ator s 3.00 2.00 1.00 8.4 7.2 6.0 P ar ts A v e ra g e Atieq Irfan A Operators
Gage name: POBREP 1 Date of study: 14 Jan-14 Apr 2013
Reported by: Atieq & Irfan A. Tolerance: Misc:
Components of Variation
S Chart by Operators
Xbar Chart by Operators
POBREP B by Parts
POBREP B by Operators
Parts * Operators Interaction
Gage R&R (ANOVA) for POBREP B
Component Of Variation Plot
33
33
Part-to-Part Reprod Repeat Gage R&R 100 80 60 40 20 0 P e rc e n t % Contribution % Study Var Gage name: Date of study: Reported by: Tolerance: Misc:Components of Variation
Gage R&R (ANOVA) for Z1
Part-to-Part Reprod Repeat Gage R&R 100 80 60 40 20 0 P e rc e n t % Contribution % Study Var Gage name: Date of study: Reported by: Tolerance: Misc:
Components of Variation
Gage R&R (ANOVA) for Z2
S-chart dan x-bar Chart
34
34
3.00 2.00 1.00 3.00 2.00 1.00 0.125 0.100 0.075 0.050 Parts S a m p le S tD e v _ S=0.08896 UCL=0.13253 LCL=0.04539 Atieq Irfan A 3.00 2.00 1.00 3.00 2.00 1.00 4.0 3.5 3.0 2.5 Parts S a m p le M e a n __ X=3.224 UCL=3.284 LCL=3.163 Atieq Irfan A Gage name: Date of study: Reported by: Tolerance: Misc:S Chart by Operators
Xbar Chart by Operators
Gage R&R (ANOVA) for Z1
3.00 2.00 1.00 3.00 2.00 1.00 0.20 0.15 0.10 0.05 Parts S a m p le S tD e v _ S=0.1248 UCL=0.1860 LCL=0.0637 Atieq Irfan A 3.00 2.00 1.00 3.00 2.00 1.00 8 7 6 5 Parts S a m p le M e a n __ X=6.446 UCL=6.531 LCL=6.361 Atieq Irfan A Gage name: Date of study: Reported by: Tolerance: Misc:
S Chart by Operators
Xbar Chart by Operators
Gage R&R (ANOVA) for Z2
Hasil Pengukuran Berdasarkan Part
35
35
3.00 2.00 1.00 8.5 8.0 7.5 7.0 6.5 6.0 5.5 5.0 Parts Gage name: Date of study: Reported by: Tolerance: Misc:Z2 by Parts
Gage R&R (ANOVA) for Z2
3.00 2.00 1.00 4.5 4.0 3.5 3.0 2.5 Parts Gage name: Date of study: Reported by: Tolerance: Misc:
Z1 by Parts
Gage R&R (ANOVA) for Z1
Hasil Pengukuran Berdasarkan
Operator
36
36
Irfan A Atieq 4.5 4.0 3.5 3.0 2.5 Operators Gage name: Date of study: Reported by: Tolerance: Misc:Z1 by Operators
Gage R&R (ANOVA) for Z1
Irfan A Atieq 8.5 8.0 7.5 7.0 6.5 6.0 5.5 5.0 Operators Gage name: Date of study: Reported by: Tolerance: Misc:
Z2 by Operators
Gage R&R (ANOVA) for Z2
Plot Interaksi
37
37
3.00 2.00 1.00 8.5 8.0 7.5 7.0 6.5 6.0 5.5 5.0 Parts A v e ra g e Atieq Irfan A Operators Gage name: Date of study: Reported by: Tolerance: Misc:Parts * Operators Interaction
Gage R&R (ANOVA) for Z2
3.00 2.00 1.00 4.25 4.00 3.75 3.50 3.25 3.00 2.75 2.50 Parts A v e ra g e Atieq Irfan A Operators Gage name: Date of study: Reported by: Tolerance: Misc: