MUNICIPAL SOLID WASTE MANAGEMENT OF
INDIGENOUS COMMUNITY IN KAMPUNG KUALA
PANGSUN, HULU LANGAT, SELANGOR
SITI NUR AZLINDA SUHADA BINTI MOHAMAD SABRI
FACULTY OF SCIENCE
UNIVERSITY OF MALAYA
KUALA LUMPUR
2015
brought to you by CORE
View metadata, citation and similar papers at core.ac.uk
MUNICIPAL SOLID WASTE MANAGEMENT OF
INDIGENOUS COMMUNITY IN KAMPUNG KUALA
PANGSUN, HULU LANGAT, SELANGOR
SITI NUR AZLINDA SUHADA BINTI MOHAMAD SABRI
DESSERTATION SUBMITTED IN PARTIAL
FULFILMENT OF THE REQUIREMENTS FOR THE
DEGREE OF MASTER OF TECHNOLOGY
(ENVIRONMENTAL MANAGEMENT)
FACULTY OF SCIENCE
UNIVERSITY OF MALAYA
KUALA LUMPUR
ABSTRACT
With the enactment of Solid Waste and Public Cleansing Management (SWPCM) Act, all solid wastes from household and business are subjected to the Act. However, information on municipal solid waste management of rural communities, especially Orang Asli is inadequate due to lack of research studies. The objectives of the study are to measure amount, types and composition of waste generated, to assess current solid waste management practices and the impact towards the environment, to identify the involvement of Majlis Perbandaran Kajang (MPKj) and Jabatan Kemajuan Orang Asli Malaysia (JAKOA), and to propose for better solid waste management practices. Waste collection, estimation and characterization were conducted in Kampung Kuala Pangsun involving 75 houses. Survey was conducted to assess their solid waste management practices and the impact towards the environment. Also, MPKj and JAKOA were interviewed to recognize their involvement. SPSS 20 software program was used for various statistical analyses. The study found that the daily average amount of solid waste generated per household is 0.57 kg, with per capita weight of 0.12 kg. Among the types of waste being generated are kitchen waste, plastic or high-density polyethylene (HDPE) and box paper. Most of the Orang Asli stores their household waste in plastic bags and choose for open burning to dispose the household wastes. Throughout the study, it was found that their solid waste management practices affect the environment as well as their lives. The study also found that MPKj and JAKOA have indirect and overlapped responsibility in term of providing solid waste management services, education and awareness to the Orang Asli. To improve their solid waste management practices, Orang Asli should be encouraged to store their household waste in plastic bin. Moreover, more communal bins should be provided to prevent open burning and open dumping.
ABSTRAK
Berikutan pewartaan Akta Pengurusan Sisa Pepejal dan Pembersihan Awam, semua sisa pepejal dari rumah kediaman dan bangunan perniagaan, adalah tertakluk kepada Akta ini. Walaubagaimanapun, maklumat pengurusan sisa pepejal oleh masyarakat luar bandar terutama Orang Asli adalah tidak mencukupi kerana kekurangan kajian tentangnya. Tujuan kajian ini dilakukan adalah untuk mengenalpasti kuantiti, jenis dan komposisi sisa yang dihasilkan oleh penduduk Kampung Kuala Pangsun, menilai amalan pengurusan sisa dan kesannya terhadap alam sekitar, mengkaji penglibatan MPKj dan JAKOA dalam pengurusan sisa, serta mencadangkan amalan pengurusan sisa yang lebih baik. Sisa yang dikumpul daripada 75 buah kediaman Orang Asli di Kampung Kuala Pangsun, ditentukan jenisnya dan kuantitinya. Kaji selidik dijalankan untuk menilai amalan pengurusan sisa mereka dan kesannya kepada alam sekitar. Beberapa pegawai MPKj dan JAKOA ditemuramah untuk mengetahui peranan mereka dalam isu ini. Program perisian SPSS 20 digunakan bagi tujuan analisis secara statistik. Kajian mendapati purata sampah harian yang dihasilkan oleh setiap rumah adalah 0.57 kg, dengan penghasilan per kapita sebanyak 0.12 kg. Antara jenis sisa yang dihasilkan adalah sisa dapur, plastik atau HDPE dan kadbod. Kebanyakan Orang Asli mengumpul sisa mereka di dalam beg plastik, kemudian membakarnya secara terbuka. Kajian juga mendapati amalan pengurusan sisa mereka memberi kesan terhadap alam sekitar dan kehidupan mereka sendiri. Peranan MPKj dan JAKOA dalam menyediakan kemudahan, pendidikan dan kesedaran pengurusan sisa kepada masyarakat Orang Asli adalah secara tidak langsung dan terdapat pertindihan pelaksanaan tanggungjawab. Justeru, bagi menambahbaik amalan pengurusan sisa mereka, Orang Asli perlu dinasihatkan dan digalakkan untuk mengumpulkan sampah tersebut di dalam tong sampah. Selain itu, lebih banyak tong sampah komuniti perlu disediakan untuk menghalang pembuangan dan pembakaran sisa secara terbuka.
ACKNOWLEDGEMENT
I would like to express my gratitude to God for awarding me the patience to work on this research. Thank you very much to Dr. Firuza Begham Mustafa and Dr. Fauziah Shahul Hamid for their guidance. I am also thankful to the Majlis Agama Islam Perlis (MAIP) for their financial contribution. My appreciation also goes to Kamala, Azlina and Syafiq, who have assisted me during the data collection process, as well as, my parents for their continuing support. Not to forget, thank you to the residents of Kampung Kuala Pangsun, JAKOA, MPKj, PPSPPA, KPKT and those who directly or indirectly helped me to carry out the research.
TABLE OF CONTENTS
ORIGINAL LITERARY WORK DECLARATION ii
ABSTRACT iii ABSTRAK iv ACKNOWLEDGEMENT v TABLE OF CONTENTS vi LIST OF FIGURES ix LIST OF TABLES x
LIST OF SYMBOLS AND ABBREVIATIONS xi
LIST OF APPENDICES xiv
CHAPTER 1: INTRODUCTION
1.1 Municipal Solid Waste in Malaysia 1
1.2 Problem Statement 3
1.3 Objectives 4
CHAPTER 2: LITERATURE REVIEW
2.1 Background Information on Orang Asli 5
2.2 Description of Solid Waste 6
2.3 Municipal Solid Waste Generation 6
2.3.1 Municipal Solid Waste Generation in Developing Countries 7 2.3.2 Municipal Solid Waste Generation in Asian Countries 9 2.3.3 Municipal Solid Waste Generation in Southeast Asia Countries 10
2.3.4 Municipal Solid Waste Generation in Malaysia 11
2.4 Municipal Solid Waste Composition 14
2.4.2 Municipal Solid Waste Composition in Asian Countries 16 2.4.3 Municipal Solid Waste Composition in Southeast Asia Countries 18
2.4.4 Municipal Solid Waste Composition in Malaysia 21
2.5 Municipal Solid Waste Storage and Collection 21
2.6 Municipal Solid Waste Disposal 22
2.7 Municipal Solid Waste Management 23
2.7.1 Municipal Solid Waste Management in Developing Countries 25 2.7.2 Municipal Solid Waste Management in Asian Countries 29 2.7.3 Municipal Solid Waste Management in Southeast Asia Countries 32
2.7.4 Municipal Solid Waste Management in Malaysia 34
2.8 Municipal Solid Waste Management Challenge 37
2.8.1 Municipal Solid Waste Management Challenge in Developing 38 Countries
2.8.2 Municipal Solid Waste Management Challenge in Asia Countries 39 2.8.3 Municipal Solid Waste Management Challenge in Southeast Asia 40
Countries
2.8.4 Municipal Solid Waste Management Challenge in Malaysia 41 2.9 Recycling As a Sustainable Solid Waste Management Approach 42
CHAPTER 3: METHODOLOGY
3.1 Study Area 45
3.2 Sample Collection and Segregation 46
3.3 Waste Generation Estimation 48
3.4 Interviews, Questionnaires, and On-Site Observation 49
CHAPTER 4: RESULTS AND DISCUSSIONS
4.1 Municipal Solid Waste Generation and Composition 52
4.2 Current MSW Management Practices and The Impact Towards 54 The Environment
4.3 Involvement of MPKj and JAKOA 59
4.4 Suggestions for Better Municipal Solid Waste Management Practices 61
4.5 Data Collection 64
4.6 Demographic Information 64
4.7 Correlation Between Monthly Household Income 67
And Waste Generation
4.8 Correlation Between Waste Generation And Population 68
4.9 Correlation Between Kitchen Waste Generation 69
And Household Monthly Income
CHAPTER 5: CONCLUSIONS 71
LIST OF FIGURES
Figure 2.1 Comparison of MSW composition of developed countries 16 (United States and European Union) against
developing countries
Figure 2.2 The system model of MSW management system 24
Figure 3.1 Wastes collected are segregated and classified 47
Figure 3.2 Weight and volume of the waste is determined 48
Figure 3.3 Wastes are collected from the household 49
Figure 3.4 Houses are numbered accordingly 49
Figure 3.5 Face-to-face questionnaires 50
Figure 4.1 Municipal solid waste composition in Kampung Kuala Pangsun 53
Figure 4.2 Methods to store household waste 55
Figure 4.3 Among the open burning sites in Kampung Kuala Pangsun, 56 Hulu Langat, Selangor
Figure 4.4 Methods to dispose MSW 56
Figure 4.5 Shared communal bins 57
Figure 4.6 Middleman collecting the recyclable items from 58
house-to-house
Figure 4.7 Skin irritation and respiratory-related illness experiences 59 Figure 4.8 Reduction in crops production and increasing number of vectors 59
with frequent presence
Figure 4.9 Necessity to improve current practices of managing MSW 62 Figure 4.10 Suggestions to improve current practices of disposing MSW 63
Figure 4.11 Breadwinners’ occupation 65
Figure 4.12 Breadwinners’ monthly income 66
LIST OF TABLES
Table 2.1 Information on GDP per capita and MSW quantity 10 Table 2.2 The expected trends of per capita MSW generation rate in 13
2025 in Southeast Asia countries
Table 2.3 MSW relative composition in low, middle and high income 17 countries
Table 2.4 MSW composition of Southeast Asia countries 19
Table 2.5 MSW composition in Thailand 20
Table 2.6 SWM programmes in developed countries in Asia 31
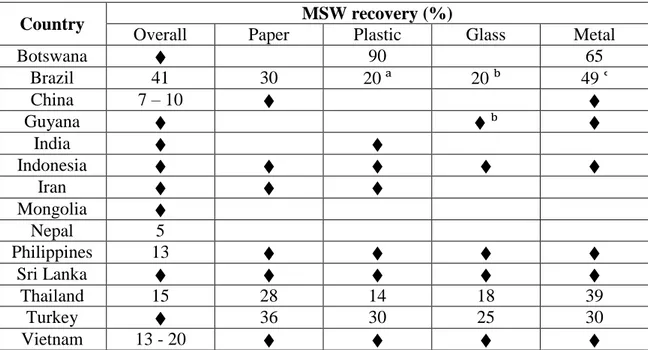
Table 2.7 Percentage of MSW recovery in selected developing countries 43 Table 2.8 Factors influencing sustainable MSW recycling in 44
developing countries
Table 4.1 Price per kg of each recyclable item 57
Table 4.2 Pearson correlation of variables monthly household income 68 and waste generation
Table 4.3 Pearson correlation of variables waste generation 69 and population
Table 4.4 Pearson correlation of variables kitchen waste generation 70 and household monthly income
LIST OF SYMBOLS AND ABBREVIATIONS BEDUCAT Breadwinners’ highest level of education
BFW Book fresh weight
BINCOME Breadwinners’ monthly income
BOCCUPAT Breadwinners’ occupation
BPFW Cardboard fresh weight
CBO Community-based organizations
DIAFW Diapers fresh weight
EQA Environmental Quality Act
GDP Gross domestic product
GHG Greenhouse gaseous
GNI Gross national income
GWFW Garden waste fresh weight
HDPE High-density polyethylene
HDPEFW Plastic / HDPE fresh weight
HOMESIZE Size of household
HWFW Hazardous waste fresh weight
IMPROVE Necessity to improvement of solid waste management
JAKOA Jabatan Kemajuan Orang Asli Malaysia
JAS Jabatan Alam Sekitar
JHEOA Jabatan Hal Ehwal Orang Asli
JPSPN Jabatan Pengurusan Sisa Pepejal Negara
kg Kilogram
kg/L Kilogram per litre
kg/m³ Kilogram per cubic metre
KKM Kementerian Kesihatan Malaysia
km Kilometer
KPI Key Performance Indicators
KPKT Kementerian Perumahan dan Kerajaan Tempatan
KWFW Kitchen waste fresh weight
L Litre
LA Local authority/ies
m³ Cubic metre
MFW Magazine fresh weight
MPFW Mixed paper fresh weight
MPKj Majlis Perbandaran Kajang
MRF Materials recovery facility
MSW Municipal solid waste
MSWM Municipal Solid Waste Management
MTFW Metal fresh weight
NGO Non-governmental organizations
NIMBY Not-in-my-backyard
NPFW Newspaper fresh weight
ODA Official Development Assistance
OFW Other waste fresh weight
PBFW Plastic bags fresh weight
POLYSTFW Polystyrene fresh weight
PPSPPA Perbadanan Pengurusan Sisa Pepejal dan Pembersihan Awam RECOMMEND Recommendations to improve waste management
RECYCLE Involvement in recycling activity
RM Ringgit Malaysia
SATISFY Satisfaction towards current waste management practices
S.E. Standard error
SPSS Statistical Packages for Social Science
SWM Solid waste management
SWPCM Solid Waste and Public Cleansing Management
TFW Tin fresh weight
TTFW Textile fresh weight
UAE United Arab Emirates
UFFW Unconsumed food fresh weight
UN United Nations
UNEP United Nations Environment Programme
URENCO Urban Environment Company
USD United States dollar
WDENS Waste density
WDISPOSE Methods practice to dispose waste
WFW Waste fresh weight
WIEGO Women in Informal Employment: Globalizing and Organizing
WOFW Wood fresh weight
WSTORE Methods practice to store waste
LIST OF APPENDICES
Appendix A Survey Questionnaires 85
Appendix B Raw Data: Average Waste Weight 88
CHAPTER 1: INTRODUCTION
1.1 Municipal Solid Waste in Malaysia
In tandem with our nation’s goal of becoming a developed nation by the year 2020, while ensuring the emphasis on “Sustainable Development”, Malaysia needs a complete and clear information regarding the trends in waste generation, as well as, benefits of source reduction, recycling, composting, land-filling and combustion of municipal solid waste (MSW) (Mohd & Fadil, 2004). Data on trends in urban-rural differences in attitude perceptions, recycling behavior, as well as, the householders’ waste generating behavior are necessary to design and plan for an effective waste management system in the near future (Mohd & Fadil, 2004).
MSW generation in Malaysia has been increasing more than 50 percent per day per person as compared to two decades ago (Pek & Jamal, 2010) due to the population growth, changing consumption patterns, rapid urbanization, economic development, changing income, and industrialization (Chamhuri, 2008; Chang & Davila, 2008; Elmira et al., 2011; Nguyen & Schnitzer, 2009). These also results in variation of the forms of the solid waste produced. Department of Statistics Malaysia (2011) reported that an average annual population growth rate of Malaysian population is two percent for the period of 2000-2010 with population density of 86 persons per square kilometer.
About 71 percent of Malaysian population is urban inhabitants, where Selangor is the top three most urbanized after Kuala Lumpur (100%) and Putrajaya (100%) with 91.4 percent level in urbanization (Department of Statistics Malaysia, 2011). The state population has been growing at 2.7 percent since 2000 giving the total population of 5.46 million people in 2010 with population density of 674 persons per square kilometer (Department of Statistics Malaysia, 2011). The rapid urbanization in the state makes the study on solid waste generation crucial and timely (Mohd & Fadil, 2004).
On average, Malaysian urban population generates about 1.9 kg of solid waste per person per day while the rural population generates about 0.65 kg per person per day (Hamatschek et al., 2010). Moreover, Hamatschek et al. (2010) stated that the waste collection in urban communities covers nearly all inhabitants, but in rural regions only 66 percent of the population has access to a waste management system. Due to this, a lot of illegal dumpsites come to existence. Therefore, solid waste management (SWM) and disposal has become a serious problem for the government due to the institutional, financial, technical, regulatory, expertise and public participation shortcomings as well as land scarcity (Agamuthu et al., 2009; Latifah et al., 2009). Inadequate disposal of waste can cause environmental degradation.
Presently, most wastes are disposed into poorly managed control tipping with little or no pollution protection measures (Pek & Jamal, 2010). This conventional disposal routine is land dominance and poorly maintained. The disbursement for the use of it is made circuitously through the annual housing assessment fee (Pek & Jamal, 2011). The impacts of disposed waste include the contamination of surface and groundwater through leachate, soil contamination through direct waste contact or leachate, air pollution through burning wastes, spreading of diseases by different vectors like birds, insects, and rodents, odor in landfills and uncontrolled release of methane (CH₄) by anaerobic decomposition of waste (Nguyen and Schnitzer, 2009).
Basically, these trends and problems originate from the waste generators. So, an understanding on public behaviors need to be addressed systematically through more rigorous efforts to find ways to improve refuse management for a particular country (Mohd & Fadil, 2004). Comprehensive studies on public behaviors and solid waste generation in urban-rural areas are among few fields that demand endless emphasis if a sound management was to be reached.
1.2 Problem Statement
The issue of increasing wastes has been strongly linked to the health issues. Therefore, developing countries are further challenged to find the best economical and efficient way of resolving the waste management problem which include finance, collection and transportation, educational programs and institutional matters (Mohd & Fadil, 2004). In order to achieve an effective integrated waste management in the country, several issues have to be tackled like waste quantities and characteristics, generators’ attitudes, behaviors and needs (Mohd & Fadil, 2004).
In general, MSW is related to income and socio-economic status whereby as economy grows, public consumes and produces more waste per person basis (Mohd & Fadil, 2004). Also, the attitude and recycling behavior of the society affects the amount of waste that finally goes to the landfill sites. So, through surveys, behavioral and waste characterization studies, the planning and designing of future systems may be made easier. To date, studies to characterize and quantify waste to understand the physical composition of solid waste in rural area particularly Orang Asli villages have yet to be conducted. Most past and current researches about solid waste in Malaysia only focus on urban areas population and international tourism attraction vicinities. Information on the SWM practices in rural areas especially Orang Asli is very inadequate. It is timely that information be made available to ease managers to make better decisions as to which alternatives to be used in a particular situation with specific waste composition at a particular location and time (Mohd & Fadil, 2004).
Normally, there is no solid waste collection service provided by the local authorities (LA) for the solid waste generated from rural settlements. According to a study conducted by Ling et al. in 2010, most the Orang Asli in Jempol district, Negeri Sembilan, do not have waste bins or disposal pits and the waste was seen to be littered on the ground or burnt, or fed to the animals like chickens and dogs. Also, there is no
collection services but storage of recyclables was observed as the Orang Asli sell the recyclable items to agents who come to their village for collection (Ling et al., 2010).
With the enactment of the Solid Waste and Public Cleansing (SWPCM) Act, all solid wastes from household and business are subjected to the Act, including wastes from areas outside LA service boundaries. Information based on solid waste generation, physical composition and current management practices will be useful in the development of municipal SWM alternatives, as well as, assisting the waste handlers to deal with diverse kinds of wastes in proper manners thus reducing the possible negative impacts related to its management. Hence, more local research works need to be done so that better understanding of the issues mentioned can be obtained. Therefore, this study can assist to provide invaluable data on the trends currently occurring within the study area, to develop more understanding on municipal solid waste management among Orang Asli community.
1.3 Objectives
The objectives of the study are:
1. To measure amount, types and composition of solid waste generated from the household of the Orang Asli in Kampung Kuala Pangsun, Hulu Langat, Selangor.
2. To assess the current SWM practices by the Orang Asli in Kampung Kuala Pangsun, Hulu Langat, Selangor, and the impact towards the environment. 3. To identify the involvement of MPKj and JAKOA towards SWM among the
Orang Asli in Kampung Kuala Pangsun, Hulu Langat, Selangor.
4. To propose for better SWM practices in Kampung Kuala Pangsun, Hulu Langat, Selangor.
CHAPTER 2: LITERATURE REVIEW
2.1 Background Information on Orang Asli
Orang Asli or the indigenous people are the descendants of the earliest inhabitants of Peninsular Malaysia. Legally, the Aboriginal People Act 1954 (revised in 1974), defined the Orang Asli as a member of an aboriginal ethnic group, either by blood descent or by adoption, who speaks an aboriginal language and who habitually, follows an aboriginal custom and belief (Nicholas, 2006). They are not a homogenous group but comprised of three subgroups named Negrito, Senoi, and Proto-Malay, which are then divided into several ethnics (Nicholas, 2006). This means that they have different physical characteristics, language and culture. It is believed that the ancestors of the members of Proto-Malay subgroup migrated from the Indonesian islands (Nicholas, 2006). The Proto-Malay is comprised of six ethnics i.e. Temuan, Semelai, Jakun, Orang Kanaq, Orang Kuala, and Orang Seletar (Nicholas, 2006). Physically, the Proto-Malay people resemble the Malays. Their languages remain as archaic variants of the Malay language except the Semelai and Temoq languages that have links to Senoi languages (Nicholas, 2006).
There was no specific administration for the indigenous people until 1954 where the Jabatan Hal Ehwal Orang Asli (JHEOA) was established (Nicholas, 2006). It was established to protect the indigenous people and their way of life from the sudden development of civilization and exploitation while preparing facilities for education and suitable environment (JAKOA, 2012). Since 2001, the JHEOA is under the control of Kementerian Kemajuan Luar Bandar dan Wilayah (KKLBW) but in 2010, JHEOA was changed to Jabatan Kemajuan Orang Asli (JAKOA) and the department strives to drive organizational excellence in the development of indigenous people communities on par with the public offering, as well as, implementing inclusive development to enhance the
socio-economic status and quality of life to the advancement of excellence to uphold the legacy of indigenous people (JAKOA, 2012).
2.2 Description of Solid Waste
Solid waste can be defined as useless and unwanted products in the solid state derived from anthropogenic activities and discarded by society (Smart Ranger, 2009). It is classified into two types, namely municipal solid waste (MSW) and hazardous waste, depending on their source of generation (Smart Ranger, 2009). The MSW comprises of household waste, construction and demolition debris, sanitation residue and waste from streets which are mainly generated from residential and commercial complexes (E-idaman, n.d.).
2.3 Municipal Solid Waste Generation
MSW generation is a natural phenomenon (Singh et al., 2011). Ever since Stone Age, human being had been generating MSW. The MSW generated can either be bones, parts of animals or woods. With civilization, the amount of MSW generated are increasing as well as the types and complexity of the waste, with generation of non-biodegradable solid waste. Generally, the greater the economic prosperity and the higher percentage of urban population, the greater the amount of MSW produced (Nguyen & Schnitzer, 2009). Furthermore, the remarkable amount of MSW being produced is resulted from the increase in the world’s population. Singh et al. (2011), further described that geographical factor such as level of economic development and urban population density influences the generation of MSW in a country.
According to the United States Census Bureau (2012), the total world population was 6 billion people in 2001. However, with the annual growth rate of about one percent, the total world population has exceeded 7 billion people in early 2012 (United
States Census Bureau, 2012). As reported by Singh et al. (2011), the amount of MSW produced is directly proportional to the population growth because less population means less demand for food and shelter, as well as, lesser pressure on other natural resources for their various needs. In term of urbanization, access to health, education, and other social and cultural services are more readily available and efficient in urban areas since the people living closer together (The World Bank, 2012). Therefore, as the rate of urbanization increases, demand on the services of SWM increases (Elmira et al., 2011).
As reported by the Environment Protection and Heritage Council (2010), the indigenous communities in Warraber Island, Australia, generated about 130 tonnes of MSW yearly with each individual produced 500 kg every year. As quoted by UNEP (2009), the Global Waste Management Market Report estimated that the total amount of MSW generated globally in 2006 reached 2.02 billion tonnes, representing a seven percent annual increase since 2003. The UNEP (2009) further estimated that between 2007 and 2011, global generation of MSW will rise by 37.3 percent, equivalent to roughly eight percent increase per year. Data from developed countries are more accessible due to their well-established policies and proper waste management systems that make continuous improvement feasible as compared to weak enforcement, lack of technology and ineffective policy implementation that make the management of waste in developing countries inefficient with a very low possibility of improvement (Agamuthu et al., 2009).
2.3.1 Municipal Solid Waste Generation in Developing Countries
Developing countries are those that have low or middle income economies. According to The World Bank (2012), income economies are divided to low income economies, middle income economies, and high income economies, according to 2010
GNI per capita. Since 30 years ago, most developing countries are experiencing the development in urban areas called urbanization process. Characteristically, the progress in urbanization is together with the growth of inhabitants living in urban regions. However, the progress in urbanization does not always couple with refining situations. Certainly, the unplanned urbanization progression will cause massive complications on managements particularly for fulfilling the escalating call for better municipal services. Besides, the progression will also be the occasion of rise in the amount and complexity of solid waste generated especially, MSW. As cities grow economically, business activity and consumption patterns drive up solid waste quantities (The World Bank, 2011).
The developing countries with lower GDP have lower MSW generation rates and so on. However, due to increasing population and economy, MSW generation is expected to grow in developing countries. Among developing countries, UNEP (2002), as observed by Troschinetz and Mihelcic (2009), reported that Maldives has the highest MSW generation rate which is 2.48 kg/person/day due to its greatest economic activity being tourism, making it an exception among developing countries with typical generation range of 0.3 to 1.44 kg/person/day. Troschinetz and Mihelcic (2009) further observed that Bhutan, Botswana, Mexico and Sri Lanka generate the least amount of MSW on a per capita basis at approximately 0.3 kg/person/day.
Moreover, according to Danbuzu (2011), it is estimated that an average Nigerian generates about 0.49 kg/person/day of MSW, and Issam et al. (2007) further reported that Palestinian produced approximately 0.89 kg/person/day of MSW. A study by Imad (2011) found that the increase in per capita daily generated waste is found linearly proportion to the per capita GDP. Low and medium income countries (developing countries) have low MSW generation rates which are about 0.3 to 0.9 kg per capita per
day while the MSW generation rates of high income countries (developed countries) are about 1.4 to 2.0 kg per capita per day (Imad, 2011).
A number of factors directly affect the amount of MSW produced in developing countries. These include lifestyle, number of people in a household, socio-economic development and the degree of industrialization, as well as climate and seasonal changes (Aquino et al., 2008). The lifestyle, socio-economic development and degree of industrialization can affect the incomes thus manipulating the consumption rates and patterns. A study by Bolaane and Ali (2004) revealed that higher number of people in a given household results in less MSW generation per person per day. While, the quantity of organic material generated during the seasons or climates is influenced by the climate and seasonal changes.
2.3.2 Municipal Solid Waste Generation in Asian Countries
Asia is a very wide and heterogeneous continent. It holds developed countries such as South Korea and Japan, along with developing countries such as India, China and Malaysia. Six of the world’s top ten most populous countries – China, India, Indonesia, Pakistan, Bangladesh, and Japan are in Asia (Shekdar, 2009). Asia is also one of the world’s most densely inhabited zones with remarkable production of MSW due to extremely rapid economic growth and social change, but mostly is defectively handled.
Reliable data on MSW generation can be obtained from developed countries because they are recorded on a daily basis and made available, hence offer a rational basis for planning and implementing waste management processes. However, the data on MSW generation in developing countries are usually collected for the surveys purpose which are only deployed for some time and narrowed to some cities.
Cities in Asia generate a colossal amount of MSW, approximately 760,000 tonnes per day (United Nations Institute for Training and Research, 2011). United Nations Institute for Training and Research (2011) also expected that this figure will increase to 1.8 million tonnes of MSW per day in 2025. This has forced Asian cities to improve their SWM systems because there is no available space to upkeep a ‘throw-away’ consumer way of life. Therefore, more countries are making efforts to improve their infrastructure and services in term of SWM. Shekdar (2009) reported that the quantity of solid waste generation is mostly associated with the economic status of a society (Table 2.1).
Table 2.1: Information on GDP per capita and MSW quantity
Country GDP per capita estimated for
2007 (USD) Waste generation (kg/capita/day) Hong Kong 37,385 2.25 Japan 33,010 1.1 Singapore 31,165 1.1 Taiwan 31,040 0.667 South Korea 23,331 1.0 Malaysia 12,702 0.5 – 0.8 Thailand 9,426 1.1 China 8,854 0.8 Philippines 5,409 0.3 – 0.7 Indonesia 5,096 0.8 – 1.0 Sri Lanka 5,047 0.2 – 0.9 India 3,794 0.3 – 0.6 Vietnam 3,502 0.55 Lao PDR 2,260 0.7 Nepal 1,760 0.2 – 0.5 Source: Shekdar, 2009.
2.3.3 Municipal Solid Waste Generation in Southeast Asia Countries
Since 1980s, Southeast Asia has been experiencing aggressive urban growth, increasing population, changing consumption patterns, economic development, changing income and industrialization (Nguyen & Schnitzer, 2009). These factors
MSW produced. Typically, MSW generation rates are affected by socio-economic development, degree of industrialization and climate (Nguyen & Schnitzer, 2009). This means that the better the economic and the greater the ratio of urban population, more quantity of MSW will be generated.
According to Nguyen and Schnitzer (2009), Vietnam produces approximately 49 million tonnes MSW annually with per capita waste generation of 0.61 kg/person/day; Philippines generates roughly 36 million tonnes MSW every year with per capita waste generation of 0.52 kg/person/day in urban regions and 0.3 kg/person/day in rural regions; and Myanmar produced approximately 10 thousand tonnes of MSW annually with per capita waste generation of 0.45 kg/person/day. Due to economic growth in Southeast Asia countries, the trend in MSW production is expected to escalate too.
Table 2.2 shows estimated trends of MSW generation rate per capita by 2025 in Southeast Asia countries. Nguyen and Schnitzer (2009) predicted that, in high income country like Singapore, the per capita waste generation rate will remain relatively unchanged and then fall considerably to below its present level; while in middle income countries, the per capita waste generation will increase at about 0.3 kg because of bulky wastes and multi-material packing; and in low income countries, the per capita waste generation will increase by about four to six times the present amount.
2.3.4 Municipal Solid Waste Generation in Malaysia
According to the 2010 census conducted by the Department of Statistics Malaysia (2011), Malaysia population is approximately 28 million in 2010 and the per capita gross domestic product (GDP) is USD 14,731. The proportion of country’s urban population increased to 71 percent in 2010 as compared to 62 percent in 2000 (Department of Statistics, 2011).
Malaysia is one of the most prosperous developing countries. It has steady economic growth, low unemployment rates, stable political conditions and plenty of natural resources (Latifah et al., 2009). Instead, owing to rapid economic growth and growing population, the MSW generation quantities escalates fast and leads to severe environmental harms. Generation of MSW in Malaysia has increased more than 91 percent over the past ten years and the urban population is the main waste generator (Agamuthu et al., 2009).
The National Strategic Plan on SWM estimated that the MSW generated is to increase by 3.59 percent per year based on the population growth projections for the period of 2002 to 2020 (Ahmad, 2010). Besides, it has been reported that in 2011, Malaysians produced more than 19,000 tonnes of MSW daily (Chin, 2011). It is anticipated that the amount will increase to 31,000 tonnes in 2020 per day with an average of 0.85 kg per capita per day (Anwar et al., 2012). The average MSW generation per capita is between 0.5 to 0.8 kg/person/day for rural regions while urban regions generate almost 1.9 kg/person/day (Hamatschek et al., 2010).
Table 2.2: The expected trends of per capita MSW generation rate in 2025 in Southeast Asia countries
Country
GNP per capita (USD)
Population Waste generation rates
(kg/cap/day)
Predicted urban waste generation 1995 2025 Total (millions) Urban (% of total) Generation rates (kg/cap/day) Total waste (tons/day) Municipal solid waste (kg/cap/day) Total (tons/day) High income Singapore 26,730 36,000 4.40 100.00 1.10 4,840 1.10 4,840 Middle income Malaysia 3,890 9,440 26.60 72.70 0.81 15,663 1.40 26,812 Thailand 2,740 6,700 62.80 39.10 0.64 15,715 1.50 36,738 Indonesia 980 2,400 212.00 60.70 0.76 96,672 1.00 127,200 The Philippines 1,050 2,500 87.00 74.30 0.52 33,477 0.80 51,504 Low income Myanmar 240 580 57.30 47.30 0.45 12,118 0.85 22,891 Cambodia 220 700 14.20 48.60 0.52 3,544 1.10 7,497 Laos 350 850 5.70 44.50 0.55 1,379 0.90 2,257 Brunei 260 750 3.80 59.00 0.66 149,140 0.95 216,931 Vietnam 240 950 84.00 39.00 0.61 19,983 1.00 32,760
2.4 Municipal Solid Waste Composition
MSW composition undergoes changes as countries develop and become more urbanized (Rajendra et al., 2012). The notable feature is the increase in the paper, paper packaging, plastics and multi material packaging items (Sastry, n.d.). The typical solid waste comprised of mixture of different materials such as food waste, papers, plastics, metals, woods and potentially hazardous substances which can be generated at different times during the extraction, manufacturing or consumption of the materials. Essentially, the waste stream reflects changing in economic activity, production and consumption patterns, as well as, influencing emissions during the solid waste treatment (Ministry for the Environment New Zealand, 2009).
By understanding what materials are in the waste stream, to what degree valuable natural resources are being thrown rather than reused, recycled or recovered to create other products, materials or energy can be identified (Ministry for the Environment New Zealand, 2009). The information on MSW composition is vital for the development of waste minimization policies, target waste minimization programmes and to improve recycling schemes (UNEP, n.d.). For instance, based on MSW composition data, the LA is able to target reuse or recycling schemes for materials that make up the big part of the waste stream in their area (Ministry for the Environment New Zealand, 2009). Also, if organic wastes make up the bulk of the local MSW stream, composting facilities would be favored, and if plastics and paper make up the bulk of the local MSW stream, choosing the incineration option may be bolstered by mildly high heating values (Chang & Davila, 2008). Besides, an improved understanding of the makeup of MSW stream will also contribute to economic, environmental and social benefits (Ministry for the Environment New Zealand, 2009).
MSW composition can affects the environmental and health impacts too. Hence, better MSW composition data will helps to improve understanding on the impacts and
also assist in the management of high-impact waste types (Ministry for the Environment New Zealand, 2009). For examples, hazardous waste has significant implications in a way it is managed and the composition of MSW being disposed to landfills influences the leachate generation which may cause odor, soil and groundwater pollution. Chang and Davila (2008), further described that a reliable MSW characteristics database may aid in the quantification of pollution prevention impacts, support the planning and design of waste management facilities, examine the management strategies and policies at federal, state, and local levels for MSW management, enables private sectors to reach a large, multifaceted SWM market, creating both operational value for the end-users and shareholder value for communities.
2.4.1 Municipal Solid Waste Composition in Developing Countries
Human kind has been generating waste since the beginning but the management of MSW was hardly an issue for old communities because the quantum and composition of MSW produced are easily decompose and revert to soil or be washed away by rivers without creating any serious environmental hazard (Firdaus & Ahmad, 2010). However, as civilization takes place, the nature of MSW becomes more complex. Ray (2003) as quoted by Firdaus and Ahmad (2010) assumed serious proportion only after the human concentrations became engaged in non-agricultural forms of production.
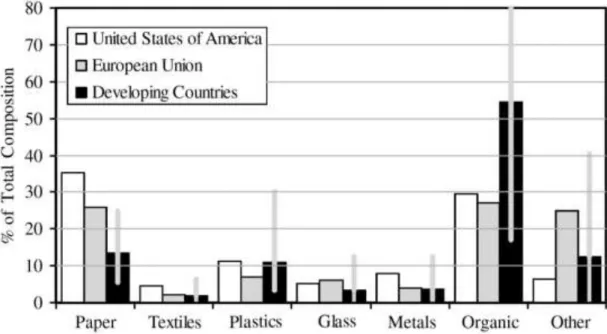
It is believed that the composition of MSW generated in developing countries is similar in composition but the variation between regions are dictated by the socio-economic status and socio-cultural factors of the dwellers within an area (Visvanathan & Trankler, n.d.). Troschinetz and Mihelcic (2009) also pointed out that seasonal effects, income level, domestic fuel supply, geography, living standards and climate are other factors affecting the MSW composition in the developing countries. Averagely, the developing countries generated about 55 percent organic waste (Figure 2.1). It is
assumed that high-income families produced extra inorganic waste from packaging material compared to low-income families which generated extra organic waste from preparing food. In addition, during summer, organic waste generation increases because fruits become a major part of a person’s diet in developing countries (Troschinetz & Mihelcic, 2009).
Figure 2.1: Comparison of MSW composition of developed countries (United States and European Union) against developing countries. Vertical bars provide the range of composition of each material type for the developing countries only Source: Troschinetz & Mihelcic, 2009.
2.4.2 Municipal Solid Waste Composition in Asian Countries
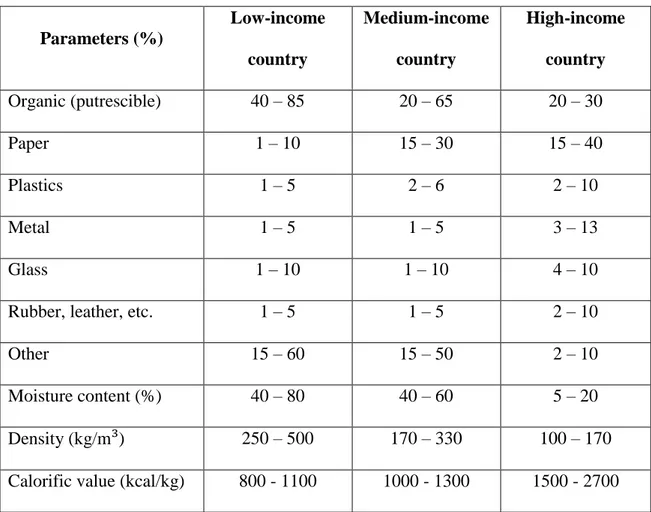
MSW generated from Asian countries can have significant hazardous potential (Singh et al., 2011). The difference in percentage MSW composition of low, middle and high income Asian countries is shown in Table 2.3. The proportion of recyclables like paper and plastic are high in the developed countries while those countries with low GDP have high proportion of organic waste. The low proportion of recyclables in
developing countries can be attributed to the market value of recyclables due to the fact that recycling occurs at every stage of the system, leaving only a small portion that ultimately reaches the landfill for disposal (Shekdar, 2009).
Table 2.3: MSW relative composition in low, middle and high income countries
Parameters (%) Low-income country Medium-income country High-income country Organic (putrescible) 40 – 85 20 – 65 20 – 30 Paper 1 – 10 15 – 30 15 – 40 Plastics 1 – 5 2 – 6 2 – 10 Metal 1 – 5 1 – 5 3 – 13 Glass 1 – 10 1 – 10 4 – 10
Rubber, leather, etc. 1 – 5 1 – 5 2 – 10
Other 15 – 60 15 – 50 2 – 10
Moisture content (%) 40 – 80 40 – 60 5 – 20
Density (kg/m³) 250 – 500 170 – 330 100 – 170
Calorific value (kcal/kg) 800 - 1100 1000 - 1300 1500 - 2700 Source: Singh et al., 2011.
In India, studies by Gupta and Kumar (2011), Mohd and Iqbal (2010), Firdaus and Ahmad (2010), as well as Thitame et al. (2010) in four different cities i.e. Dehradun, Aligarh, Delhi and Sangamner cities observed that biodegradable organic waste have the largest share followed by inert material (sand, ash, stone and dust), paper and plastic waste, with high moisture content i.e. 38 to 50 percent,. The relative amount of recyclable material is quite small because householders or rag-pickers generally retrieve or recycle the marketable metals, papers, plastics, glass and cardboards to a
considerable extent (Joseph, n.d.). Also, other study on solid waste composition in India by Visvanathan and Trankler (n.d.) agreed with Shekdar (2009).
In Iran, studies by Mohammad and Touraj (2007) in Kurdistan Province, and Touraj et al. (2008) in Tehran city, identified that putrescible materials, plastics, paper and cardboard, and textiles constituted more than 90 percent of the total waste stream with high moisture content of 62 percent. Besides, a study on SWM conducted by Medina (2011) in Amman, a largest city in Jordan and one of the oldest human settlements in the world shows that organic waste constituted the largest fraction followed by plastics, textiles, and dirt and sand. It is said that dirt is common in MSW since the city is built on sandy soil and when residents sweep around their homes, sand ends up in the waste bins (Medina, 2011). Other than that, Visvanathan and Trankler (2003) agree with Shekdar (2009) that the major composition on MSW stream in China is organic waste, followed by inert and others, plastics and paper, while in Sri Lanka, organic waste made up the largest portion of solid waste generated followed by paper, and plastics.
2.4.3 Municipal Solid Waste Composition in Southeast Asia Countries
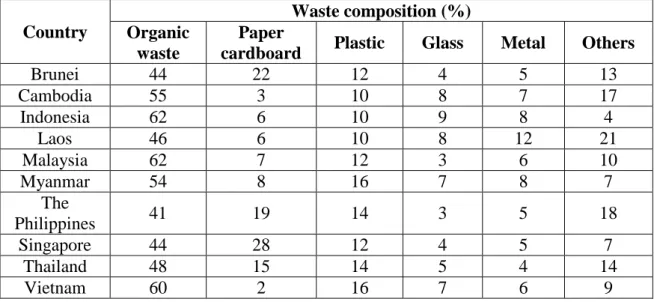
Quantifying and qualifying variety of wastes produced are fundamental to determine the best method to treat the waste. Typical composition of MSW in typical Southeast Asia countries consist of largest fraction of organic waste followed by plastic and paper cardboard. Table 2.4 further described MSW composition in Southeast Asia countries. Table 2.4 shows that Cambodia, Indonesia, Malaysia, Myanmar and Vietnam produced high percentage of organic waste. It is also noted that Brunei, Philippines, Singapore and Thailand generated high percentage composition of paper cardboard. Laos produced high percentage of metal while plastic and glass is fairly generated by all the countries. The other waste category mainly included inert waste, leather and rubber,
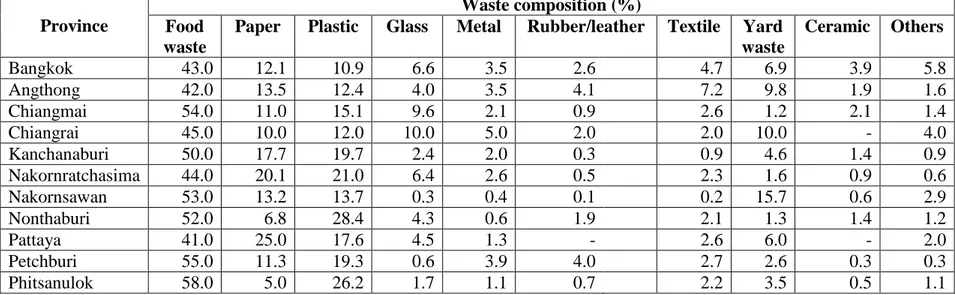
wood and textiles. In other MSW composition studies conducted in Thailand (Table 2.5), Chiemchaisri et al. (2007) agrees with Nguyen and Schnitzer (2009).
Table 2.4: MSW composition of Southeast Asia countries
Country
Waste composition (%) Organic
waste
Paper
cardboard Plastic Glass Metal Others
Brunei 44 22 12 4 5 13 Cambodia 55 3 10 8 7 17 Indonesia 62 6 10 9 8 4 Laos 46 6 10 8 12 21 Malaysia 62 7 12 3 6 10 Myanmar 54 8 16 7 8 7 The Philippines 41 19 14 3 5 18 Singapore 44 28 12 4 5 7 Thailand 48 15 14 5 4 14 Vietnam 60 2 16 7 6 9
Table 2.5: MSW composition in Thailand
Province
Waste composition (%) Food
waste
Paper Plastic Glass Metal Rubber/leather Textile Yard
waste Ceramic Others Bangkok 43.0 12.1 10.9 6.6 3.5 2.6 4.7 6.9 3.9 5.8 Angthong 42.0 13.5 12.4 4.0 3.5 4.1 7.2 9.8 1.9 1.6 Chiangmai 54.0 11.0 15.1 9.6 2.1 0.9 2.6 1.2 2.1 1.4 Chiangrai 45.0 10.0 12.0 10.0 5.0 2.0 2.0 10.0 - 4.0 Kanchanaburi 50.0 17.7 19.7 2.4 2.0 0.3 0.9 4.6 1.4 0.9 Nakornratchasima 44.0 20.1 21.0 6.4 2.6 0.5 2.3 1.6 0.9 0.6 Nakornsawan 53.0 13.2 13.7 0.3 0.4 0.1 0.2 15.7 0.6 2.9 Nonthaburi 52.0 6.8 28.4 4.3 0.6 1.9 2.1 1.3 1.4 1.2 Pattaya 41.0 25.0 17.6 4.5 1.3 - 2.6 6.0 - 2.0 Petchburi 55.0 11.3 19.3 0.6 3.9 4.0 2.7 2.6 0.3 0.3 Phitsanulok 58.0 5.0 26.2 1.7 1.1 0.7 2.2 3.5 0.5 1.1
2.4.4 Municipal Solid Waste Composition in Malaysia
Malaysian MSW contains a very high concentration of organic waste and consequently has high moisture content i.e. approximately 55 percent and a bulk density above 200 kg/m³ (Latifah et al., 2009). Many studies on MSW composition have been conducted. Subjected to the studied area, the MSW composition may be relatively variable. However, Sanaz et al. (2009), and Singh et al. (2011) agreed that the major components of Malaysian MSW which constituted about 80 percent of overall weight are organic waste (processed kitchen waste and food waste), followed by paper and plastic. There are differences in MSW composition relating to people’s background i.e. people with higher income generate more plastic and paper waste (Hamatschek et al., 2010). Ahmad (2010) further reported that current MSW composition in Malaysia is 45 percent of food waste, 24 percent of plastic, 7 percent of paper, 6 percent of iron and 3 percent of glass, and others.
2.5 Municipal Solid Waste Storage and Collection
The source separation is a vital phase in waste management. Typically, waste at source is stored in small bins, communal bins, or hauled communal bins. These bins could be made of metal, plastic or concrete. The most used bins for housing areas is small bin while in high-rise building, communal bins are used. In SWM system, MSW collection activity is the most costly activity and its efficiency would have direct impacts on the level of municipal SWM services in an area (Zaini, 2011). The cost included expenditure incurred in the SWM in an area, resources used in the administration, development and operations of SWM and environmental damages resulted from storage, collection and disposal practices (Zaini, 2011). People are very sensitive to MSW collection services and most complaint received is about its quality
(Zaini, 2011). The regularity of MSW collection varies depending on the activity of an area.
2.6 Municipal Solid Waste Disposal
Ultimately, the generated MSW is thrown into MSW collection centers before being collected by the municipalities to be further disposed into the landfills or dumps (Teri, n.d.). Though, due to several reasons such as resource constraint and inefficient infrastructure, not all generated MSW is collected and transported to the final disposal sites in which, improper MSW management and disposal may lead to serious health impacts and hazards to the environment (Teri, n.d.) such as unattended scattered waste may attracts vectors that will spread diseases while decomposing wet waste releases bad odor.
The final disposal sites i.e. landfills and dumps require lot of land mass and incur costs associated with the consequences of waste disposal. There are large costs involved in providing conveniently located and environmentally responsible landfill facilities (Shakira et al., n.d.) due to land scarcity. Suitable landfill sites are becoming more difficult to find as urban areas expand while people are not willing to accept having a new landfill site near them because of health and environmental problems while landfill can also cause reduction in the value of their homes (Nguyen & Schnitzer, 2009). Therefore, several technological means exist to divert MSW typically destined for a landfill, such as incineration with energy production, composting of organic wastes and material recovery through recycling, all having the potential to be more sustainable methods to manage MSW (Troschinetz & Mihelcic, 2008).
2.7 Municipal Solid Waste Management
The ever-increasing amount and complex composition of MSW generated resulted in the need for updated SWM system to suit the waste quality, quantity and composition. Integrated MSW management involves the management approaches to lessen waste at its origin before it goes into the waste stream. Specifically, sustainable SWM targets to propose a way to preclude MSW through designs. This is based on the full life cycle of the item which operate without generating waste. Waste materials generated can be thought as possible inputs for starting new processes and must be recovered for reuse and recycling to reach the aim of ‘using everything, nothing left’ (Nguyen & Schnitzer, 2009).
The overall goal of SWM is to collect, treat, and dispose MSW generated by people in an environmentally and socially satisfactory manner using the most economical means available (The World Bank, 2011). Research reveals that for an effective SWM, the processing needs to be carried out as close to its source as possible to save transportation cost, reduce efforts of locating newer landfills and ensuring quick processing of waste (Basu, 2010). Ladhar (1996), quoted by Kuniyal et al. (2003), emphasized that wise and sound management of MSW involves participation of each agency or person concerned, from segregation at source to proper collection, transportation and environmentally safe disposal, and finally recycling and reuse.
These MSW and its management issues bring about the need to have a clear and efficient policy on MSW management and legislation to realize that policy is imperative (Agamuthu et al., 2009). Prior to the planning of environmental policies, it is vital to fathom the correlation between people’s knowledge and theirs attitudes so that the designed policies are able to persuade the public to exercise positive environmental behaviors such as reuse, reduce, and recycle the wastes. White et al. (1995), as quoted by Mohd and Fadil (2004), stated that public perceptions and behaviors determined very
much the quantity and types of MSW generated, as well as, the success of any SWM programs. Furthermore, if environmental and health impacts are to be reduced, development of rules and regulation, together with the assistance of community support through well-organized and developed awareness activities in addition to willingness to pay for more effective service are vital.
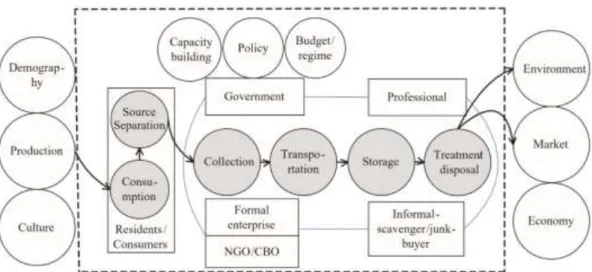
Chen et al. (2010) further interpreted general MSW management system into a model (Figure 2.2). The main flow (shown as black arrows) and the primary waste management process (shown as shaded circles) of the model include consumption, source separation, collection, transportation, storage and treatment disposal. Concerned agents (shown as boxes), placed inside the system’s boundaries are interrelated to each other, as well as, related to the primary process in term of rules and financial plan for MSW management. Aspects placed inside the system’s boundaries are those that can be tackled by waste managers. While those placed outside the boundaries are contingent aspects in the system’s surrounding environment (shown as white circles), over which the influence of waste management tools is limited but influenced both the generation of waste and the demand for recyclables (Chen et al., 2010).
Figure 2.2: The system model of MSW management system. Source: Chen et al., 2010.
Improper management of MSW not only will results in pollution of the natural environment but also may cause significant danger to public health and welfare (Mashhood & Arsalan, 2011). Chang and Davila (2008) pointed out that most SWM issues stem from the difficulty in selecting new landfill sites. This is due to the fact that landfill facilities are expensive to develop because population growth employs the existing landfill space available in an area. In addition, it is known that usually, local governments are responsible to provide SWM services. However, in order to expand services to a growing population, there come challenges to rationalize worker and vehicle performance.
In order to create and sustain effective MSW management practices in indigenous populations is often difficult due to several reasons. Among them are limited transportation choices, irregular MSW collection services, financial commitment to set up infrastructure is beyond the reach of many small communities, high ongoing costs to maintain the management of MSW, the location and natural features of the communities cause problems for the establishment of infrastructure and community perceptions of rubbish (Australian Indigenous HealthInfoNet, 2009). Besides, ordinary solutions to the particular problems experienced by remote communities maybe difficult to be put to practice, machinery required to manage waste and carry out maintenance may not be available, and recycling is often a costly option for many communities especially those in remote locations (Australian Indigenous HealthInfoNet, 2009).
2.7.1 Municipal Solid Waste Management in Developing Countries
As urbanization continues to take place, management of MSW has becomes a major public health, environment and management concerns in developing countries (Hisashi, 2000). This is due to the fact that many developing countries tend to put economics before the environment (United Nations Institute for Training and Research,
2011). Besides, there are several constraints classified into technical, financial, institutional, economic and social which restrain the development of effective SWM systems (Hisashi, 2000). According to Diaz (2011), the key issues of MSW in developing countries are substantial population growth in urban centers mainly due to rural-urban migration, lack of legislation and policies for realistic and long-term planning, inadequate storage and limited collection (services provided based on service fees), lack of proper disposal due to higher capital and operating costs to construct sanitary landfill therefore lead to existence of many dump sites, use of inappropriate technology and equipment, scavenging and insufficient knowledge of basic principles.
Typically, municipalities in developing countries spend 20 to 50 percent of their available recurrent budget on SWM (The World Bank, 2011). Yet, it is also common that 30 to 60 percent of all the urban MSW in developing countries is uncollected, less than 50 percent of the population is served and as much as 80 percent of the collection and transport equipment is out of service, in need of repair or maintenance (The World Bank, 2011). In contrast to developed countries like Australia, though MSW management in remote areas may be difficult and limited, more than 90 percent of indigenous communities in remote areas received organized rubbish collection service (Australian Indigenous HealthInfoNet, 2009). Among the types of rubbish disposal in indigenous communities in Australia are unfenced community tip, fenced community tip and rubbish tip outside community land (Environment Protection and Heritage Council, 2010).
Open dumping with open burning is typical in most developing countries. However, there are many MSW management options practiced by different developing countries. For example, in Egypt, the collection services of MSW in urban and rural areas only cover less than 30 percent, whereby 8 percent of the collected MSW is sent to compost plant while the rest is sent to dump sites scattered in the country open (Imad,
2011). These also happen to other developing countries such as Syria, Jordan, Palestinian Authority, Southeast Asia, Africa, and Latin America. However, in UAE, about 25 percent of the collected MSW is sent to compost plants or landfills (Imad, 2011).
In Kenya, MSW is disposed in open dumps hence makes both surface water and groundwater remain vulnerable to MSW pollution but plans are underway to shift towards sanitary landfill (Henry et al., 2006). Most LA in Kenya used centralized municipal SWM systems, whereby every decision is made up after it is approved by all related departments thus causing suspensions in the liberation of services. Furthermore, participation of private sector is insignificant. So, in order to improve their SWM, several LA in Kenya has embarked on a city beautification program, and banning MSW disposal into water bodies (Henry et al., 2006).
Few numbers of non-governmental (NGO) and community-based organization (CBO) are engaged in purchasing and reselling old office equipment, household wares, used industrial wares and producing inexpensive farm tools such as sprays and watering cans. They also collect recyclable materials such as paper, metal scraps and plastics, which are sold to generate some income together with composting of organic solid waste (food waste) which are sold to urban farmers or landscapers. Others are making mattresses from recycled polyethylene and making glue from bones and hooves (Henry
et al., 2006). These products have a huge market amid the low income people because
the cost is low of which also contribute to lessening of MSW reaching drop off points. In Amman, Jordan, the residents put their MSW into the community wheeled containers made of metal with a capacity of 1.1 m³ placed at the curbside throughout the city (Medina, 2011). The MSW collected in the community containers will be loaded into the municipal collection vehicles at least once a day to be transported to the nearest transfer stations. Subsequently, the collected MSW will be taken to sanitary landfill.
The landfill meets international standards whereby it has a liner system, leachate collection and treatment, as well as, methane collection and utilization to generate energy, and it is 5 miles downwind from the nearest human settlements (Medina, 2011). It accepts about 2,300 tonnes MSW per day and is estimated to meet Amman’s needs for at least another 17 to 18 years (Medina, 2011).
Amman municipality is also supporting private sector participation in MSW collection. For example, in Basman district, the Amman municipality provides the collection vehicles and the private company provides drivers and collection crews to collect about 40 tonnes per day of MSW (Medina, 2011). Besides, the recycling activities are mainly operated by the private entities and scavengers. At least two containers (one for wet waste and another one for dry waste) were placed at each community collection point whereby the organics would be composted, the inorganics are sorted and recycled, and residues would be sent to the landfill.
In Accra, Ghana, the SWM infrastructure is insufficient to serve large amount of generated MSW resulting in indiscriminate burning and burying of solid waste. Only 65 percent of the MSW generated daily is collected and door-to-door collection service is limited to high and medium income households (Boadi & Kuitunen, 2005). The low income households do not have home collection of MSW hence they dispose off their waste into communal containers, surface drains, open spaces, and water bodies (Boadi & Kuitunen, 2005). Although few numbers of communal containers are provided in some areas, it is still inadequate due to its small volume to serve large communities, as well as, irregular MSW collection by the municipality (Boadi & Kuitunen, 2005).
In Kurdistan province, Iran, open dumping is the only method in practice and citizens are not directly charged for the MSW management systems services provided (Mohammad & Touraj, 2007). The MSW collection methods commonly used are curbside collection and direct delivery collection (Mohammad & Touraj, 2007). The
MSW is collected by the municipalities or workers engaged on a daily-wage basis (Mohammad & Touraj, 2007). These workers collect the MSW by using old and low efficient hand trolleys, small vans, trucks, tractors, and self-compactor trucks and then transfer the MSW to temporary medium-sized metal containers in the cities of province, which mostly are improperly equipped (Mohammad & Touraj, 2007). Subsequently, the MSW is sent to the disposal sites which are more than 13 years old covering more than 13,000 hectares around the Kurdistan province (Mohammad & Touraj, 2007).
There are very few sanitary landfills, and about 100 open dumpsites in Palestin (Issam et al., 2007). MSW in these open dumpsites are burnt to reduce the waste volume. Most of the dumpsites were not fenced and accessible to stray animals and scavengers which mostly are children. The recycling activities are very limited and focused only on metals, paper and glass, which are then sold to Israel for remanufacturing (Issam et al., 2007). However, city like Nablu, sent off their collected MSW to landfill in Israeli-controlled areas for a fee (Issam et al., 2007). The major cities are charged with higher MSW collection fees than the villages in the same area. This is due to the broader scale of services offered in the cities, including street cleaning and higher collection frequency. But, no fee is collected from the people in the refugee camps, as the costs of this service are completely covered by the United Nations Relief and Works Agency (UNRWA) (Issam et al., 2007).
2.7.2 Municipal Solid Waste Management in Asian Countries
In developed countries like Japan, South Korea, Taiwan and Singapore, there are extensive literatures on SWM aspects, including established facilities for technical training, and well-established technologies. There are also dependable data collected on a regular basis which is used in SWM system planning and operations (Shekdar, 2009). Table 2.6 shows SWM programmes that have been implemented in Japan, South Korea
and Taiwan. In Japan, laws for SWM were enacted and implemented to promote a recycling-focused society and shared responsibility has been successfully used i.e. waste separation at origin. Then, the municipalities collect the separated recyclables and crush the bulky waste to be sent to recycling facilities or manufacturers. During 2005, around 1910 yen (120 yen = 1 USD) were spent to manage around 53 million tons of MSW, of which 19 percent was recycled, 68 percent was incinerated and 13 percent was landfilled (Shekdar, 2009).
In South Korea, the implementation of a volume-based waste fee system successfully reduces domestic waste generation and proportion of MSW landfilled, as well as increased the proportion of MSW recycle. In Taiwan, a similar system has also lead to the reduction of MSW generation and portion landfilled, while increase the portion of MSW incinerated (Shekdar, 2009). In Hong Kong, most of the MSW generated go to landfill and the rest is recovered, so thermal treatment has been introduced to prolong the life of existing landfills. In China, it was reported that in 2004, the country produced the highest amount MSW (Shekdar, 2009). However, the situation improved due to the enactment of a SWM regulation, increase awareness on resource recovery-based and sanitary landfilling practices, as well as, participation of private agencies in recovery and recycling industries (Shekdar, 2009).
Table 2.6: SWM programmes in developed countries in Asia. Country National program Plan period Waste generation Recycling rate Solid waste disposal Japan Establishing a sound material society 2000-2010 Reduction by 20% Increase by 40% Reduction by 50% South Korea Firm establishment of a sustainable and resource circulating socioeconomic foundation 2002-2010 Reduction by 12% Increase by 53% Reduction by 22% Taiwan Complete
recycling for zero waste Initiated in 2003 - 154 tons to be recycled in 2007, 199 tons in 2011 and 316 tons by 2020 No waste be landfilled in 2020 Source: Shekdar, 2009.
In India, the MSW is managed by the municipalities and disposed to three sanitary landfills (Ghazipur, Bhalswa, and Okhla) located in low lying areas on the outskirt of the city (Esakku et al., 2007). But, there is still considerable part of the MSW generated remains uncollected causing flooding, breeding of vectors and the spread of illnesses due to outdated and inefficient practices, as well as financial constraint (Esakku et al., 2007). So, municipal sanitation workers through street sweeping, waste pickers, waste dealers and recyclers complement the municipality’s struggle to collect and dispose of solid waste. Generally, the MSW produced by households and commercial sectors is gathered in metal or concrete communal waste bins. Nevertheless, open sites, roadside and drains have also been identified in some areas as local garbage collection points due to lack of municipal receptacles (Firdaus & Ahmad, 2010). In Delhi, about 99 percent of the MSW collected are disposed of to the sanitary landfill and the remaining goes to semi-mechanical composting plant (low capital expenditure compared to mechanical composting plant) (Firdaus & Ahmad, 2010). Incineration is