i
CORPORATE SOCIAL RESPONSIBILITY
DISCLOSURE PRACTICES OF INDONESIA
COMPANIES
UNDERGRADUATE THESIS
Submitted as Partial Requirement to Complete Undergraduate Degree Faculty of Economics and Business
University of Diponegoro
Submitted by:
MENTARI LISTYANI 12030110120062
FACULTY OF ECONOMICS AND BUSINESS
UNIVERSITY OF DIPONEGORO
ii
THESIS APPROVAL
Author Name : Mentari Listyani
Student Number : 12030110120062
Faculty/ Department : Economics and Business/ Accounting
Thesis Title : Corporate Social Responsibility Disclosure Practices of Indonesia Companies
Thesis Supervisor : Faisal, S.E., M.Si., Ph.D, Akt.
Semarang, 14 April 2014 Supervisor
iii
SUBMISSION
Author Name : Mentari Listyani Student Number : 12030110120062
Faculty/ Department : Economics and Business/ Accounting
Thesis Title : Corporate Social Responsibility Disclosure Practices of Indonesia Companies
Has been presented and defended in front of the Board of Reviewers on May 2nd, 2014 for fulfilling the requirement to be accepted.
Reviewers Board:
1. Faisal, S.E., M.Si., Ph.D, Akt. ( )
2. Puji Harto, S.E., M.Si, Ph.D, Akt. ( )
iv
Declaration of Originality
I, Mentari Listyani, hereby state and declare that this thesis is true and accurate to be my own work specially written for partial requirement to complete Undergraduate Program of Accounting and has not initially been presented in any other occasion. I bear full responsibility for my undergraduate thesis.
v
MOTTO AND DEDICATION
Success is the ability to go from one failure to another with no loss of enthusiasm
– Winston Churcill
Man shabara zhafira – Arabic Quote
This thesis I dedicate for:
vi
ACKNOWLEDGEMENT
First of all, I would like to acknowledge Her countless thanks to the Most Gracious and the Most Merciful, Allah SWT who always gives her all the best of this life and there is no doubt about it. This thesis entitled as Corporate Social
Responsibility Disclosure Practices of Indonesia Companies is presented to fulfill one of requirements in accomplishing the Bachelor Degree on Faculty of Economics and Business of Diponegoro University.
I realize that there are many people who give me support and strength to complete this thesis. Therefore, I would like to thank to:
1. Prof. Drs. Mohamad Nasir, M.Si., Akt., Ph.D as the Dean of Faculty of Economics and Business, University of Diponegoro.
2. Prof. Dr. Muchamad Syafruddin, M.Si., Akt. as the Chairman of the Accounting Department, Faculty of Economics and Business, University of Diponegoro.
3. Dr. Haryanto, SE, M.Si, Akt. as the author’s trustee in Accounting Department, Faculty of Economics and Business, University of Diponegoro.
4. Faisal, SE., M.Si., Ph.D., Akt. as the great supervisor who has give me all the worth knowledge and experiences. Thank you, Big Boss!
5. All of the lecturers in Faculty of Economics and Business, especially in Accounting Department who have given all the valuable knowledges. 6. Djoko Sulistyo and Handayani as the best parents and the best motivator in
the world.
7. My beloved brother, Irfas Kurniawan, and all my families.
8. GENGGES.Accounting 2010: Widya, Saras, Shabrina, Nina, Galuh, Intan, Novia, Fierda, Asti, Rani, Rina, Nurin. Thanks for everything. You are the color of my life.
9. The one and only my kribo, Dimas E. Saputra. Thanks for being my partner and giving me all your best supports to finish this Bachelor Degree.
10. All my friends in Accounting 2010.
11. Keluarga Mahasiswa Akuntansi (KMA) and Kelompok Studi Pasar Modal (KSPM) for all the experiences and togetherness.
12. My longtime friends, L.I.Fe. You are priceless!
13. Om Nunu and Tante Dona, thanks for being my second parents in Semarang and for all of your advices about life.
14. All of my friends in Gardenia who has been my sisters in Semarang. Thanks for your supports and motivation.
vii
I realize that there are still some lacks in this thesis. Therefore, I hope receive some critics and suggests for this thesis. I do hope that this thesis is worthwhile for those who need it.
Semarang, 14thApril 2014
viii
ABTRACT
This study aims to obtain the extent of disclosure of companies’ CSR activity based on type of disclosure (monetary, quantitative, and narrative) and whether there is a difference by such types of disclosure across industries (sensitive and non-sensitive industry) or not. To measure the extent of CSR disclosure, this study used GRI Index 3.1.
The population of this study was all companies listed in Indonesia Stock Exchange (IDX) in 2012. Sample consists of companies which included in top 100 companies based on market capitalization and disclose annual report and or sustainability report in 2012. Data analysis was performed with the statistics descriptive and independent sample t-test. Statistic program in this study used SPSS 16.
The results of this study indicate that the extent of narrative type is high and it becomes the most used type among Indonesia companies in 2012 to disclose their CSR activity and there is a difference of disclosure in forms between type of industry (sensitive and non-sensitive industry).
ix ABSTRAK
Penelitian ini bertujuan untuk mengetahui tingkat pengungkapan aktivitas Corporate Social Responsibility (CSR) perusahaan berdasarkan tipe pengungkapan (moneter, kuantitatif, dan naratif) dan apakah pengungkapan berdasarkan tipe tersebut berbeda di antara tipe industry (sensitive dan non-sensitive industry). Pengukuran luas pengungkapan aktivitas CSR perusahaan menggunakan Indeks GRI 3.1.
Populasi dari penelitian ini adalah semua perusahaan yang terdaftar di Bursa Efek Indonesia pada tahun 2012. Sampel penelitian terdiri dari perusahaan-perusahaan yang termasuk top 100 perusahaan berdasarkan kapitalisasi pasar dan mengungkapkan annual report dan atau sustainability report di tahun 2012. Analisis data dilakukan dengan menggunakan statistik deskriptif dan independent sample t-test. Program statistik dalam penelitian ini menggunakan SPSS 16.
Hasil dalam penelitian ini menunjukkan bahwa tingkat pengungkapan tipe naratif adalah tinggi dan naratif merupakan tipe pengungkapan yang paling banyak digunakan oleh perusahaan Indonesia di tahun 2012 untuk mengungkapkan aktivitas CSR-nya dan terdapat perbedaan pengungkapan dalam bentuk naratif di antara tipe industry (sensitive dan non sensitive industry).
x
1.3 Purposes and Usefulness ... 8
1.3.1 Purposes of The Study ... 8
1.3.2 Usefulness of The Study ... 8
1.4 Structure of Thesis ... 9
CHAPTER II LITERATURE REVIEW 2.1 Theory ... 11
2.1.1 Institutional Theory ... 11
2.1.2 Corporate Social Responsibility ... 16
2.1.3 Global Reporting Initiative Index (GRI Index) ... 19
2.2 Hypotheses Development ... 28
2.2.1 Disclosure Types ... 28
2.2.2 Industry Type ... 31
CHAPTER III LITERATURE REVIEW 3.1 Operational Variable Definition and Measurement ... 36
3.1.1 Dependent Variable ... 36
xi
3.1.3 Industry Classification ... 38
3.2 Population and Sample ... 39
3.3 Data Source ... 39
3.4 Data Collecting Method ... 39
3.5 Analysis Method ... 40
3.5.1 Descriptive Statistics ... 40
3.5.2 Independent Sample t-Test ... 40
CHAPTER IV RESULTS AND DISCUSSIONS 4.1 Results ... 43
4.1.1 Descriptive Statistics ... 43
4.1.2 Independent Sample t-Test ... 48
4.2 Discussions and Implications ... 51
CHAPTER V CONCLUSIONS AND THE FUTURE RESEARCH 5.1 Conclusions ... 56
5.2 Contributions ... 56
5.3 Limitations ... 57
5.4 Future Research ... 57
REFERENCES ... 58
xii
LIST OF TABLES
Page
Table 2.1 Economic Indicator ... 19
Table 2.2 Environmental Indicator ... 20
Table 2.3 Labor and Decent Work Indicator ... 23
Table 2.4 Human Rights Indicator ... 25
Table 2.5 Society Indicator ... 26
Table 2.6 Product Responsibility Indicator ... 27
Table 2.7 Type of Industry ... 31
Table 2.8 Type of Industry in This Study ... 32
Table 3.1 Indicator of GRI 3.1 Used In This Study ... 37
Table 4.1 Amount of Disclosure (Items) ... 43
Table 4.2 Amount of Indicator Disclosed ... 44
Table 4.3 Top Discussed Items Based in Categories ... 44
Table 4.4 Number of Company Based on Type of Industry ... 46
Table 4.5 Item Disclosed of Each Industry ... 46
Table 4.6 Amount of Companies Disclose CSR Activity per Industry ... 47
Table 4.7 Statistics Descriptive of Monetary Disclosure ... 48
Table 4.8 Independent Sample t-Test of Monetary Disclosure ... 48
Table 4.9 Statistics Descriptive of Quantitative Disclosure ... 49
Table 4.10 Independent Sample t-Test of Quantitative Disclosure ... 49
Table 4.11 Statistics Descriptive of Narrative Disclosure ... 50
xiii
LIST OF APPENDICES
Page
Appendix A List of Companies ... 62
Appendix B Independent Sample t-Test of Monetary Disclosure ... 66
Appendix C Independent Sample t-Test of Quantitative Disclosure ... 67
1
CHAPTER I
INTRODUCTION
1.1 Background
Corporate Social Responsibility (CSR) has been done by most of companies throughout the world including in The Association of Southeast Asian Nations (ASEAN) region. In recent years, those companies which listed on stock exchanges had done many activities that purposed for their social responsibility. McWilliams, Siegel, and Wright (2005) define corporate social responsibility as an action beyond the adherence of the law conducted by the companies. The goal of doing CSR activities is to reach the society trust toward the companies. The higher society trust reached by companies, the higher their companies value. Moreover, they suggest that companies no longer focus on profit maximization for their business to raise their companies value that usually represented by the stock price. The positive impacts from doing CSR activities are the companies can make their business operation give benefits to society and the society’s perception toward the companies will increase. Companies implement the CSR activities through many ways such as environment, philanthropy, and ethical labor practices.
2
business sector in the scope of domestic market will have bright prospects. There are many factors that affect the economic growth in Indonesia. The first of all is the increasing of the middle class society. McKinsey estimates that Indonesia will become the world’s 7th-largest economy in 2030, overtaking Germany and United Kingdom. That condition supported by the amount of 135 million of consuming class population which is bigger than 45 million ones reported in 2012. The consuming class population has a consumptive manner which encourages the purchasing power in economic system. This condition is a chance for people with business minded to fulfill the needs of the society by open a new company. It could be the second factors that upgrade the economic growth. The company will produce the goods and services needed by society. The desire to open new company is not only experienced by domestic businessman or investors but also foreign investors. It is not surprisingly, when there are a lot of investors come to Indonesia. This causes a competitive market in this country. The company will do many ways do attract consumer, stakeholders, and shareholders to increase their sales and expand their business. One of the ways to reach that goal is releasing financial and non-financial report. The financial report shows the financial performance of the company. In other side, non-financial report informs the readers about the social performance of the company.
3
development, in order to increase the quality of life and environment, which will be valuable for the Company itself, the local community, and the society in general. Meanwhile, in Article 74 Number 1 states that the company having its business activities in the field of and/or related to natural resources, shall be obliged to perform its Social and Environmental Responsibility. The company that has business activities is in the field of natural resources is the companies which manage and exploit natural resources in its business core. Whereas, the company that related to natural resources is the company which does not manage and exploit the natural resources but, the business core have impact to the function of the natural resources. This Article also explains the sanctions for the company that does not obey the law.
Law No. 27 of 2007 on Investment on Article 15 state that every investor is required to implement the company’s social liability. The company’s social liability mentioned in that article means the responsibility of every company to create a relationship which harmonious, balanced, and appropriate to the surrounding community’s environment, values, norms, and cultures. While, in Article 16 explains that every investor responsible to preserve the environment. The administrative sanctions given to the investor who does not obey that law are written warning, business restriction, suspension of business and/or investment facility, or revocation of business license and/or investment facility. Those sanctions are stated clearly in Article 34 Number 1.
4
Law, as stated in Article 68, everybody who undertakes the business and/or activity shall be obliged to:
a. Provide information related to environmental protection and management truthfully, transparently, and punctually;
b. Preserve the sustainability of environmental functions; and
c. Abide by the provision on the quality standard of environment and/or standard criteria for environmental damage.
Law No. 22/ 2001 which regulate Petroleum and Natural Gas in Article 11 Clause (3) explains that upstream business activity which executed by business entity or permanent establishment on the basis of joint cooperation contracts with executing agency shall contain principal provisions, one of them is the development of surrounding communities and guarantee for right communal society. Beside it, in Article 40 Clause (5) states that business entity or permanent establishments undertaking the petroleum and natural gas-related business activities shall be responsible for the development of the environmental and local communities.
5
which most disclosed in annual report is human resources and the information are mostly disclosed in positive and descriptive manner.
Djajadikerta and Trireksani (2012) conducted the study of corporate social and environmental disclosure in Indonesian listed company. They focused on the disclosure which reported in company’s web sites. The sample used consists of sensitive and non-sensitive companies and content analysis is used to measure social and environmental disclosure. The findings show that the extent of CSED of Indonesian companies in their corporate web sites is low and descriptive is the mostly nature of disclosure.
This study focuses on non-financial report released by the companies in Indonesia. A company commonly releases annual report that contains financial and non-financial performance. Based on previous studies, those two information are related each other. Financial performance of a company can affect its non-financial performance. Conversely, non-non-financial performance can also affect the company’s financial performance. The non-financial performance is such as Corporate Social Responsibility (CSR) activity. The financial performance of a company can be found in their financial statements. The items of financial performance usually stated in ratio forms such as Return on Assets (ROA), Return on Equity (ROE), Gross Profit Margin (GPM), Net Profit Margin (NPM), etc.
6
human rights, society, and product responsibility. A company which discloses their CSR activity using GRI Index releases a specific report which is called as Sustainability Report (SR). The report contains those items and there are a cross index of GRI in the last pages of the report. Some companies do not release a sustainability report to disclose their CSR activity. They use annual report to inform their CSR activity. Of course, those companies try to mention all the GRI items although they don’t release the sustainability report and attach a cross index of GRI in their annual report last page.
There are many types of disclosure used by company to disclose the items on GRI Index, they are narrative, monetary, and quantitative (Alnajjar, 2000). Narrative type mainly discloses the items in form of sentences or paragraphs. The monetary type mentions the number in rupiahor dollarof an item is conducted by company. Then, quantitative type specify the information of items stated in number form, for example, the amount of waste, the percentage of employee, etc.
7
or their sustainability report. Disclosure occurrence is used to measure the corporate social disclosure. Based on Joseph and Taplin (2011), CSD is measured by “counts the number of disclosure items in the checklist that have disclosures without taking into account the amount of disclosure for each item”. This method applied in this study because this can avoid the occurrence of double counting caused by repetition information of measuring the items. Choosing Indonesia as the scope of this study as there is a scant research in CSR practice and the types of disclosure has been conducted yet. Profitable and competitive business climate and wealth in Indonesia region has urged the companies to initiate CSR practice and disclose it in better way to attract the shareholders.
From the explanation above, this study aims to investigate the extent of corporate social responsibility disclosure of Indonesia companies based on the type of disclosure and whether the amounts of corporate social responsibility disclosure are varied between sensitive and non-sensitive industry.
1.2 Research Questions
8
1.3 Purposes and Usefulness
1.3.1 Purposes of the Study
According to the problem formulation as stated above, the purpose of this study is to analyze the extent of CSRD by the types of disclosure and to find whether a difference of disclosure type across industries or not.
1.3.2 Usefulness of the Study
This study is expected to give advantages as follows:
1. For Investors
The result of this study can be used by the investors to make business decisions, especially financing decisions and general operation decisions. Investor can assess the social performance of companies in better way. They will get adequate information to predict the future cash flow of the firm they involved in because of the decreasing of asymmetry information between managers and investors.
2. For Management
9
3. For Accountant
The result of this study can be used by accountant to arrange financial report considering the environmental, employment, investment and procurement practices, communities, consumer and product issue which can used by the stakeholders and the shareholders to make the right business decisions.
4. For Researcher
The result of the study can be used as a consideration for the next researcher to carry on the extent work in type of disclosure and corporate social responsibility issue which have the contribution for the literature.
1.4 Structure of Thesis
This thesis structure is divided into five chapters as follows:
CHAPTER I : INTRODUCTION
In this chapter the readers will get the explanation about the background of this study practiced, problem statement, the purposes and advantages of the study, and research systematic.
CHAPTER II : LITERATURE REVIEW
In this chapter the readers will get the explanation about the literatures used for the study as the theoretical basis, the previous study, framework and the hypothesis.
10
In this chapter, the readers will get the explanation about variables used in the study, sampling and data, analysis method, data processing, and hypothesis testing.
CHAPTER IV : RESULTS AND DISCUSSIONS
In this chapter, the readers will get the description about the research objects which consists of overview of sample, the results of data processing, and the results and implications of study.
CHAPTER V : CONCLUSIONS AND THE FUTURE RESEARCH
11
CHAPTER II
LITERATURE REVIEW
2.1 Theory
The practice of corporate social responsibility and its disclosure are different among countries. The country and the institution inside where the corporate lies in become the factors that influence those activities. Thus, this study uses institutional theory as the underlying theory.
2.1.1 Institutional Theory
12
behavior, institutionalized norms regarding appropriate corporate behavior, associative behavior among corporations themselves, and organized dialogues among corporations and their stakeholders (Campbell, 2007).
A corporate do its CSR activities is adjusted to its corporate strategy which is enacted for product-market activity (Husted and Allen, 2006). There is a need to make suitable CSR way according to the country where the corporation lies in. It because of different societies have developed different system of markets, which reflecting their institutions, their customary ethics, and their social relations (Matten, 2008). CSR activity varies among countries because there are historically grown institutional frameworks which forms national business system (Whitley, 1997). That national business system (NBS) is vary among countries. The definition of NBS is “distinctive patterns of economic organization that vary in their degree and mode of authoritative coordination of economic activities, and in the organization of, and interconnections between, owners, managers, experts, and other employees” (Whitley, 1999. p.33).
13
14
structure rather than in voluntary and explicit ways in the countries with more leftist political ideology.
After political system, there is education and labor system that can give influence toward CSP. Whitley (1999) explained that education is one of the systems that develops and certifies competences and skills. Meanwhile, he defined labor system is one of the institutions that control how the owners of those skills sell them in the market labor and how those market are organized. Corporations tend to have higher CSP level in the country which has big labor union. A big labor union has a power to give the pressure toward corporations to do socially responsible activity, especially toward them. They also prosecute their right such as benefit for employees, health and safety provisions, progressive labor relations policies, workplace amenities, and may push for involvement in any community engagements. The regulation and production of human resources such as education also give an effect on CSP. The corporation will compete in the labor market to get skilled human capital. In order to attract skilled labor to work in their company, they used CSP as the strategies. Labor is more likely interested in work in a corporate which has good in reputation CSP. Therefore, corporation should improve their CSP in order to recruit skilled labor. The relationship between CSP with skilled labor is inverted. Based on Siegel (1999), the corporate are active to do CSR activity when the condition of market is limited for the availability of the skilled labor.
15
market index. Whitley (1999) mentioned that the types of financial system are market based and credit-based financial system. He defined market based financial system as the actor “mobilize and distribute capital largely through large and liquid markets which trade and price financial claims through the usual commodity-market processes” (Whitley 1999, p.49). Meanwhile, the credit-based financial systems “typically have weak and fairly illiquid or thin capital markets, which play only a minor role in mobilizing and pricing investment funds” (Whitley, 1999, p.49). In market based financial system, the financing decision is based on short-term profitability consequently the corporation strives to maximize their profit (Teoh, Welch and Wong, 1998a; Teoh, Welch and Wong, 1998b). This condition encourages the firm to limit the investments in CSR activity. Hence, the corporation which involving in market based system is likely suffers the low CSP index. In the other side, credit-based financial system allocates the capital based on administrative processes and encounters the capital-constraint which can lead to the lower CSP Index (Ioannou and Serafeim, 2012). Thus, the market-based system is better structured capital allocation and lesser facing capital constraint than credit-based financial system. Therefore, the corporations which lie in or closer to the market-based systems are likely more high score in CSP Index.
16
broadly. The society in individualistic cultures is likely to hold explicit CSR activities as the response of the perceived expectation of stakeholders (Ioannou and Serafeim, 2012).
2.1.2 Corporate Social Responsibility
Corporate in doing their business involves the internal and external environment. Corporations should act socially responsible towards them in order to support the going concern of their business. The definition of act socially responsible is when the corporate social behavior is appropriate and can be accepted by the stakeholders who have the interest in the corporate or those who give pressure the corporate to do that action, for instance, the non-governmental organizations, consumers, or group of community. For example, the sociable responsibility behavior toward the internal environment is treating the employees by giving to them the decent work environment, safety guarantee, and feasible wages. Meanwhile, the sociable behaviors against external environment such as customer are attaching the product’s manual book, give the right information of the product, respect of the product quality, etc. Toward the suppliers, company gives their commitments to hold the contract, to the government, company complying all the laws and regulations and against to the community, and against to the community, company give their role or contribution to help and develop them (Campbell, 2007).
17
of all is the economic condition. Previous study shows that the company which has powerless financial performance, they are likely limit their social behavior toward the environment or even they do not have that behavior (Orlitzky et al., 2003). It happens because the firms that experience decreasing financial performance or its profitability, they have less resource to do socially responsible activity then they do not (Waddock & Graves 1997). Economic condition also can be reflected by the condition of business competition. A firm which faces little business competition likely has less socially responsible behavior then the firm which faces strict competition business. In the strict market, if a company does irresponsible activity, it will affect their sales or profitability. It happens because their customer will move from their product to the other product.
Beside the economic condition, socially responsible behavior also affected by institutional condition such as regulations or laws released by government, emerging the self-regulation, the presence of non-governmental organization, the involvement in trade or employer associations, and their involvement in institutionalized dialogue with unions, employees, community groups, investors, and other stakeholders. Corporations will likely act in social responsible way if there are regulations and good monitoring by the government to ensure the enforcement of it. The government also should have the capacity to engage the society in order to monitor the corporation’s behavior.
18
one that does not. Not only the presence of industry regulation or self-regulation that can encourage a corporate to socially responsible, but there must have a well-organized system and effective self-regulation. The behavior of corporation not only monitored by government, but there are also an independent organization that monitor them and pressure them to behave socially responsible. The organization called as non-governmental organizations or NGO exists whether in international or domestic scope. For instance, the international NGO are the International Labor Organization (ILO), the Word Wildlife Federation, and the World Health Organization (WHO) (Boli & Thomas, 1997).
The corporation involvement in a trade or employer association also gives an impact toward their socially responsible behavior. The business associations give their contributions to the members in educating them about the long-term advantages to have the better industrial system, better employee compensation program, etc. The corporate which involves in trade or employer association is likely has socially responsible behavior than the others which do not.
19
2.1.3 Global Reporting Initiative Index (GRI Index)
Global Reporting Initiative Index is a non-profit organization which encourages economic sustainability of organizations. This organization makes the sustainability reporting standards which have been followed by more than 4000 organizations from 60 countries. The kinds of organizations that followed the standards are corporate business, public agencies, smaller enterprises, non-governmental organizations (NGOs), industry groups, etc. Sustainability reporting is a report that informs the economic, environmental, social and governance performance of organization. The other names of sustainability reporting are ecological footprint reporting, environmental social governance (ESG) reporting, triple bottom line (TBL) reporting, and corporate social responsibility (CSR) reporting.
Based on Sustainability Reporting Guidelines (2011), here are the GRI’s indicator explanation and all of each its items or indicator performance:
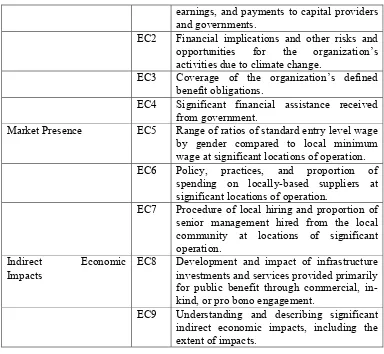
a. Economic
The economic indicator shows the impacts toward the economic condition of its stakeholders and its economic system at local, national, and global levels.
Table 2.1 Economic Indicator
Sub-Indicator Code Explanations
20
earnings, and payments to capital providers and governments.
EC2 Financial implications and other risks and opportunities for the organization’s activities due to climate change.
EC3 Coverage of the organization’s defined benefit obligations.
EC4 Significant financial assistance received from government.
Market Presence EC5 Range of ratios of standard entry level wage by gender compared to local minimum wage at significant locations of operation. EC6 Policy, practices, and proportion of
spending on locally-based suppliers at significant locations of operation.
EC7 Procedure of local hiring and proportion of senior management hired from the local community at locations of significant operation.
Indirect Economic Impacts
EC8 Development and impact of infrastructure investments and services provided primarily for public benefit through commercial, in-kind, or pro bono engagement.
EC9 Understanding and describing significant indirect economic impacts, including the extent of impacts.
b. Environmental
Environmental indicator exhibits the organization’s impact against living and non-living natural system, including ecosystems, land, air, and water.
Table 2.2
Environmental Indicator
Sub-Indicator Code Explanations
Materials EN1 Material used by weight or volume.
EN2 Percentages of material used that are recycled input materials.
Energy EN3 Direct energy consumption by primary
21
EN4 Indirect energy consumption by primary source.
EN5 Energy saved due to conservation and efficiency improvements.
EN6 Initiatives to provide energy-efficient or renewable energy based products and services, and reductions in energy requirements as a result of these initiatives. EN7 Initiatives to reduce indirect energy
consumption and reductions achieved.
Water EN8 Total water withdrawal by source.
EN9 Water sources significantly affected by withdrawal of water.
EN10 Percentage and total volume of water recycled and reused.
Biodiversity EN11 Location and size of land owned, leased, managed in, or adjacent to, protected areas and areas of high biodiversity value outside protected areas.
EN12 Description of significant impacts of activities, products, and services on biodiversity in protected areas and areas of high biodiversity value outside protected areas.
EN13 Habitats protected or restored.
EN14 Strategies, current actions, and future plans for managing impacts on biodiversity.
EN15 Number of IUCN Red List species and national conservation list species with habitats in areas affected by operations, by level of extinction risk.
Emissions, Effluents, and Waste
EN16 Total direct and indirect greenhouse gas emissions by weight.
EN17 Other relevant indirect greenhouse gas emissions by weight.
EN18 Initiatives to reduce greenhouse gas emissions and reductions achieved.
EN19 Emissions of ozone-depleting substances by weight.
EN20 NO, SO, and other significant air emissions by type and weight.
EN21 Total water discharge by quality and destination.
22
EN23 Total number and volume of significant spills.
EN24 Weight of transported, imported, exported, or treated waste deemed hazardous under the terms of Basel Convention Annex I, II, III, and VIII, and percentage of transported waste shipped internationally.
EN25 Identity, size, protected status, and biodiversity value of water bodies and related habitats significantly affected by the reporting organization’s discharges of water and runoff.
Products and Services EN26 Initiatives to mitigate environmental impacts of products and services, and extent of impact mitigation.
EN27 Percentage of products sold and their packaging materials that are reclaimed by category.
Compliance EN28 Monetary value of significant fines and total number of non-monetary sanctions for noncompliance with environmental laws and regulations.
Transport EN29 Significant environmental impacts of
transporting products and other goods and materials used for the organization’s operations, and transporting members of the workforce.
EN30 Total environmental protection expenditures and investments by type.
c. Labor Practices and Decent Work
This category is based on internationally recognized universal standards, such as:
United Nations Universal Declaration of Human Rights;
United Nations Convention: International Covenant on Civil and Political
23
United Nations Convention: International Covenant on Economic, Social, and
Cultural Rights;
Convention on the Elimination of all Forms of Discrimination Against
Women (CEDAW);
ILO Declaration on Fundamental Principles and Right at Work (in particular
the eight core Conventions of the ILO consisting of Conventions 100, 111, 87, 98, 138, 182, 29, 105); and
The Vienna Declaration and Programme of Action.
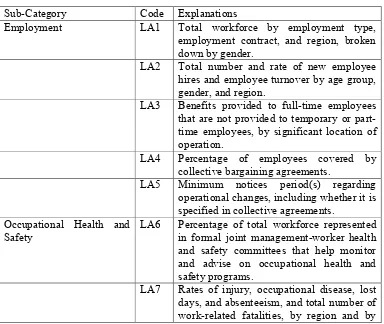
Table 2.3
Labor and Decent Work Indicator
Sub-Category Code Explanations
Employment LA1 Total workforce by employment type,
employment contract, and region, broken down by gender.
LA2 Total number and rate of new employee hires and employee turnover by age group, gender, and region.
LA3 Benefits provided to full-time employees that are not provided to temporary or part-time employees, by significant location of operation.
LA4 Percentage of employees covered by collective bargaining agreements.
LA5 Minimum notices period(s) regarding operational changes, including whether it is specified in collective agreements.
Occupational Health and Safety
LA6 Percentage of total workforce represented in formal joint management-worker health and safety committees that help monitor and advise on occupational health and safety programs.
24
gender.
LA8 Education, training, counseling, prevention, and risk-control programs in place to assist workforce members, their families, or community members regarding serious disease.
LA9 Health and safety topics covered in formal agreements with trade unions.
Training and Education LA10 Average hours of training per year per employee by gender, and by employee category.
LA11 Programs for skills management and lifelong learning that support the continued employability of employees and assist them in managing career ending.
LA12 Percentage of employees receiving regular performance and career development reviews, by gender.
Diversity and Equal Opportunity
25
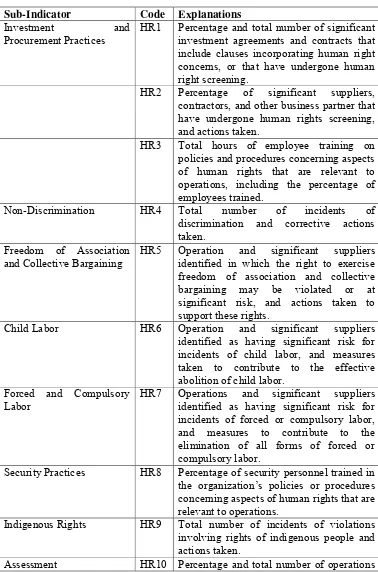
HR1 Percentage and total number of significant investment agreements and contracts that include clauses incorporating human right concerns, or that have undergone human right screening.
HR2 Percentage of significant suppliers, contractors, and other business partner that have undergone human rights screening, and actions taken.
HR3 Total hours of employee training on policies and procedures concerning aspects of human rights that are relevant to operations, including the percentage of employees trained.
Non-Discrimination HR4 Total number of incidents of discrimination and corrective actions taken.
Freedom of Association and Collective Bargaining
HR5 Operation and significant suppliers identified in which the right to exercise freedom of association and collective bargaining may be violated or at significant risk, and actions taken to support these rights.
Child Labor HR6 Operation and significant suppliers identified as having significant risk for incidents of child labor, and measures taken to contribute to the effective abolition of child labor.
Forced and Compulsory Labor
HR7 Operations and significant suppliers identified as having significant risk for incidents of forced or compulsory labor, and measures to contribute to the elimination of all forms of forced or compulsory labor.
Security Practices HR8 Percentage of security personnel trained in the organization’s policies or procedures concerning aspects of human rights that are relevant to operations.
Indigenous Rights HR9 Total number of incidents of violations involving rights of indigenous people and actions taken.
26
that have been subject to human rights reviews and/ or impact assessments. Remediation HR11 Number of grievances related to human
rights filed, addressed and resolved through formal grievance mechanisms.
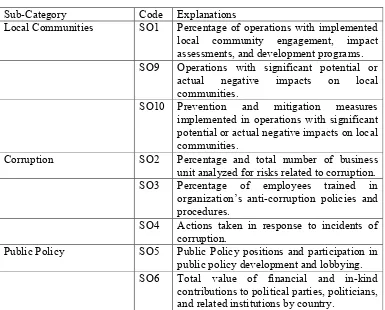
Local Communities SO1 Percentage of operations with implemented local community engagement, impact assessments, and development programs. SO9 Operations with significant potential or
actual negative impacts on local communities.
SO10 Prevention and mitigation measures implemented in operations with significant potential or actual negative impacts on local communities.
Corruption SO2 Percentage and total number of business unit analyzed for risks related to corruption. SO3 Percentage of employees trained in
organization’s anti-corruption policies and procedures.
SO4 Actions taken in response to incidents of corruption.
Public Policy SO5 Public Policy positions and participation in public policy development and lobbying. SO6 Total value of financial and in-kind
27
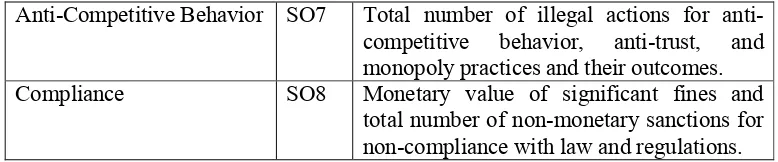
Anti-Competitive Behavior SO7 Total number of illegal actions for anti-competitive behavior, anti-trust, and monopoly practices and their outcomes. Compliance SO8 Monetary value of significant fines and
total number of non-monetary sanctions for non-compliance with law and regulations.
f. Product Responsibility
Product responsibility indicator assess the disclosure of organization’s products and services that directly affect customers, namely, health and safety, information and labeling, marketing, and privacy.
PR1 Life cycle stages in which health and safety impacts of products and services are assessed for improvement, and percentage of significant products and services categories subject to such procedures. PR2 Total number of incidents of
non-compliance with regulations and voluntary codes concerning health and safety impacts of products and services during their life significant products and services subject to such information requirements.
PR4 Total number of incidents of non-compliance with regulation and voluntary codes concerning product and service information and labeling, by type of outcomes.
PR5 Practices to related customer satisfaction, including results of surveys measuring customer satisfaction.
28
communications, including advertising, promotion, and sponsorship.
PR7 Total number of incidents of non-compliance with regulations and voluntary
codes concerning marketing
communications, including advertising, promotion, and sponsorship by type of outcomes.
Customer Privacy PR8 Total number of substantiated complaints regarding breaches of customer privacy and losses of customer data.
Compliance PR9 Monetary value of significant fines for non-compliance with laws and regulations concerning the provision and use of products and services.
2.2 Hypotheses Development
2.2.1 Disclosure Types
29
Based on Alnajjar (2000) who organized his study using content analysis, here are the explanations of three types of disclosure:
a. Monetary
“The monetary type disclosure specifies the number with which dollar amounts were presented in the report about the measured item (e.g. money contributed to charity). It is a statement expressing factual information concerning firm’s SRDs expressed in monetary terms”.
b. Quantitative
“The quantitative type disclosure specifies the number of non-monetary figures given in the report about the measured item (e.g. percentages, numerical values). It is a statement expressing factual information concerning a firm’s SRDs in quantitative terms”.
c. Narrative
“The narrative type disclosure represents the number of lines in the report pertaining to the item. It is a statement expressing factual information concerning a firm’s SRDs expressed in narrative terms. Every line was calculated to consist of approximately ten words”
30
disclosure of CSR of sustainability reporting in annual report by counting the amount of words, sentence, etc. Meanwhile, the disclosure occurrence counts the number of items which stated in disclosure index or checklist. For example, the items of labor turnover will scored by 1 if disclosed and scored by 0 if it is not disclosed. Disclosure occurrence has two types, such as weighted and un-weighted indices (Cooke, 1991). The un-un-weighted index treats all the items equally important, it means that the items have the same score when they are disclosed. In the other side, the weighted index measure the disclosure items by giving higher score to the items disclosed than the other based on their perceived importance (Cooke, 1991). The un-weighted index is the most used by the researcher because of its less subjectivity and equal relevance to all organizations (Cooke, 1991; Craig & Diga, 1998; Marston & Shrives, 1991).
31
in the content analysis. The occurrence disclosure also uses subjectivity in the separation of similar disclosures into separate items (Joseph and Taplin, 2011).
2.2.2 Industry Type
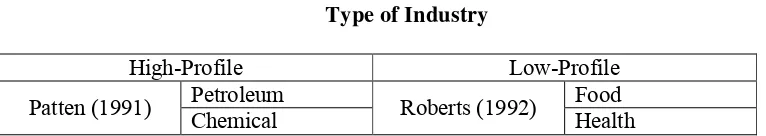
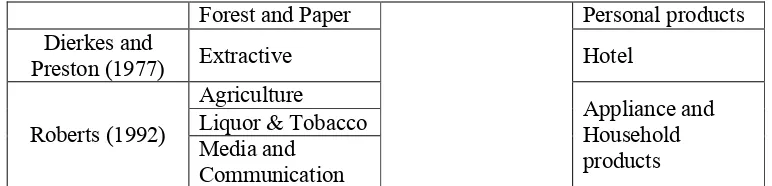
There are previous studies that correlate the type of industry with corporate social and environment disclosure (CSED). The result are also various, many of them are significant, and the others are insignificant. The result which is significant are the study conducted by Adam et al., 1998; Brown and Deegan, 1998; Choi, 1999; Cowen et al., 1987; Deegan and Gordon, 1996; Hackston and Milne, 1996; Williams, 1999). Meanwhile, the study which provide insignificant result are Gray et al., 1995, Gunawan et al., 2009; and Djajadikerta and Trireksani, 2012. Cowen et al. (1987) explains that type of industry in which a company categorized in is one of the factors to influence CSED. Deegan and Gordon (1996) held a study towards Australian firms and find that the companies which the operation is potentially impact to environment tend to have higher disclosure level than those which are less impact to environment. Roberts (1992. p. 605) states that the industries which pertain to consumer visibility, a high level of political risk, and concentrated, intense competition. Below is the table of industries classified as high-profile and low profile industries based on previous studies :
Table 2.7 Type of Industry
High-Profile Low-Profile
Patten (1991) Petroleum Roberts (1992) Food
32
Meanwhile, Gunawan et. al. (2009) categorized the industry based on their impact toward environment into sensitive and non-sensitive industry. His study conducted in Indonesia and he used the list of industry types declared by IDX (Indonesia Stock Exchange) to categorize into sensitive and non-sensitive industry. This study followed the method of categorizing type of industries stated by Gunawan et. al (2009) because the type of industry used in this study is same with used in the previous study.
Table 2.8
Type of Industry in This Study
Sensitive Industries
1 Agriculture, including crops, plantation, animal husbandry, fishery, and forestry.
2 Mining, including coal mining, crude petroleum & natural gas production, metal & mineral mining, and land/stone quarrying.
3 Basic industry and chemicals, including cement, ceramics, glass, porcelain, metal and allied products, chemicals, plastics & packaging, animal feed, wood industries, and pulp & paper.
4 Miscellaneous industries, including machinery and heavy equipment,
automotive and components, textile, garment, footwear, cable and electronics. 5 Consumer goods industries, including food and beverages, tobacco
manufacturers, pharmaceuticals, cosmetics and house hold, and house ware. 6 Property, real estate, and building constructions.
7 Infrastructure, utilities, and transportation, including energy, toll road, airport, harbor & allied products, telecommunications, transportation, and non
building construction.
33
Non-Sensitive Industries
1 Finance companies, including banks, financial institutions, securities companies, insurance, and investment funds.
2 Trade, services, and investment including advertising, printing & media, health care, computer and services, and investment companies.
Source: Djajadikerta and Trireksani (2012)
The differentiation of industry based on their impact toward the environment into sensitive and non-sensitive industry is likely affect the way of corporate to disclose their CSR activity. Thus, the hypothesis is formulated as follow:
H1: The disclosures by the types are varies between sensitive and
non-sensitive industry.
34
environmental, social and governance performance of a company. The report is disclosed by following standards which released by Global Reporting Initiatives Index (GRI Index).
Based on study organized by Maignan and Ralston (200) toward each 100 firms in France, The Netherlands, the United Kingdom, and the United Stated give the result that there are three motivations to do CSR activity, they are (1) managers valued such behavior in its own right, (2) managers believed that this behavior enhanced the financial performance of their firms, and (3) stakeholders, which are community groups, customers, and regulators that most commonly give a pressure toward companies to responsible socially. There are some goals that pursued by companies through releasing a report that explain their corporate social responsibility.
35
CHAPTER III
RESEARCH METHOD
This chapter will explains how the research is conducted. The variable definition, the choosing of population, sample and data, the method of data collecting, and the analysis method will be defined clearly in this part.
3. 1 Operational Variable Definition and Measurement
3. 1. 1 Dependent Variable
Dependent variable is the variable primary interest to the researcher (Sekaran, 2006). This study use corporate social disclosure as the dependent variable. The measurement of this variable is explained briefly in the next section.
3. 1. 2 Measurement of the Quantity and Nature of Corporate Social
Disclosure
The quantity of corporate social disclosure is measured using disclosure occurrence method. This method has been used by previous research on social-disclosure based. Joseph and Taplin (2011) states that social-disclosure occurrence measure the CSR disclosure by “counts the number of disclosure items in the checklist that have disclosures without taking into account the amount of disclosure for each item”
37
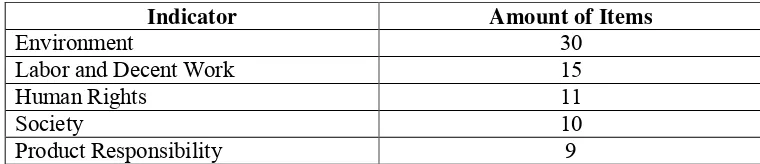
has six indicators comprises (1) economic; (2) environmental; (3) labor practices and decent work; (4) human rights; (5) society; and (6) product responsibility. However, this study only uses five indicators excluding economic indicator. This study exclude economic indicator because this study focused on the social and environment disclosure such as the relationship toward labor or society and the impact toward the sustainability of environment. Below is the GRI 3.1 Index used in this study.
Table 3.1
Indicator of GRI 3.1 Index Used in This Study
Indicator Amount of Items
Environment 30
Labor and Decent Work 15
Human Rights 11
Society 10
Product Responsibility 9
38
of non-monetary figures about the measured item such as percentages, numerical values, etc. then, that item categorized as quantitative type. If an item disclosed only using the sentences then, it categorized as narrative type.
The final of this study is aimed to relate the item disclosed against the type of disclosure. Each of the five categories of corporate social disclosure used in this study then subdivided into many items. Annual reports or sustainability reports are classified by the categories then by items.
3. 1. 3 Industry Classification
39
3. 2 Population and Sample
Data source used in this study is secondary data which comprise companies listed in Indonesia Stock Exchange (IDX) for period of 2012. This study used year 2012 as the time setting because the year is the beginning of implementation of GRI 3.1 .Below are the criteria of the companies which are used as the sample:
1. The company is listed in Indonesia Stock Exchange (IDX) in 2012.
2. The company categorized as top 100 companies based on market capitalization.
3. The company released annual report or sustainability report in 2012.
3. 3 Data Source
This study uses secondary data that are derived from Indonesian Stock Exchange in year 2012 and company’s website.
3. 4 Data Collecting Method
40
3. 5 Analysis Method
3.5.1 Descriptive Statistics
To measure the extent of corporate social disclosure by the type of disclosure, this study used descriptive statistics. The statistics used are mean, minimum and maximum.
Mean
Mean is defined as the sum of all the sampled values divided by the total number of sampled values.
Sample Mean = Sum all of the values in the sample Number of values in the sample
Maximum
Maximum is defined as the highest amount of sampled values.
Minimum
Minimum is defined as the lowest amount of sampled values.
3.5.2 Independent Sample t-test
41
not (equal variances not assumed) by using the value of Levene’s Test. Below is the decision making of Levene’s Test:
1. If significance value of Levene’s Test > 0.05, then H0is accepted. Acceptance
of H0shows that the variance is equal.
2. If significance value of Levene’s Test < 0.05, then H0is rejected. Rejection of
H0shows that the variance is different.
Second, do analyzing the t-test value. Testing is done by significance level at 0.05 (α = 5%). The decision making of t-test value as follows:
1. If the value of .sig t value > 0.05, then H0is accepted. It means that there is no
difference of mean value between two groups.
2. If the value of .sig t value < 0.05, then H0 is rejected. It means that there is