Management Decisions: A Case Study of
Intraday Security Return Patterns
Stanley B. Block
TEXASCHRISTIANUNIVERSITY
Dan W. French
NEWMEXICOSTATEUNIVERSITY
Edwin D. Maberly
UNIVERSITY OFCANTERBURY
This article examines causes of observed stock trading patterns that show
Possible Causes of Intraday
high hourly returns and trading volume during early and late trading
hours. Using time-stamped data from an institutional investor, we docu-
Return Patterns
ment high levels of portfolio managers’ early-morning and late-afternoonThe literature refers to the observed return regularity as the
decisions to trade that can result in the volume pattern and relatively
“U-shaped pattern of intraday returns.” It has been identified
higher proportions of buy decisions that could contribute to the return
in a number of studies including work by Harris (1986, 1989),
pattern.J BUSN RES2000. 50.321–326. 2000 Elsevier Science Inc.
Jain and Joh (1988), Wood, McInish, and Ord (1985), McInish
All rights reserved.
and Wood (1990), and Smirlock and Starks (1986). A similar pattern (high early and late in the day, low during the middle hours) applies to trading volume (see, for example, Foster and Viswanathan, 1989; Jain and Joh, 1988; McInish and
I
nvestors who trade stocks are competing with professionalWood, 1991; and Wood et al., 1985), return variance (see, traders and institutional investment managers, and to be
for example, Admati and Pfleiderer, 1989a; Lockwood and competitive, investors must be aware of the influences
Linn, 1990; and Wei, 1992), and bid-ask spreads (see, for that other traders have on market returns. Researchers have
example, Brock and Kleidon, 1992; McInish, and Wood, identified a number of regularities in common stock returns,
1992; and Stoll and Whaley, 1990). The values for these and this article addresses the well-documented pattern of
variables during market opening and closing times are dis-stock returns during the average trading day that shows a
tinctly larger than the midday values. repeated occurrence of higher-than-expected returns at the open
Some of the attempts to explain these non-stationarities and close of the market and lower returns during the middle
have relied on market microstructure models that allow pat-of the day. The hypotheses pat-of the article is that the timing pat-of
terns to develop based solely on the internal structure and institutional investors’ decisions stimulates this pattern
be-operation of the market and in the absence of any external cause managers tend to make the majority of their transaction
influences. Admati and Pfleiderer (1989b) develop an infor-decisions toward the end of the day. These late-day infor-decisions
mation-based model to explain trade clustering that can occur affect end-of-day market returns and volume, and the
begin-at any time during the trading day, and they discuss the role ning-of-day returns and volume are high because of the
accu-of the open and the close as special clustering points. They mulation of orders from managers’ decisions made after the
contend that market makers have adverse selection problems market close the previous day plus decisions made before the
with informed traders that they attempt to alleviate through opening of trading each day.
their interaction with nondiscretionary liquidity traders, dis-cretionary liquidity traders, and informed traders, so they offer Address correspondence to Dan W. French, Department of Finance, MSC inducements for liquidity traders to transact at certain times 3FIN, New Mexico State University, Las Cruces, NM 88003-8001; Tel.: (505)
646-3201; fax: (505) 646-2820; E-mail: [email protected] during the day.
Journal of Business Research 50, 321–326 (2000)
2000 Elsevier Science Inc. All rights reserved. ISSN 0148-2963/00/$–see front matter
Brock and Kleidon (1992) maintain that market evidence Gerety and Mulherin (1992) attribute the U-shaped pattern in trading volume to short-term investors. These short-term is at odds with the Admati and Pfleiderer (1989b)
information-based model. The Admati-Pfleiderer model partially relies on investors, such as market makers and day traders, have rela-tively little ability to bear risk overnight and desire to exchange lower transaction costs to explain higher volume and returns
at the opening and close of the day. However, Brock and their positions with investors having a greater ability to bear risk overnight. Gerety and Mulherin (1992) reason that if Kleidon (1992), extending the inventory-based model of
Gar-man (1976), show that spreads (transactions costs) should be investors are transferring risk of holding positions while the market is closed, then end-of-day volume should be directly higher at the open and the close. They present evidence of
observed transaction costs as measured by the bid-ask spread related to overnight return variance. Using closing and open-ing-hour trading volume on the NYSE from 1933 to 1988, often being higher at these times.
In addition to explanations based on market microstruc- they find evidence to support their position and conclude that short-term traders are the cause of the U-shaped pattern in ture, the U-shaped trading pattern may be attributable to
variables that are exogenous to the market structure as noted volume.
Gerety and Mulherin (1992) mention anecdotal discussion in Brock and Kleidon (1992). Primary exogenous
considera-tions are variaconsidera-tions in supply and demand from investors and that attributes the U-shaped pattern to institutional investors. However, they observe a downward trend in last-hour volume the discontinuous nature of market trading. For example,
Brock and Kleidon argue that much of the trading at the open over the last several decades and a concurrent increase in block trading (to represent institutional trades) and suggest and close is due to the fact that investors cannot trade as
easily when major markets are closed. The incentive to transact that institutional traders do not cause the U-shaped pattern. However, the simple observation of a negative correlation at the opening and close may be related to the desire of
portfolio managers to bring their portfolios to a particular between these two variables is not proof of a causal relation-ship. It is quite possible that both institutional investors and target risk, a factor that is unrelated to the market
microstruc-ture. Another exogenous factor could be that market activity short-term traders are parties to the causes of the U-shaped pattern, especially if institutional investors represent the other is responding to the release of information. Berry and Howe
(1994) find distinct intraday patterns in the release of public side of the trades with short-term traders. It is our hypothesis in this article that a major part of the demand for opening information but conclude that they are only moderately related
to trading volume and not significantly related to price vari- and closing trades originates with institutional and other long-term investors, and short-long-term traders are willing to fill that ability. Other exogenous considerations relate to covering
short positions overnight (see Miller, 1989) and the desire of demand.
While these previous studies have proposed and examined portfolio managers of index funds to trade at the end of the
day to reduce tracking errors. Mutual fund managers, judged various causes of intraday trading patterns, none has been able to explain more than a small portion of the pattern. It by net asset value at the end of the day, also have some
incentive to correlate their trading patterns with their bench- is the intent of this article to further contribute to the evidence in this area by using a case study to illustrate the importance marks. Furthermore, brokers are often given orders which
must be filled by the end of the day or canceled. of the timing of transaction decisions by institutional portfolio managers and other long-term investors. These decisions Whether the causes of intraday return patterns lie with
external or internal (market microstructure) considerations, quickly become orders that impact the market and contribute to the formation of the daily U-shaped patterns observed in the fact remains that a predictive pattern is in place that
challenges market efficiency, although it is doubtful that a this article. As these intraday decisions are transmitted to security traders, they are translated into intraday volume, trading strategy could exploit the patterns to the extent of
producing superior after transactions-costs returns. Studies of variance, and price patterns.
Transactions data typically used in market studies identifies the return phenomenon have typically dealt with transactions
data from major exchanges such as the New York Stock Ex- only the time of the transaction, not the time of the decision to transact. To overcome this problem, our sample tracks change, the American Stock Exchange, and the Toronto Stock
Exchange. Since the data represent realized transactions, the the times at which portfolio managers made their decisions. Conversations with the portfolio managers led to the conclu-observed U-shaped pattern of returns and volume includes
both the external influence of investors and portfolio managers sion that the portfolio managers were, for the most part, indifferent to the problems and issues related to the traders who order the execution of trades for portfolio rebalancing
reasons and the internal influence of market makers and trad- (endogenous factors). Their concerns were related to rebalanc-ing their portfolios. The extent to which they weight their ers who attempt to minimize transaction costs and make
trad-ing profits. A shortcomtrad-ing of the use of aggregated market actions toward buying activities at market opening and market closing times in the absence of concerns about execution transactions data is that the external influence from portfolio
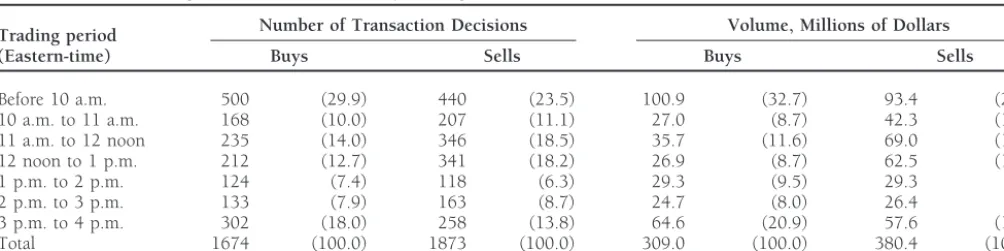
Table 1. Portfolio Manager Transaction Decisions by Trading Period, 1988 (Percent of Total in Parentheses)
Number of Transaction Decisions Volume, Millions of Dollars Trading period
(Eastern-time) Buys Sells Buys Sells
Before 10 a.m. 500 (29.9) 440 (23.5) 100.9 (32.7) 93.4 (24.6) 10 a.m. to 11 a.m. 168 (10.0) 207 (11.1) 27.0 (8.7) 42.3 (11.1) 11 a.m. to 12 noon 235 (14.0) 346 (18.5) 35.7 (11.6) 69.0 (18.1) 12 noon to 1 p.m. 212 (12.7) 341 (18.2) 26.9 (8.7) 62.5 (16.4) 1 p.m. to 2 p.m. 124 (7.4) 118 (6.3) 29.3 (9.5) 29.3 (7.7) 2 p.m. to 3 p.m. 133 (7.9) 163 (8.7) 24.7 (8.0) 26.4 (6.9) 3 p.m. to 4 p.m. 302 (18.0) 258 (13.8) 64.6 (20.9) 57.6 (15.1) Total 1674 (100.0) 1873 (100.0) 309.0 (100.0) 380.4 (100.0)
Any clustering of either buying or selling decisions at market the market open (9:30 a.m. Eastern time) to 10:00 a.m. Each open and close would affect volume at those times. of the other periods begins on the hour and lasts for one hour, so that there are a total of seven trading periods during the day.
Database and Methodology
Orders time-stamped before the open of trading are in-The Trust Division of NationsBank Dallas provided a sample cluded in the first time period. Even though these orders do of 3,547 equity transactions completed by the bank’s security not represent decisions made during the first trading period, traders during 1988. During that period, the bank had approx- this period is obviously the time during which these orders imately 25 portfolio managers. Their operation is such that flow into the market. Similarly, the first trading period con-as soon con-as the portfolio managers reach a decision to place tains all of the orders stamped after the close of trading from an order for a security transaction, they communicate to the
the previous day. trading desk by delivering a written ticket directing the trader
to initiate the purchase or sale of the security. The first task of the trader is to stamp the time of receipt of the written
Descriptive Statistics
order. Then, the trader enters into the market and begins to
Table 1 presents the 3,547 buy and sell decisions by portfolio “work” the order, searching for the best execution possible
managers broken down by trading period and classified into and trying to achieve execution of the order within a
reason-buys and sells measured by number of transactions and the ably short time. Most orders are completed within 30 minutes
dollar volume of the transaction. The percentage of each as of receipt by the trading desk.
a portion of the total is in parentheses. A scan of the table Thus, the time stamp on the order approximates the time
that the portfolio manager reached a transaction decision. It reveals that most of the decisions, as measured by both number also approximates the time that the trader began revealing of decisions and dollar value, occurred during the opening the order in the market. Thus, the important distinction of and closing periods of the day.
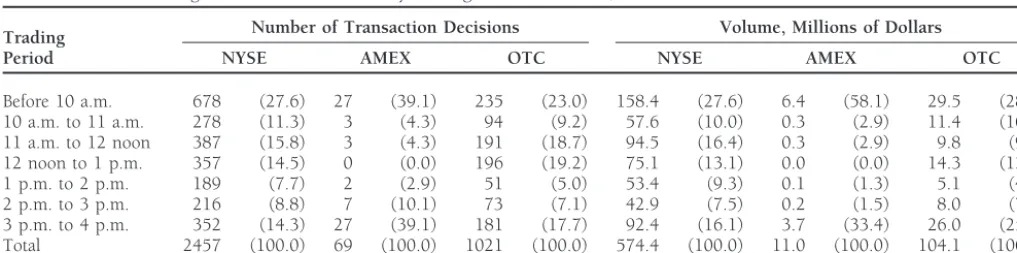
this data set is that observations represent times of decisions The 3,547 trading decisions generated transactions on 742 to trade, not necessarily transaction times. If demand and different stocks traded on the New York Stock Exchange supply from portfolio managers affect the pattern of intraday (NYSE), American Stock Exchange (AMEX), and the over-returns, then we would expect to see the U-shaped pattern the-counter markets (OTC). Table 2 shows these decisions occur in a metric that measures relative demand. In addition, broken down by trading location of the stock. A scan of this to the extent that the trading desk completes trades relatively table indicates that the tendency of portfolio managers’ trading soon after receipt, the volume of portfolio manager decisions decisions to cluster at the beginning and end of the day occurs should also exhibit the U-shaped pattern. for stocks traded in all locations.
Each observation in the sample contains the following
in-While Tables 1 and 2 indicate that there is a definite cluster-formation: (1) the time stamp, (2) whether the order was a
ing of trading decisions during the first and last trading periods buy or a sell, (3) the number of shares, (4) the stock symbol,
using aggregated data for the year, tests are necessary to show the trading location (New York Stock Exchange, American
the statistical significance of the U-shaped pattern. To accom-Stock Exchange, or over the counter), and (5) the execution
plish statistical tests of the buy and sell decisions, the aggre-price.
gated data in Tables 1 and 2 are not sufficient. To be useful for a statistical test, buy decisions for each period on each
Results
day should be compared to sell decisions during that sameperiod. This would give us an idea of the “relative demand” We divided the trading day into the same seven trading periods
Table 2. Portfolio Manager Transaction Decisions by Trading Location of Stock, 1988 (Percent of Total in Parentheses)
Number of Transaction Decisions Volume, Millions of Dollars Trading
Period NYSE AMEX OTC NYSE AMEX OTC
Before 10 a.m. 678 (27.6) 27 (39.1) 235 (23.0) 158.4 (27.6) 6.4 (58.1) 29.5 (28.4) 10 a.m. to 11 a.m. 278 (11.3) 3 (4.3) 94 (9.2) 57.6 (10.0) 0.3 (2.9) 11.4 (10.9) Total 2457 (100.0) 69 (100.0) 1021 (100.0) 574.4 (100.0) 11.0 (100.0) 104.1 (100.0)
NYSE5New York Stock Exchange; AMEX5American Stock Exchange; OTC5Over-the-counter markets.
made during each period of the trading day as a portion of
Statistical Tests
total dollar value of all transactions decisions (buy and sell To verify that a U-shaped pattern in returns existed during
decisions) during that day. Its definition is as follows: the year of the sample, we computed the returns on the Dow
Jones Industrial Average (DJIA) for each trading period and buy decision ratio (period i) averaged them for the year 1988. Table 3 presents these mean
5 total buy decisions in period i
total buy and sell decisions for the day DJIA returns. The hourly returns are high during the opening
and closing hours and lower during the middle trading hours.
We computed this ratio for each of the seven trading periods To test for the existence of a pattern for the variables
during which the NYSE is open. in this study, we use the chi-square approximation of the
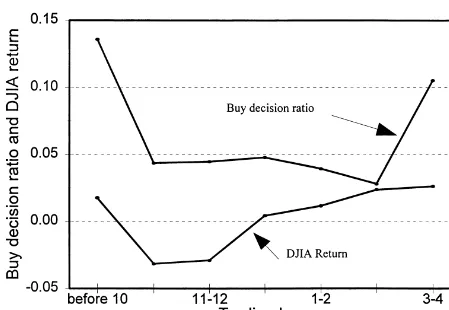
Figure 1 shows a definite U-shaped pattern in both the nonparametric Kruskal-Wallis test. This test identifies whether
mean buy-decision ratio and the DJIA returns, and Table 3 grouped data might have come from a single population. For
presents the numerical values. The buy-decision ratio begins the DJIA returns, the test statistic of 14.39 allows us to reject
the trading day with a value of 0.136 in the first time period, the null hypothesis that the returns observed over the different
falls to a low of 0.028 during the 2:00 to 3:00 hour, and rises trading hours originated from the same population at thea 5
to close at 0.105. The Kruskal-Wallis test statistic for the buy-0.05 level of significance. This existence of a significant pattern
decision ratios is 140.26, indicating a significant pattern exists verifies that market returns during 1988 exhibited the familiar
at thea 50.01 level.
U shape reported in other studies.
These results suggest that factors exogenous to the market To measure the relative demand behavior of portfolio
man-trading mechanism may contribute to the pattern of intraday agers in the sample, we computed a “buy decision ratio” for
returns. In particular, the relative frequency of buy and sell each of the seven trading periods for each day. The buy
decisions of the institutional investor follows the same decision ratio represents the dollar value of the buy decisions
Table 4. Mean Volume of Portfolio Managers Decisions to Trade
Table 3. Daily Mean Dow Jones Industrial Average Returns and
by Intraday Time Period, 1988a
Buy-Decision Ratios by Intraday Time Period, 1988a
Mean Volume Dow Jones Industrial Time Period
Time Period Average Return Buy-Decision Ratio (Eastern time) Share-Volume Ratio Dollar-Volume Ratio
(Eastern time) (1) (2)
Before 10 a.m. 0.278 0.268 Before 10 a.m. 0.018 0.136 10 a.m. to 11 a.m. 0.109 0.115 10 a.m. to 11 a.m. 20.031 0.044 11 a.m. to 12 noon 0.138 0.140
11 a.m. to 12 noon 20.029 0.045 12 noon to 1 p.m. 0.157 0.152
12 noon to 1 p.m. 0.004 0.044 1 p.m. to 2 p.m. 0.071 0.078 1 p.m. to 2 p.m. 0.012 0.048 2 p.m. to 3 p.m. 0.078 0.073 2 p.m. to 3 p.m. 0.024 0.028 3 p.m. to 4 p.m. 0.169 0.175 3 p.m. to 4 p.m. 0.026 0.105 Kruskal-Wallis test 188.88a 183.32a
Kruskal-Wallis test 14.39* 140.26**
* Significant at thea 50.01 level.
aThe mean share-volume ratio is the total share volume during that time period as a
*Significant at thea 50.05 level.
** Significant at thea 50.01 level. proportion of total share volume for that day. The dollar-volume ratio is the dollar
volume of decisions made during that time period as a proportion of the total dollar
aThe buy-decision ratio represents buy decisions during that time period as a proportion
of total buy and sell decisions for that day. The before 10 buy-decision ratio includes volume of all transactions decisions for that day. The before 10 values includes all decisions made after the close of trading on the previous day and before 10 a.m. Eastern all decisions made after the close of trading on the previous day and before 10 a.m.
Eastern time. The Kruskal-Wallis test statistic is for the null hypothesis that the buy- time. The Kruskal-Wallis test statistic is for the null hypothesis that the volume ratio in all time periods originated from the same population.
Figure 1. Daily mean Dow Jones Industrial Average returns and buy-decision ratios by intraday time period, 1988.
U-shaped pattern as do returns. However, it is also important during the trading period as a portion of the total decisions to transact for the day.
that when higher returns occur on the DJIA during a particular
We computed total transactions ratios using both the num-trading period on a given day, they are simultaneously
associ-ber of shares (the “share-volume ratio”) and the total dollar ated with a high level of buy decisions. To test for an
associa-value (the dollar-volume ratio”). Table 4 presents these ratios. tion between concurrent returns and buy decisions, we
esti-As is evident from the table, both of the volume measures are mated the correlation between the buy-decision ratio and
highest during the market open period and the market closing the return on the DJIA using the buy-decision ratio and its
hour, and they are at their lowest during mid-day hours. Note corresponding DJIA return for each trading period of each
that on average over one-quarter of all transactions decisions day in the sample. Because the data (particularly the
buy-entered into the market during the first trading period of the decision ratios) are not normally distributed, we computed
day. The Kruskal-Wallis test indicates a significant pattern in the nonparametric Spearman rank correlation coefficient. Its
both ratios at thea 5 0.01 level.
value was 0.159, which is significantly different from zero at thea 50.05 level, allowing us to conclude that there was a
significant relationship between the level of buy decisions and DJIA returns during this sample.
Summary and Conclusion
In addition to examining returns, we checked for theof Intraday and Day-of-the-Week Mean Effects.Review of Financial
sell decisions of an institutional investor and the time at which
Studies2 (1989b): 189–223.
they were made shows that buy decisions tend to be
concen-Berry, Thomas D., and Howe, Keith M.: Public Information Arrival.
trated during the market opening and closing hours, the same
Journal of Finance49 (September 1994): 1331–1346.
time when stocks tend to show higher-than-average returns.
Brock, William A., and Kleidon, Allan W.: Periodic Market Closure
There was a statistically significant relationship between the and Trading Volume.Journal of Economic Dynamics and Control, relative number of buy decisions and the intraday DJIA re- 16 (July/October 1992): 451–489.
turns. In addition, the volume of portfolio manager decisions Foster, F. Douglas, and Viswanathan, S.: A Theory of the Interday (buy and sell) tends to be concentrated during the opening Variations in Volume, Variance, and Trading Costs in Securities
Markets.Review of Financial Studies4 (1989): 593–624.
and closing hours, coinciding with results from prior studies
Garman, Mark: Market Microstructure.Journal of Financial Economics
that report a higher volume of transactions during opening
3 (1976): 257–275.
and closing hours. These results are consistent with the notion
Gerety, Mason S., and Mulherin, J. Harold: Trading Halts and Market
that the actions of portfolio managers contribute to the
intra-Activity: An Analysis of Volume at the Open and the Close.Journal
day pattern of volume. of Finance47 (December 1992): 1765–1784.
Although the behavior of other institutional investors may Harris, Lawrence: A Transaction Data Study of Weekly and Intradaily not follow the same patterns as the institution (NationsBank) Patterns in Stock Returns.Journal of Financial Economics16 (May
1986): 99–117.
in this case study, it is reasonable that the association between
Harris, Lawrence: A Day-end Transaction Price Anomaly,Journal of
timing of buy and sell decisions of our institution and market
Financial and Quantitative Analysis24 (March 1989): 29–45.
returns and trading volume is more than coincidence. Portfolio
Jain, Prem C., and Joh, Gun-Ho: The Dependence Between Hourly
managers probably follow a systematic pattern in the tendency
Prices and Trading Volume.Journal of Financial and Quantitative
of their transaction decisions, particularly their buy decisions,
Analysis23 (September 1988): 269–283.
during the time before the market opens, the opening period,
Lockwood, Larry J., and Linn, Scott C.: An Examination of Stock
the closing period, and the time after the market closes. Market Return Volatility During Overnight and Intraday Periods While Gerety and Mulherin (1992) mention that institu- (1964–1989).Journal of Finance45 (June 1990): 591–601.
tional investors could influence daily trading patterns, they McInish, Thomas H., and Wood, Robert A.: An Analysis of Transac-tions Data for the Toronto Stock Exchange: Return Patterns and
attribute end-of-day volume to short-term traders. Our
evi-End-of-the-day Effect.Journal of Banking and Finance14 (1990):
dence in this article shows that institutional investors provide
441–458.
formidable demand at the end of the day. While short-term
McInish, Thomas H., and Wood, Robert A.: Hourly Returns, Volume,
traders may be on the other sides of those transactions, it is Trade Size, and Number of Trades.Journal of Financial Research clear that the fundamental demand arises from the institutional 14 (Winter 1991): 303–315.
investors. This supports the contention of Brock and Kleidon McInish, Thomas H., and Wood, Robert A.: An Analysis of Intraday
Patterns in Bid/ask Spreads for NYSE Stocks.Journal of Finance
(1992) that forces exogenous to market microstructure
pro-47 (June 1992): 753–764.
vide demand or supply imbalances that could lead to observed
Miller, E. M.: Explaining Intraday and Overnight Price Behavior.
daily trading patterns.
Journal of Portfolio Management(Summer 1989): 10–16. Smirlock, Michael, and Starks, Laura: Day-of-the-week and Intraday
The authors thank Mason Gerety, Larry Lockwood, and Ken Martin for their
Effects in Stock Returns.Journal of Financial Economics17
(Sep-comments and suggestions. All opinions and any errors that may have crept tember 1986): 197–210. into the article are the responsibility of the authors.
Stoll, Hans R., and Whaley, Robert E.: Stock Price Structure and Volatility.Review of Financial Studies3 (1990): 37–71.
Wei, Pei-Hwang: Intraday Variations in Trading Activity, Price
Vari-References
ability, and the Bid-Ask Spread.Journal of Financial Research15 Admati, Anat R., and Pfleiderer, Paul: A Theory of Intraday Patterns: (Fall 1992): 265–276.
Volume and Price Variability.Review of Financial Studies1 (1989a): Wood, Robert A., McInish, Thomas H., and Ord, Keith: An Investiga-41–66. tion of Transaction Data for NYSE Stocks.Journal of Finance40