253 (2000) 49–62
www.elsevier.nl / locate / jembe
Genetic structure of populations of the red sea urchin,
Strongylocentrotus franciscanus
a,b ,* a,b a,c a,b
Patty Debenham , Mark Brzezinski , Kathy Foltz , Steven Gaines
a
Marine Science Institute, University of California, Santa Barbara, CA 93106, USA b
Department of Ecology, Evolution, and Marine Biology, University of California, Santa Barbara, CA93106, USA
c
Department of Molecular, Cellular, and Developmental Biology, University of California, Santa Barbara, CA93106, USA
Received 15 January 2000; received in revised form 15 March 2000; accepted 26 June 2000
Abstract
Population subdivision was evaluated in the red sea urchin, Strongylocentrotus franciscanus, using DNA sequence data from 134 adult individuals collected in 1995 and 1996. On average 22 individuals were sequenced from six geographic locations between Alaska and Baja California (N5134), nearly the full extent of the species range. DNA sequence data was obtained from direct sequencing of a 273 base pair region of the bindin gene, which encodes a sperm fertilization protein. Results indicate that bindin is sufficiently polymorphic to serve as a genetic marker. We identified 14 unique alleles present in the entire range sampled with a maximum of eight alleles at a specific site. Mean pairwise comparison of the 14 unique alleles indicates moderate sequence diversity ( p-distance51.06). Although there is conflicting evidence to suggest that Alaska populations may deviate from the Hardy–Weinberg expectations, analysis of bindin genotype frequencies indicate that it is not possible to reject the null hypothesis of random mating throughout the species range. The results of a chi-square test with pooling conform to Hardy– Weinberg expectations for all populations (P.0.05) except for the Alaska population (P5
0.037). Inbreeding coefficients are consistent with this result and suggest that for the bindin locus, there is high gene flow. These results are compared with previously published results of genetic substructuring in sea urchins to examine relationships among population structure, dispersal potential and biogeography. 2000 Elsevier Science B.V. All rights reserved.
Keywords: Bindin; DNA sequencing; Pacific Coast; Population genetics; Urchin
*Corresponding author. Present address: National Center for Ecological Analysis and Synthesis, 735 State Street, Suite 300, Santa Barbara, CA 93101, USA. Tel.: 11-805-892-2518; fax: 11-805-892-2510. E-mail address: [email protected] (P. Debenham).
1. Introduction
Throughout its species range off the Pacific Coast of North America, the red sea urchin, Strongylocentrotus franciscanus, is important both ecologically and economical-ly. Kelp forest communities are characterized by strong species interactions between primary producers (such as Macrocystis sp. and Pteryogophora sp.), herbivores such as urchins (Strongylocentrotus sp.) and abalone (Haliotis sp.) and secondary consumers such as sea otters (Enhydra lutris) and spiny lobsters (Estes et al., 1982). Because red sea urchins are a valuable export product, there has been rapid growth in the commercial fishery since its inception in California in 1971 (Leet et al., 1992). An understanding of the genetic structure of this widespread and ecologically important species will aid ecologists and population geneticists and may force re-evaluation of current management practices, which assume genetic homogeneity throughout the species range (Duffy, personal communication).
The range of red sea urchins, S. franciscanus, extends from Northern Japan to Alaska and Baja California, Mexico (Morris et al., 1980). Throughout this range, red sea urchin spawning is concentrated in the spring with suspected release of gametes year-round (Strathmann, 1978; Schroeter et al., 1992). The planktotrophic red sea urchin larvae have a long pelagic stage that lasts from 61 to 131 days (Strathmann, 1978). Therefore, a red sea urchin larva traveling in the California current (average velocity approximately 0.10 m / s, Lynn and Simpson, 1990) could traverse a total distance exceeding 1000 km before settlement. These oceanographic factors suggest the potential for high dispersal, large gene flow and genetic homogeneity (Scheltema, 1971).
Despite the potential for long distance dispersal leading to high gene flow, previous studies of genetic structure in other marine organisms with pelagic larvae suggest the simple assumption that species with long lived planktonic larvae will be genetically homogeneous is often unfounded. Burton (1983) reviewed several cases where electro-phoretic data indicated local genetic heterogeneity despite long planktonic life history stages. Some of these organisms included the sea urchin Arbacia punctulata (Marcus, 1977), the lobster Homarus americanus (Tracey et al., 1975) and the mussel Mytilus edulis (Koehn, 1975).
Potential biotic and abiotic factors can drastically reduce larval movement away from natal populations. Oceanographic features such as eddies, gyres and countercurrents may retain larvae for their entire larval period. The presence of boundary currents and fronts can act as physical barriers to dispersal (Ward, 1989). Differential selection against specific genotypes once larvae settle on the bottom can differentiate populations with multiple sources of parent populations (Hartl and Clark, 1989). Behaviors such as vertical migration, swimming, and benthic residence can also keep larvae closer than expected to parent populations (Raimondi and Keough, 1990). These biological and oceanographic characteristics could result in red sea urchin genetic differentiation despite their long planktonic stage.
on location and year. For example, larvae settle at the Orange County site in southern California approximately every other month, yet at Point Cabrillo in northern California, there has been only one substantial recruitment event in 3 years (Schroeter et al., 1992). It is possible that these geographic variations in settlement imply that there are barriers to larval movement that restrict genetic exchange between populations with different settlement patterns.
To investigate the population structure of red sea urchins, this work uses a seemingly unusual population marker, the gamete interaction molecule bindin (Vacquier et al., 1995). Like other traits associated with fitness, gamete interaction molecules are assumed to be under strong selection (Li and Graur, 1991). In studies of population genetics, an appropriate genetic marker is sufficiently polymorphic to detect genetic differences and the polymorphisms are the result of neutral evolution rather than selection (Hartl and Clark, 1989). Work in several laboratories has identified high levels of interspecific sequence variation in gamete interaction molecules such as sea urchin bindin and abalone lysin (Metz and Palumbi, 1996; Vacquier et al., 1997). Additionally, recent examination of red urchin bindin sequence variation suggests that the portion of the bindin molecule used for this study is evolving neutrally (Debenham et al., in press and see Section 4). Thus, the bindin locus serves as a good marker for population genetics of S. franciscanus.
Based on the stochastic nature of dispersal, settlement, selection and recruitment, it is not possible to predict a priori whether Pacific coast red sea urchin populations are genetically differentiated or homogeneous. Analysis of DNA sequence data here shows that although the region of the bindin gene examined has sufficient polymorphism to detect genetic structure, there is no evidence for geographic substructuring in red sea urchin populations between Alaska and Baja California, Mexico. Additionally, although Alaska populations may deviate from Hardy–Weinberg expectations, the remaining five populations clearly conform to Hardy–Weinberg equilibrium expectations.
2. Materials and methods
2.1. Sample collection
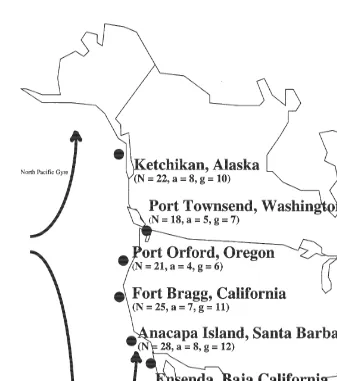
Between August 1995 and February 1996, we collected 298 adult S. franciscanus. Approximately 50 animals were collected from each of six sites: Ketchikan, AK; Port Townsend, WA; Port Orford, OR; Ft. Bragg, CA; Santa Barbara, CA and Ensenada, Baja California, Mexico (Fig. 1). All animals were collected from a depth range of 10–15 m using SCUBA and then shipped overnight to the laboratory. To ensure that all individuals were adults, the test diameter was at least 80 mm (Morris et al., 1980).
2.2. DNA extraction
pre-Fig. 1. Strongylocentrotus franciscanus. Six sampling locations of populations located along the Pacific Coast of North America. Numbers under sampling location indicate number of individuals sequenced (N ), number of alleles (a) and number of genotypes ( g) identified at each sampling location. For entire species range N5134, a514 and g521.
of 70% ethanol, 10 mM ammonium acetate, dried and resuspended in 20–30 ml of Tris–EDTA pH 8.0 containing 1 ml of RNAse (10 mg / ml).
2.3. Double-stranded PCR amplification
To obtain DNA sequences and determine allele and genotype frequencies, we directly sequenced PCR products (for both the 59 and 39 direction) that were created by asymmetric single-stranded amplification. The primers FNbindin59(59 -AGTCGACGTT-CGACAGACGAC-39) and FNbindin39(59-TTACATGGTCCATTATAGTATGCC-39) amplify a 431 base pair region at the 59 end of the bindin cDNA and the first intron. Amplification followed standard procedures (Saiki et al., 1988) in that we used a reaction volume of 25ml and a final MgCl concentration of 2 mM. The thermocycler2 (Perkin Elmer Cetus, Norwalk, CT, USA) profile for all double stranded reactions was: one cycle of 958C for 5 min, followed by 30 cycles of 948C for 1 min, then 608C for 1 min and 728C for 2 min. Each PCR reaction was resolved on a 2% Nu Sieve agarose (FMC, Inc., Rockland, ME, USA) and the PCR product gel isolates were stored at 2208C.
2.4. Single-stranded PCR amplificationand direct sequencing
Each gel isolate was heated to 658C for approximately 5–10 min and used as template for the single-stranded PCR amplification. The amplification conditions were identical to those above for amplification of the double-stranded products except that the 59primer (FNbindin 59) was used at a final concentration of 0.5mM as opposed to 10mM used in the double-stranded reaction. The amplification conditions to amplify the 39 single-stranded product required a lower annealing temperature (588C) and a lower MgCl2 concentration (1.2 mM was the final concentration). The concentration of the 39limiting primer was 2.5 uM. The single-stranded PCR products were washed in Centricon filter units (30 000 MWCo; Amicon, Inc.) and resuspended in 7 ml of H O for Sanger2 dideoxy sequencing (Sequenase ver. 2.0, U.S. Biochemical, Cleveland, OH, USA) with internal sequencing primers Ktseq59(59-GGAGCGCGTAAGAAGCGTTAT-39) and Ktseq39(59-ATACACACGATGGTCAAG-39).
2.5. Cloning of bindin DNA from heterozygous individuals
Hare and Palumbi (1999) identified that 2 out of 30 PCRs products from diploids amplified one allele. If this were the case in this work, approximately 8 or 9 of the individuals scored as heteroygotes could have been falsely scored as homozygotes. It is important to identify this possible source of error that could impact detected allele frequencies.
Double-stranded PCR products were amplified with primers KBRS59(59 -CGCGGAT-CCAGTCGACGTTCGACAGACGAC-39) and KBRS39(59 -GCCAAGCTTTTACATG-GTCCATTATAGTATGCC-39), incorporating restriction sites to facilitate directional cloning. PCR products were resolved on 2% agarose gel, and the excised fragment was purified using Quiaquick spin columns (Quiagen, Valencia, CA, USA) and then digested with BamHI and HindIII. The fragment was ligated into pBMKS (Stratagene) and transformed into E. coli DH5a. Plasmid DNA was purified with the alkaline lysis method (Sambrook et al., 1989), and the inserts were sequenced on both strands. The DNA from at least four transformants was sequenced for each PCR product. PCR products from several individuals with the same genotype but from different geographic locations were cloned and sequenced to verify sequence consistency among alleles found at different geographic locations.
2.6. Sequence and statistical analyses
Sequences were aligned with Seq-Ap ver 1.9a multiple sequence alignment program for the Macintosh (Gilbert, 1994). Molecular Evolutionary Genetic Analysis ver. 1.01 (MEGA, Kumar et al., 1993) was used to calculate nucleotide sequence divergence. Individual genotypes were coded as paired alphabetical characters and analyzed with BIOSYS (Swofford, 1989) to obtain estimates of the following: allele frequencies, conformance to Hardy–Weinberg equilibrium, Wright’s (1978) F-statistics and Nei’s (1972) minimum genetic distance in pairwise comparisons. The phylogenetic relation-ship of the 14 unique alleles was determined by a parsimony analysis (PAUP, Swofford and Begle, 1993).
Conformance to Hardy–Weinberg proportions was estimated using a chi-square test with pooling of rare and common categories. This method was chosen because of a relatively high number of rare singleton alleles. Qualitatively similar conclusions are obtained using other analytical tests such as a contingency chi-square analysis with Levene’s (1949) correction for small sample size, a significance test with exact probabilities, and a Monte Carlo simulation of a chi-square contingency test as per Roff and Bentzen (1989) performed using 1000 runs (data not shown). Average hetero-zygosity was calculated using BIOSYS, Swofford, 1989.
3. Results
Table 1
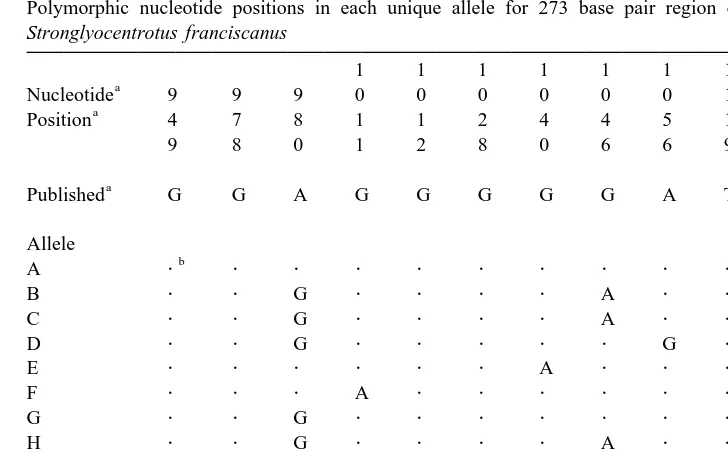
Polymorphic nucleotide positions in each unique allele for 273 base pair region of the bindin gene for Stronglyocentrotus franciscanus
As reported in Minor et al. (1991). b
Indicates identity with published sequence.
number of alleles per sampling site ranged from four to eight. The number of genotypes at each geographic location ranged from 6 to 12, with a mean of nine genotypes per site. There was no obvious trend in the number of alleles or the number of genotypes at a geographic location.
Within the 273 base pair region examined in 134 individual red urchins, there were a total of 13 variable nucleotide positions in all 14 alleles (Table 1). The number of nucleotide differences between any two sequences is low, ranging between one (0.35%) and six (2.1%) nucleotide substitutions in the 273 base pair region. On average, there are 2.9 nucleotide positions that vary between any two unique alleles. The average nucleotide-sequence diversity is 1.06% (Tajima and Nei, 1984, excluding correction for multiple hits). Efforts to evaluate the phylogenetic relationship of the 14 unique alleles showed no supportable allelic geneologies (data not shown).
Table 2
a Allele frequency data of 14 unique alleles (A–N) from six geographic locations
Allele AK WA OR NC SB BJ Total Total no. of allele
(N522) (N518) (N521) (N525) (N528) (N520) (N5134) copies in all pops.
A 0.545 0.528 0.548 0.480 0.500 0.475 0.511 137
B 0.205 0.167 0.167 0.120 0.143 0.150 0.160 43
C 0.114 0.194 0.214 0.240 0.143 0.275 0.201 54
D 0.045 0.083 0.071 0.100 0.125 0.075 0.078 21
E 0.000 0.000 0.000 0.020 0.000 0.000 0.004 1
F 0.000 0.000 0.000 0.020 0.018 0.000 0.007 2
G 0.023 0.028 0.000 0.000 0.036 0.000 0.011 3
H 0.023 0.000 0.000 0.000 0.000 0.000 0.004 1
I 0.000 0.000 0.000 0.000 0.000 0.025 0.004 1
J 0.000 0.000 0.000 0.020 0.000 0.000 0.004 1
K 0.000 0.000 0.000 0.000 0.018 0.000 0.004 1
L 0.023 0.000 0.000 0.000 0.000 0.000 0.004 1
M 0.023 0.000 0.000 0.000 0.000 0.000 0.004 1
N 0.000 0.000 0.000 0.000 0.018 0.000 0.004 1
a
AK5Alaska, WA5Washington, OR5Oregon, NC5Northern California, SB5Santa Barbara, BJ5
Baja California, Mexico.
this analysis (data not shown) indicated that the total number of alleles at each location was reaching a plateau and that further sampling would not likely increase the number of alleles significantly. Thus, the sample sizes presented here are sufficient for estimating the number of alleles present in natural populations.
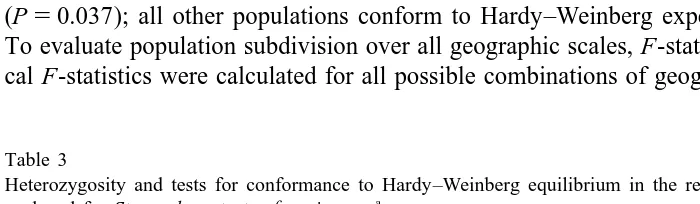
Analysis of genotype frequencies in Alaska using a chi-square statistic with pooled data (see Section 4) indicated a significant deviation from Hardy–Weinberg expectations (P50.037); all other populations conform to Hardy–Weinberg expectations (Table 3). To evaluate population subdivision over all geographic scales, F-statistics and hierarchi-cal F-statistics were hierarchi-calculated for all possible combinations of geographic location. All
Table 3
Heterozygosity and tests for conformance to Hardy–Weinberg equilibrium in the region of the bindin gene a
analyzed for Strongylocentrotus franciscanus
AK WA OR NC SB BJ
Heterozygosity
Direct count 0.818 0.722 0.667 0.680 0.714 0.600
(% of pop. heterozygous)
Estimate based on HW expectation 0.644 0.648 0.621 0.686 0.691 0.670 b
Unbiased estimate 0.659 0.667 0.636 0.700 0.704 0.687
c
D 0.242 0.083 0.047 20.029 0.015 20.127
d
Hardy–Weinberg statistics (P-values) 0.037 0.402 0.88 0.768 0.509 0.147 a
combinations of regional grouping were statistically insignificant (all data not shown, however, all values for Fst#0.008). For example, analysis of Alaska as one group versus a second grouping of Washington, Oregon, Northern California, Santa Barbara and Baja California, Mexico indicated insignificant deviations from zero.
4. Discussion
It is unusual to use a gamete interaction molecule, such as bindin, as a population marker. An appropriate genetic marker is moderately polymorphic and these poly-morphisms are the result of neutral evolution and not directed selection (Hartl and Clark, 1989). Most traits associated with reproductive success are assumed to have low intraspecific genetic variation as a result of purifying selection (Li and Graur, 1991). As stated previously, detailed analysis of intraspecific variation in the portion of the bindin locus used here suggests that this portion of the bindin molecule is evolving as a result of neutral evolution (Debenham et al., in press). To summarize the results of Debenham et al. (in press), it was not possible to reject the null hypothesis that sequence variation observed in S. franciscanus bindin is a result of neutral evolution. Statistical evaluation of expected proportions of replacement and silent nucleotide substitutions, observed versus expected proportions of radical replacement substitutions, Tajima and Nei’s (1984) T-test, and conformance to the McDonald and Kreitman (1991) test of neutral evolution, all fail to reject the neutral origin of observed polymorphisms for bindin. All of these data presented in Debenham et al. (in press) suggest that the polymorphism observed in bindin is most likely the result of neutral random mutations and that selection is not confounding the pattern of genetic heterogeneity.
As suggested by this and previous work on bindin (Vacquier et al., 1995; Metz and Palumbi, 1996), the bindin locus does appear to be an acceptable genetic marker with sufficient polymorphism to detect genetic structure. All six populations of S. francis-canus are highly polymorphic with at least four and up to eight alleles at a single geographic site. With the amount of polymorphism present in bindin, genetic isolation could result in changes in gene frequencies over evolutionary time periods. Although bindin sequence variation (1.06%) is moderate, it is approximately equal to variation in mtDNA (COI) examined in S. purpuratus, S. droebachiensis and Echinometra sp. (Palumbi and Wilson, 1990; Palumbi and Metz, 1991; Edmands et al., 1996; Palumbi et al., 1997).
One of the major biogeographic features along the Pacific coast is Point Conception, a prominent headland (Fig. 1). As a major boundary of the Oregonian and Californian biogeographic provinces (Valentine, 1973), Point Conception divides two regions with disparate sets of co-occurring species and marks the limit of distribution for many species. It is hypothesized that biogeographic boundaries can also be boundaries for gene flow and result in population subdivision (see Briggs, 1958, 1974; Avise, 1994; Palumbi, 1995). The California Current, flowing predominantly southward from Alaska to Baja California, turns seaward at Point Conception, potentially demarcating northern and southern water masses (Hickey, 1979). For a species existing on a linear coastline with a unidirectional current, genetic isolation created by Point Conception would predict a greater amount of genetic variation in the south compared to the north. Burton (1998) reviewed the available literature regarding interspecific phylogeography across Point Conception and failed to find any correspondence between genetic differentiation and Point Conception.
Based on the results of a hierarchical analysis of F-statistics, no regional genetic patterns are apparent in S. franciscanus nuclear DNA. Similarly, southern populations of S. purpuratus are apparently not genetically isolated from populations north of Point Conception (Palumbi and Wilson, 1990; Palumbi and Kessing, 1991; Edmands et al., 1996). Although flow of the California Current is predominantly southward, reversals in flow direction are quite common (Pirie et al., 1975). As a result of an El Nino Southern Oscillation (ENSO) event, warm tropical waters can travel past Point Conception as far north as Vancouver Island (Crowe and Schwartzlose, 1972). In addition, every winter, the southern California and Davidson Counter currents send water from southern California northward (Hickey, 1979). Homogeneity throughout the range examined here suggests that S. franciscanus larvae are able to move south with the California Current as well as north with either a periodic ENSO event or annually with the Davidson Counter current.
Unlike the five other S. franciscanus sampling sites, the Alaska site does not conform to Hardy–Weinberg expectations. One explanation for this observation is that mating is non-random in the Alaska population. It is also possible that selection results in a deviation from Hardy–Weinberg equilibrium.
Whereas the above work examined large geographic ranges, Edmands et al. (1996) examined genetic variation in much larger sample sizes from the southern part of the distribution of S. purpuratus. Their sequence data of a mtDNA gene revealed a significant heterogeneity among locations with a contingency chi-square analysis
2
(Edmands et al., 1996; N5147, X 5115.05 df590, P,0.05). Analyzing the same data with an Analysis of Molecular Variance, AMOVA (Excoffier et al., 1992), Edmands et al. (1996) did not find significant differentiation among locations (Fst50.017, P.0.05). However, based on a regional analysis, there was a statistically significant genetic break approximately 300 km south of Pt. Conception in central California (Fst50.064, P,0.05).
Moberg and Burton (in press) examined the population structure of adult and juvenile size classes for S. franciscanus. Like those presented here, their results indicate that there is no regional pattern of differentiation in the red sea urchin. However, on smaller geographic scales, neighboring populations were often more differentiated than distant populations. Interestingly, recruit samples differed significantly from adult samples and showed extensive between-year variation. These results indicated less mixing of the larval pool than would be predicted for organisms with a life hitory stage that includes long residence times in the water column. The authors suggest that pre- and post-settlement selection and high interfamily variance in reproductive success might contribute to the observed genetic differences between adults and new recruits.
Analysis of DNA sequences in a segment of the bindin gene in red sea urchin populations along the Pacific Coast of North America (except for a possible exception in Alaska populations) suggests that there is no apparent regional subdivision of this species. These results imply that current assumptions (that the red sea urchin is one randomly mating population) made in relation to the management of red sea urchin populations may be sufficient. However, geographic variation in settlement and adult dynamics along the species range suggests that different sections along the coast have very different ecological dynamics, which could likely warrant regional management plans. Therefore, although the work here suggests that over long evolutionary time scales, there is a large amount of genetic exchange, Moberg and Burton’s (in press) result of local heterogeneity supports the possibility that over ecological and intergenera-tional time scales, genetic exchange may be limited. Thus local populations are more isolated than larval dynamics may suggest, which would also warrant regional management plans.
Acknowledgements
Marthaler, Dave Kushner, Keith Duran, Michael Ellis, and Tim Minicucci. The following individuals assisted in sample dissection: Yama Abassi, Shelly Adams, Scott Aiken, Richelle Feldan, Andy Giusti, students at Fort Bragg High School, Beth Hinkle, Kenneth Hoang, Mel Kelley, Linda O’Bryan, and Rebecca Shipe. This work was supported in part by a Saltonstall-Kennedy grant from the National Oceanic and Atmospheric Administration. [RB]
References
Avise, J.C., 1994. Molecular Markers, Natural History and Evolution. Chapman and Hall, New York. Briggs, J.C., 1958. A list of Florida fishes and their distribution. Bull. Fla. State Mus. Biol. Sci 2, 223–318. Briggs, J.C., 1974. Marine Zoogeography. McGraw-Hill, New York.
Britten, R.J., Cetta, A., Davidson, E.H., 1978. The single-copy DNA sequence polymorphism of the sea urchin Strongylocentrotus purpuratus. Cell 15, 1175–1186.
Burton, R.S., 1983. Protein polymorphisms and genetic differentiation of marine invertebrate populations. Mar. Biol. Letts. 4, 193–206.
Burton, R.S., 1998. Intraspecific phylogeography across the Point Conception biogeograhic boundary. Evolution 52, 734–745.
Crowe, F.J., Schwartzlose, R.A., 1972. Release and Recovery Records of Drift Bottles in the California Region, 1955 Through 1971. California Cooperative Oceanic Fisheries Atlas, Vol. 16. Marine Research Committee, State of California.
Debenham, P., Foltz, K.R., Brzezinski, M.A., in press. Intraspecific sequence variation in the bindin locus of Strongylocentrotus franciscanus: implication for diversity enhancing selection in sea urchins. J. Mol. Evolu. Edmands, S., Moberg, P.E., Burton, R.S., 1996. Allozyme and mitochondrial DNA evidence of population
subdivision in the purple sea urchin Strongylocentrotus purpuratus. Mar. Biol. 126, 443–450.
Estes, J.A., Jameson, R.J., Rhose, E.B., 1982. Activity and prey selection in the sea otter: Influence of population status on community structure. Am. Nat. 120, 242–258.
Excoffier, L., Smouse, P.E., Quattro, J.M., 1992. Analysis of molecular variance inferred from metric distances among DNA haplotypes: application to human mitochondrial DNA restriction data. Genetics 131, 479–491. Gilbert, D., 1994. SeqApp. Multiple Sequence Alignment Program. Indiana State University.
Hare, M., Palumbi, S.R., 1999. The accuracy of heterozygous base calling from diploid sequence and resolution of haplotypes using allele-specific sequencing. Mol. Ecol. 8, 1750–1752.
Hartl, D.L., Clark, A.G., 1989. Principles of Population Genetics. Sinauer Assoc, Sunderland, MA. Hickey, B.M., 1979. The California Current system – hypotheses and facts. Prog. Oceanog. 8, 191–279. Koehn, R.K., 1975. Migration and population structure in the pelagically dispersing marine invertebrates,
mytilus edulis. In: Market, C.L. (Ed.). Isozymes, Vol. 4. Academic Press, NY, pp. 945–959.
Kumar, S., Tamura, K., Nei, M., 1993.MEGA: Molecular Evolutionary Genetics Analysis. The Pennsylvania State University, University Park, PA.
Leet, W.S., Dewees, C.M., Haugen, C.W., 1992. California’s Living Marine Resources and Their Utilization. California Sea Grant, Davis, California.
Levene, H., 1949. On a matching problem arising in genetics. Ann. Math. Stat. 20, 91–94. Li, W.-H., Graur, D., 1991. Fundamentals of Molecular Evolution. Sinauer Assoc, Sunderland, MA. Lynn, R.J., Simpson, J.J., 1990. The flow of the undercurrent over the continental borderland off southern
California. J. Geophy. Res. 95, 12995–13008.
Marcus, N.H., 1977. Genetic variation within and between geographically separate populations of the sea urchin, Arbacia punctulat. Biol. Bull. 153, 560–576.
McDonald, J.H., Kreitman, M., 1991. Adaptive protein evolution at the Adh locus in Drosophila. Nature 351, 652–654.
Milligan, B.G., 1992. Plant DNA isolation. In: Hoelzel, A.R. (Ed.), Molecular Genetic Analysis of Populations. IRL Press, Oxford, pp. 71–74.
Minor, J.E., Fromson, D.R., Britten, R.J., Davidson, E.H., 1991. Comparison of the bindin proteins of Strongylocentrotus franciscanus, S. purpuratus, and Lytechinus variegatus: sequences involved in the species specificity of fertilization. Mol. Biol. Evol. 8, 781–795.
Moberg, P.E., Burton, R.S., in press. Genetic heterogeneity among recruit and adult red sea urchins, Strongylocentrotus franciscanus. Mar. Bio.
Morris, R.H., Abbott, D.P., Haderlie, E.C., 1980. Intertidal Invertebrates of California. Stanford University Press, Stanford, CA.
Nei, M., 1972. Genetic distance between populations. Am. Nat. 106, 283–292.
Nei, M., 1978. Estimation of average heterozygosity and genetic distance from a small number of individuals. Genetics 89, 583–590.
Palumbi, S.R., 1995. Using genetics as an indirect estimator of larval dispersal. In: McEdward, L.R. (Ed.), The Ecology of Marine Invertebrate Larvae. CRC Press, pp. 369–387.
Palumbi, S.R., Grabowsky, G., Duda, T., Geyer, L., 1997. Speciation and population genetic structure in tropical Pacific sea urchins. Evolution 51, 1506–1517.
Palumbi, S.R., Kessing, B.D., 1991. Population biology of the trans-Arctic exchange: mtDNA sequence similarity between Pacific and Atlantic sea urchins. Evolution 45, 1790–1805.
Palumbi, S.R., Metz, E.C., 1991. Strong reproductive isolation between closely related tropical sea urchins (genus Echinometra). Mol. Biol. Evol. 8, 227–239.
Palumbi, S.R., Wilson, A.C., 1990. Mitochondrial DNA diversity in the sea urchins Strongylocentrotus purpuratus and S. droebachiensis. Evolution 44, 403–15.
Pirie, D.M., Murphy, M.J., Edmisten, J.R., 1975. California Nearshore Surface Currents. Shore and Beach October, 23–34.
Raimondi, P.T., Keough, M.J., 1990. Behavioral variability in marine larvae. Aus. J. Ecol. 15, 427–427. 2 Roff, D.A., Bentzen, P., 1989. The statistical analysis of mitochondrial DNA polymorphisms: X and the
problem of small samples. Mol. Biol. Evol. 6, 539–545.
Saiki, R., Gelfand, D., Stoffel, S., Scharf, S., Higuchi, R., Horn, G., Mullis, K., Erlich, H., 1988. Primer-directed enzymatic amplification of DNA with a thermostable DNA polymerase. Science 239, 487–491.
Sambrook, J., Fritsch, E.F., Maniatis, T., 1989. Molecular Cloning: A Laboratory Manual. Cold Spring Harbor Laboratory Press.
Scheltema, R.S., 1971. Larval dispersal as a means of genetic exchange between geographically separated populations of shallow-water benthic marine gastropods. Biol. Bull. 140, 284–322.
Schroeter, S., Dixon, J., Ebert, T., 1992. The southern California red sea urchin fishery 1972–1992. In: Dewes, C. (Ed.), California Sea Grant Sea Urchin, Kelp, Abalone Conference, Bodega Bay, CA, March 1992, p. 14, Abstract.
Strathmann, R.R., 1978. Length of pelagic period in echinoderms with feeding larvae from the Northeast Pacific. J. Exp. Mar. Biol. Ecol. 34, 23–27.
Swofford, D.L., 1989. BIOSYS-1: A Computer Program For the Analysis of Allelic Variation in Population Genetics and Biochemical Systematics ver. 1.7. Champaign, IL.
Swofford, D.L., Begle, D.P., 1993. PAUP Phylogenetic Analysis Using Parsimony. Laboratory of Molecular Systematics, Smithsonian Institution.
Tajima, F., Nei, M., 1984. Estimation of evolutionary distance between nucleotide sequences. Mol. Biol. Evol. 1, 269–285.
Tracey, M.L., Nelson, K., Hedgecock, D., Shelser, R.A., Pressick, M.L., 1975. Biochemical genetics of lobsters: genetic variation and structure of American lobster (Homerus americanus) populations. J. Fish. Res. Bd. Can. 32, 2091–2101.
Vacquier, V.D., Swanson, W.J., Hellberg, M.E., 1995. What have we learned about sea urchin sperm bindin? Develop. Growth Differ. 37, 1–10.
Vacquier, V.D., Swanson, W.J., Lee, Y.-H., 1997. Positive Darwinian selection on two homologous fertilization proteins: what is the selective pressure for their divergence? J. Mol. Evol. 44 (Suppl. 1), S15–S22. Valentine, J.W., 1973. Evolutionary Paleoecology of the Marine Biosphere. Prentice-Hall, Englewood Cliffs,
Ward, R.D., 1989. Molecular population genetics of marine organisms. Reproduction, genetics, and distribution of marine organisms. In: Ryland, J.S., Tyler, P.A. (Eds.), 23rd European Marine Biology Symposium. Olsen and Olsen, Fredensborg, Denmark.