warmıng
world
impacts
by degree
Based on the National Research Council report,
summary
—
3
main findings
—
4
the human impact on climate
—
8
physical climate changes
in the 21st century
—
16
impacts in the next few decades
and coming century
—
26
1
Emissions of carbon dioxide from the burning of fossil fuels have ushered
in a new epoch during which human activities will largely determine the
evolution of the Earth’s climate.
2Because carbon dioxide is long-lived in the
atmosphere, increases in this key gas can effectively lock the Earth and many
future generations into a range of impacts, some of which could be severe.
3Therefore, emission reduction choices made today matter in determining impacts
that will be experienced not just over the next few decades, but also into the
coming centuries and millennia.
4Policy choices can be informed by recent
advances in climate science that show the relationships among increasing carbon
dioxide, global warming, related physical changes, and resulting impacts. These
impacts include changes in streamflow, wildfires, crop productivity, extreme
hot summers, and sea-level rise, along with associated risks and vulnerabilities.
Society faces important choices in this century regard-ing emissions of heat-trappregard-ing (green house) gases and the resulting effects on the Earth’s climate, ecosystems, and people. Human activities are responsible for the observed increases in atmospheric concentrations of several impor-tant greenhouse gases. These added gases—carbon dioxide in particular—very likely account for most of the globally aver-aged warming since 1950. There is now more carbon dioxide in the air than at any time in at least 800,000 years. This amount could double or nearly triple by 2100, greatly amplifying the human impact on climate.
There is widespread interest in reducing emissions of carbon dioxide and other greenhouse
gases to stabilize atmospheric concentrations. One way to gauge the implications of any such approach is to identify particular concentrations—or sta-bilization targets—and assess the emissions reductions necessary to achieve them, as well as the climate impacts that would result.
This booklet summarizes the findings of a report from the National Research Coun-cil, Climate Stabilization Targets: Emissions, Concentrations, and Impacts over Decades to Millen-nia (2011). The report evaluates the implications of different stabilization targets, with
partic-ular emphasis on avoiding serious or irreversible impacts on the Earth’s climate. Each stabili-zation target results in a different future climate, with changes that may be difficult or impos-sible to reverse for millennia, such as melting of the Green-land Ice Sheet. Some impacts will take hundreds or even thousands of years to emerge because of inherent lags in the climate system and because of the long atmospheric lifetime of carbon dioxide. This report also evaluates impacts expected to occur in the next few decades to centuries.
The impacts of human activities—particularly emissions of carbon dioxide,
but also including other greenhouse gas emissions, land use, and population
growth—are so vast that they will largely control the future of the Earth’s climate
system. This future could bring a relatively mild change in climate, or it could
deliver an extreme change from today’s climate to entirely different climate
conditions that will last many thousands of years. The eventual course of the
climate system over millennia will be determined largely by the actions taken
this century by governments, businesses, and individuals around the world.
The human contribution to global warming is due to
increases in the concentration of greenhouse gases and aerosol particles, which alter the Earth’s energy budget. In the special case of the greenhouse gas carbon dioxide, cumulative emissions are also an important metric or measure of the effect of humans on the climate system. The best estimate is that 1,000 gigatonnes of human-emitted carbon emissions leads to about 1.75°C (3.15°F) increase in global average temperature. Cumulative carbon emissions to date (2010) are about 500 gigatonnes, and the rate of global emissions is increasing. Based on current understanding, this warming is expected to be nearly irreversible for more than 1,000 years.1
The higher the total or cumu-lative carbon dioxide emitted and the higher the resulting atmospheric concentration, the higher the warming will be for the next thousand years. Higher emissions would lead to more warming over many
thou-sands of years, allowing more time for key but slow components of the Earth system to act as amplifiers of climate change. For example, warming of the deep ocean over many centuries will release additional carbon stored in deep-sea sediments, and the Greenland ice sheet could shrink or even disappear if global warm-ing remained in the range of 3.5°-5.0°C (6.3°-9.0°F) for several thousand years, raising global sea level by about 4-7.5 meters (13-24 feet).
Many aspects of climate are expected to change in a linear fashion as temperatures rise. A growing body of research suggests that many important
physical changes and impacts in the climate system during the next few decades to centuries will be proportional to global temper-ature increase. It is now possible to utilize increments of change in globally averaged tempera-ture—increases of 1°C, 2°C, 3°C, and so forth—as a tool for exam-ining a wide range of climate impacts. In turn, each increase in temperature also can be linked to a carbon dioxide emis-sions stabilization target around which emission policies could be structured. This framework helps decision makers weigh the potential risks of climate change; however, the costs of achieving particular emission reductions are not addressed.
main findings
1 Approaches to ‘geoengineer’ future climate, e.g., to actively remove carbon from the atmosphere or relect sunlight to space using particulate matter or mirrors are topics of active research. If effective, these may be
able to reduce or reverse global warming that would otherwise be effectively irreversible. This study does not evaluate geoengineering options, and statements throughout this report regarding the commitment
In general, each degree C of global temperature increase can be expected to produce:
• 5-10% changes in precipitation across many regions
• 3-10% increases in the amount of rain falling during the heaviest precipitation events
•5-10% changes in streamflow across many river basins
•15% decreases in the annually averaged extent of sea ice across the Arctic Ocean, with 25% decreases in the yearly minimum extent in September
• 5-15% reductions in the yields of crops as currently grown
• 200-400% increases in the area burned by wildfire in parts of the western United States
However, many other impacts remain difficult to quantify, in part because they depend on additional factors besides climate change. For exam-ple, changes in the risk of flood damage depend not only on precipitation but also on urban-ization and other changes in land cover. In addition, some phenomena beyond the next few centuries—such as the potential large-scale release of methane from deep-sea sediments— could act as amplifiers that would greatly increase the size and dura-tion of human impact on climate. Much recent attention has focused on thresholds or tipping points that might trigger wide-spread change. However, while
thresholds could be important for some phenomena, many potentially serious changes in physical climate and related impacts increase gradually, in line with the per-degree (linear) estimates outlined above. While this study did not find evidence for tipping points that could be related explicitly to particular stabilization targets, the possibility of “surprises” increases the larger the warming becomes. Some uncertainty remains in the relationships among the total amount of carbon diox-ide emitted over time, the portion that accumulates in the atmosphere, and the result-ing climate changes and their impacts. One uncertainty is that, as temperatures warm, the abil-ity of seawater to absorb carbon dioxide is expected to decrease, and the percentage absorbed by land-based ecosystems may also decline. However, these processes will be driven by a number of interacting variables that are not yet well-quantified. Further, the amount of global temperature increase likely to result from a given increase in carbon dioxide ranges from about 30% below the best estimate to 40% above it. Thus, each stabi-lization target encompasses a range of potential temperature change and associated risks that must be taken into account in evaluating stabilization targets.
The impacts of human activities–
What Impacts Can Be Expected?
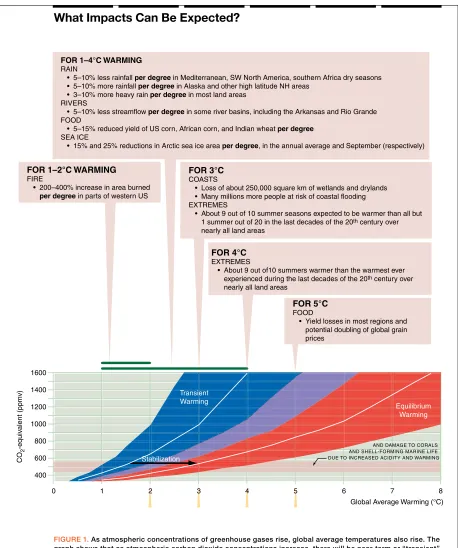
Figure 1. As atmospheric concentrations of greenhouse gases rise, global average temperatures also rise. The graph shows that as atmospheric carbon dioxide concentrations increase, there will be near-term or “transient” warming (range of projected temperatures in blue) which is only about half as large as the total or “equilibrium” warming (range of projected temperatures in red) that will eventually occur if concentrations are stabilized at those values. The black “stabilization” arrow shows the difference in transient and equilibrium temperatures if the atmo-spheric concentration of carbon dioxide were stabilized at about 580 ppm. The top portion of the figure lists key impacts for given temperature increases. The impacts listed for 1- 4°C warming and for 1-2°C warm-ing are given per degree of warmwarm-ing. For example, streamflow is projected to be reduced by 5-10% per 1°C warming, by 2-20% at 2°C, by 15-30% at 3°C, and 20-40% at 4°C. Because equilibrium warming is about twice as large as transient warming, the impacts experienced as temperatures rise are expected to double for stabilization.
CO
2
-equiv
alent (ppmv)
1600
1400
1200
1000
800
600
400
0 1 6 7 8
FOR 5°C
FOOD
• Yield losses in most regions and potential doubling of global grain prices
FOR 1–2°C WARMING
FIRE
• 200–400% increase in area burned per degree in parts of western US
FOR 1–4°C WARMING
RAIN
• 5–10% less rainfall per degree in Mediterranean, SW North America, southern Africa dry seasons • 5–10% more rainfall per degree in Alaska and other high latitude NH areas
• 3–10% more heavy rain per degree in most land areas RIVERS
• 5–10% less streamflow per degree in some river basins, including the Arkansas and Rio Grande FOOD
• 5–15% reduced yield of US corn, African corn, and Indian wheat per degree SEA ICE
• 15% and 25% reductions in Arctic sea ice area per degree, in the annual average and September (respectively)
FOR 3°C
COASTS
• Loss of about 250,000 square km of wetlands and drylands • Many millions more people at risk of coastal flooding EXTREMES
• About 9 out of 10 summer seasons expected to be warmer than all but 1 summer out of 20 in the last decades of the 20th century over
nearly all land areas
Global Average Warming (°C)
FOR 4°C
EXTREMES
• About 9 out of10 summers warmer than the warmest ever experienced during the last decades of the 20th century over
nearly all land areas
AND DAMAGE TO CORALS AND SHELL-FORMING MARINE LIFE DUE TO INCREASED ACIDITY AND WARMING
2 3 4 5
Stabilization
Equilibrium Warming Transient
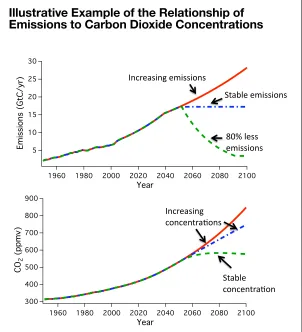
Large reductions in carbon dioxide emissions would be needed in order to stabilize carbon dioxide concentra-tions at any chosen target level. Carbon dioxide is the domi-nant greenhouse gas driving the observed changes in the Earth’s climate today and is expected to become even more dominant in the future. The challenge of stabilizing carbon dioxide concen-trations is a daunting one. Global emission rates of carbon dioxide have increased in every decade of the industrial era. About 55% of the carbon dioxide emitted by human activities each year is absorbed by oceans, plants, and soil. However, today’s emissions are much greater than natural removals. Even if society managed to hold emis-sion rates steady, carbon dioxide would continue to accumulate in the atmosphere, and warming would continue to increase. To keep atmospheric concen-trations of carbon dioxide roughly steady for a few decades and avoid increas-ing impacts, global emissions would have to be reduced by at least 80% (see Figure 2). Even greater emission reductions would be required to maintain stabil-ity in the longer term, as the Earth system continues to respond to emissions already added.
Uncertainties about human behavior affect our ability to project future climate. These uncertainties become more and more important over time.
Nations, organizations, and indi-viduals could take a multitude of actions—whether intentional, inadvertent, or both—that influ-ence emissions in the coming years. We do not yet know how these actions will combine to shape global emissions. Several possible pathways, or potential rates of emission change over time, have been developed by researchers, but we do not yet know which pathway will prove most accurate. This uncertainty increases in importance over time.
The higher the total or cumulative
carbon dioxide emitted and the
higher the resulting atmospheric
concentration, the higher the warming
will be for the next thousand years.
Increasing emissions
Illustrative Example of the Relationship of
Emissions to Carbon Dioxide Concentrations
Earth and its residents are entering a new geological epoch—one now
beginning to be called the Anthropocene—in which human activities are a
primary force affecting climate. Our actions this century to reduce or increase
greenhouse gas emissions will determine whether the Anthropocene is a relatively
mild event or a severe transition extending over many thousands of years.
A variety of human-produced substances affect the Earth’s energy budget and thus its climate. These include green-house gases, whose molecular structure allows them to capture radiation that would otherwise escape from the Earth to space, and aerosols (airborne particles), which can either reflect or absorb incoming radiation from the Sun. A critical task in assessing future climate is to diagnose how atmo-spheric concentrations of these substances and their effects are likely to change during the coming decades and centuries.
Humans generate green-house gases by burning fossil fuels, clearing tropical forests, and other activities. The impact of each type of greenhouse gas on climate depends on the number of molecules emitted, the strength of each molecule in trapping radiation, and the lifetime of each molecule in the atmosphere. Greenhouse gas emissions from human activi-ties are now outstripping the earth’s natural ability to remove them, increasing atmospheric concentrations.
Examining how global climate may evolve over thousands of years requires analyzing a number of very slow processes triggered by long-lasting
increases in CO2 concentrations and global temperature. One example of such a process over coming millennia is the grow-ing potential for large-scale release of carbon—perhaps from methane compounds stored in deep-sea sediments or perma-frost. Although recent methane releases at specific points may appear dramatic, and a major release could have a substan-tial effect on climate, it is not yet possible to quantify the long-term risk of a major release.
Ice sheets are another increasing concern over the very long term. Models indicate that Greenland’s ice sheet could shrink or even disappear if global warming remained in the range of 3.5°-5.0°C (6.3°-9.0°F) for several thousand years. All else being equal, this would raise global sea level by about 4-7.5 meters (13-24 feet). There is evidence that as little as 5°C (9.0°F) of local oceanic warming over a few thousand years could destabilize and deglaciate the West Antarc-tic ice sheet, which would raise sea level by about 5 more meters
(17 feet). Whether the ice sheets could destabilize more rapidly is a topic of active research.
Geological history confirms the long-term risks posed by enhanced concentrations of greenhouse gas. During the Pliocene period (from about 5.3 to 2.6 million years ago), carbon dioxide concentrations were similar to those today; the difference is that the Northern Hemisphere was free of large ice sheets at that time, and global temperatures were about 3°C (5.4°F) above today’s levels. Further in the past, the Paleo-cene-Eocene Thermal Maximum (roughly 56 million years ago) provides an even more dramatic example. Atmospheric carbon dioxide was far higher than today, and the planet was warm enough to be free of ice.
Ultimately, there are no historical analogues for the mix of temperatures, ice sheets, and CO
2 concentrations already present and projected for the Anthropocene. It is an open question whether the Earth’s climate will stabilize after several
three small atoms, lots of warming power
The human-produced greenhouse gas of most concern is carbon dioxide. It is emitted in vast amounts.
thousand years, or whether impacts such as sea-level rise will continue or accelerate.
G
reenhouse
gases and the
carbon cycle
The most important human-produced greenhouse gas is carbon dioxide. It is emitted in vast amounts: 10 billion metric tons of carbon (equivalent to 36 billion metric tons of CO2) in 2008 alone. Though the emis-sion rates sometimes temporarily decrease from one year to the next (due to economic downturns, for instance), huge amounts of carbon dioxide continue to be added to the atmosphere every year. About
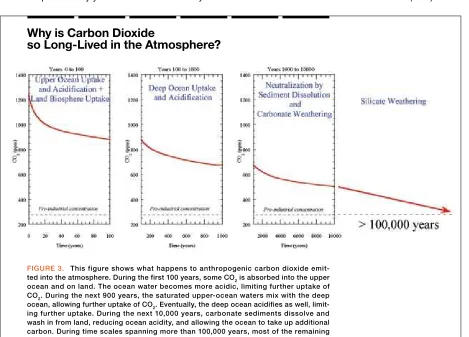
55% of this total is absorbed rela-tively quickly by plants, soil, and the ocean. The rest stays in the atmosphere for much longer, decreasing only gradually. More than half of the remainder will be in the air a century later. Some of it will persist for more than a thou-sand years. (See Figure 3.)
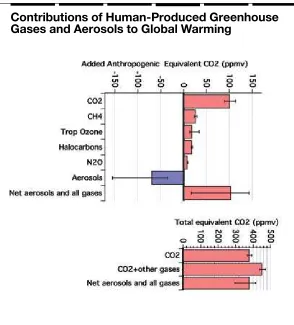
Although some other green-house gases produced by human activity are stronger absorbers of radiation then carbon dioxide, they are emitted in much smaller amounts, and thus they have less of an impact on climate ( see Figure 4). However, as a group, they are still important. In order to simplify the task of climate analysis, these gases are often characterized by the climate effect they would have if they were in the form of
carbon dioxide--their carbon diox-ide equivalent concentration.
Carbon dioxide is by far the biggest contributor to current global warming. While each mole-cule of methane has about 25 times the impact of carbon dioxide over a century’s time, this is counter-balanced by methane’s relative scarcity—it is currently less than 1% as prevalent as carbon diox-ide. Overall, this means that the CO
2-equivalent concentration of human-produced methane is about 25 parts per million, compared to 100 parts per million for human-produced carbon dioxide.
The impact of aerosols is more complex than that of green-house gases, because they can both warm and cool the Earth’s climate. Black carbon (soot)
Why is Carbon Dioxide
so Long-Lived in the Atmosphere?
absorbs heat, while some other aerosols reflect energy to space. As a group, aerosols are now believed to be producing a net cooling effect that offsets about half of the total warming from greenhouse gases (see Figure 4).
Because aerosols remain in the air for only a few days on average, their concentrations are focused near the regions where they are emitted, such as the industrialized continents of the Northern Hemisphere. In contrast, the effects of carbon dioxide extend across the world, because CO2 is mixed through-out the global atmosphere during
its long lifetime. Because aero-sols do not precisely compensate for greenhouse gases in their regional effects, and because they have a number of negative effects on human health and agri-culture—for example, particulates increase the risk of asthma and other respiratory illnesses—it is inaccurate to consider them as offsetting global warming.
Because heat-trapping constit-uents such as methane and black carbon (soot) exert their warm-ing effects over a shorter period than carbon dioxide, it has been suggested that society can “buy time” by reducing these
shorter-lived components quickly and then focusing on the more challenging task of reducing carbon dioxide emissions over the longer term. There could be side benefits to this approach: for example, reduc-ing black carbon also reduces air pollution, and trapping meth-ane emissions may yield natural gas that can be burned for energy. The “buying time” approach would indeed reduce the tempera-ture peak associated with a given stabilization target. However, it would have little impact on the temperatures that would prevail for hundreds of years after stabili-zation, when the effects of carbon dioxide strongly dominate the future climate change.
T
he life cycle
of carbon
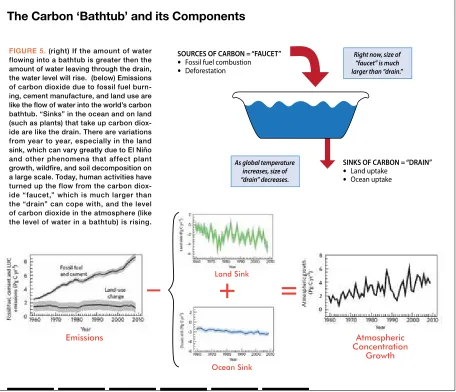
Substantial amounts of carbon dioxide are exchanged routinely between the atmosphere and the rest of the Earth system (soil, plants, and ocean). However, the net imbalance of the natu-ral system is relatively small compared to the amount of carbon dioxide being added to the atmosphere by human activities. Natural processes can take up some, but not all, of the emitted carbon dioxide. Just as a sink with a drain will fill up if water enters it too quickly, human production of carbon dioxide is outstripping the Earth’s natural ability to remove carbon from the air (see Figure 5).
The amount of carbon enter-ing the ocean has increased relatively steadily since 1960, while the amount absorbed by the biosphere varies substantially. For instance, a major El Niño can
Contributions of Human-Produced Greenhouse
Gases and Aerosols to Global Warming
produce widespread drought and cause a temporary but substan-tial reduction in the global uptake of carbon dioxide by plants.
The effectiveness of the ocean to remove human-produced carbon dioxide from the atmosphere is expected to decrease slowly over time for several reasons:
• The capacity for seawater to take up additional carbon diox-ide decreases as carbon dioxdiox-ide concentrations rise.
• Carbon dioxide is less soluble in warmer water.
• Climate change will inhibit the vertical circulation of seawater, thus reducing the formation of deep water and the amount of CO2-absorbing water exposed to the atmosphere.
A number of interlocking factors, both natural and human-caused, make it challenging to assess how much carbon dioxide will be absorbed on land. These chal-lenges include the following: • Deforestation adds carbon to the atmosphere by replacing high-carbon forests with relatively
low-carbon pastures and croplands. This process, mainly occurring in the tropics, is being partially offset by forest regrowth in some mid latitude areas, including the United States. The total impact of land-use changes on airborne carbon can take decades to play out, which makes it difficult to separate the impacts of current and past events. • Laboratory and field studies show that—all else being equal— increasing the amount of carbon dioxide in the atmosphere stimu-lates photosynthesis and causes plants to absorb greater amounts
T
he Carbon ‘Bathtub’ and its Components
–
+
=
Figure 5. (right) if the amount of water flowing into a bathtub is greater then the amount of water leaving through the drain, the water level will rise. (below) emissions of carbon dioxide due to fossil fuel burn-ing, cement manufacture, and land use are like the flow of water into the world’s carbon bathtub. “Sinks” in the ocean and on land (such as plants) that take up carbon diox-ide are like the drain. There are variations from year to year, especially in the land sink, which can vary greatly due to el Niño and other phenomena that affect plant growth, wildfire, and soil decomposition on a large scale. Today, human activities have turned up the flow from the carbon diox-ide “faucet,” which is much larger than the “drain” can cope with, and the level of carbon dioxide in the atmosphere (like the level of water in a bathtub) is rising.
SOURCES OF CARBON = “FAUCET” Fossil fuel combustion
Deforestation
SINKS OF CARBON = “DRAIN” Land uptake
Ocean uptake
Right now, size of “faucet” is much larger than “drain.”
of carbon dioxide. While this could help partially offset human-generated emissions, it may not occur if plant growth is limited in other ways, for example, by a deficiency in nitrogen.
• Warmer temperatures may have the net effect of transfer-ring carbon from land-based ecosystems to the atmosphere, because warming often tends to increase soil respiration more than it increases photosynthesis. However, there is a wide range of estimates on the sensitivity of land ecosystems to increases in temperature, with many vari-ables playing a role. Increased drought, for example, could offset the carbon absorption that would otherwise result from longer grow-ing seasons in colder climates.
E
ffects on global
temperature
Although the atmospheric greenhouse effect has been
understood for more than a century, it remains difficult to know precisely how much the Earth will warm if a given amount of greenhouse gas is added to the air. However, recent research has refined the understand-ing of uncertainties in estimated ranges of future warming, and new approaches to the problem— such as focusing on the total amount of carbon dioxide emitted over a long period, rather than the rate at which it is added—are yielding new insights.
When large amounts of green-house gases are added to the Earth’s atmosphere, as is happen-ing now, the planet’s energy budget is thrown substantially out of balance. Until that balance is
regained, the Earth receives more radiation from the Sun in short-wave (visible) form than it sends back to space through long-wave (invisible) radiation.
If all human-produced warm-ing agents (includwarm-ing all gases and aerosols) were to be kept constant, the Earth would grad-ually reach a new equilibrium temperature, as a number of processes correct the radia-tive imbalance and adjust to the elevated levels of green-house gas and aerosols over a period of centuries. The differ-ence between the new and old equilibrium temperatures—in other words, the global warm-ing produced by addwarm-ing a certain amount of global warming
Just as a sink with a drain will ill up
if water enters it too quickly, human
production of carbon dioxide is
agent—is referred to as climate sensitivity (see Table 1).
The most common way to examine climate sensitivity is to study the impact of doubling the preindustrial concentration of carbon dioxide. Global CO2 concentrations are now about 35% above preindustrial levels. If present rates of emission growth continue, doubling is likely to occur around the middle part of the 21st century.
Earth’s climate sensitivity is not yet known with precision. Many processes interact to shape climate, and not all of them are equally well under-stood. However, several major components that would produce warming in a doubled-CO2 envi-ronment—such as changes in how the Earth radiates heat to space, and increases in water vapor—are well characterized. Together, these would produce about 1.8°C (3.2°F) of warm-ing, assuming that current global amounts and patterns of cloudi-ness did not change.
There is much more uncer-tainty in the amount of warming that could occur in addition to the 1.8°C value. Additional warm-ing depends on the strength of such amplifying feedbacks as the melting of polar snow and ice (see Figure 6), as well as possible changes in aerosols and clouds. Some types of clouds have a net cooling effect, while others— primarily thin, high clouds—have a net warming effect. Most studies point to an increase in warm-ing clouds, but the result varies greatly among different models. The total climate sensitivity from doubled CO2, including all factors, is likely to lie between 2.1°C to
C
arbon Dioxide Concentrations and
Increases in Global Mean Temperature
TABLe 1. The table shows the global warming levels that are likely (66% chance) to be associated with rising atmospheric concentrations of carbon dioxide. This information is derived from model results,1 and is roughly
consis-tent with paleoclimate evidence of changes in temperature and levels of atmospheric carbon dioxide. Similarly, there is a likely uncertainty range in the atmospheric concentrations that are likely to be associated with any partic-ular warming level (1°C, 2°C, 3°C, etc) of about plus or minus 33%, reflecting the fact that earth’s “climate sensitivity”—the amount the world is expected to warm by adding a global warming agent—is not yet known with precision.
1The estimated “likely” range corresponds to the range of model results in the Climate Modeling intercomparison
Project (CMiP3) global climate model archive.
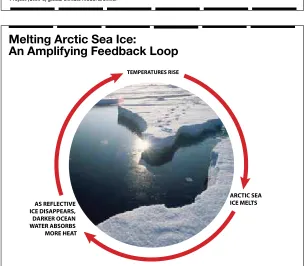
Melting Arctic Sea Ice:
An Amplifying Feedback Loop
Figure 6. The full amount of warming that occurs because of increased green-house gas emissions depends in par t on feedback loops. Amplifying feedback loops can increase warming, while negative feedbacks can reduce warming. The melting of Arctic sea ice is an example of an amplifying feedback loop. As the ice melts, more sunlight is absorbed into the dark ocean versus being reflected back in to space by ice, causing fur ther warming and fur ther melting of ice.
TEMPERATURES RISE
AS REFLECTIVE ICE DISAPPEARS, DARKER OCEAN WATER ABSORBS MORE HEAT
4.4°C (3.8°F to 7.9°F), with a best estimate of 3.2°C (5.8°F).
If CO2 emissions stopped at the doubling point, the climate would continue to warm for several more centuries until it reached its new equilibrium temperature (the equilibrium climate sensitivity). Following CO2 stabilization, it would take many thousands of years for the temperature to slowly decline after emissions stopped, as the Earth gradually reabsorbs the added carbon dioxide.
Another important parameter related to the climate response to greenhouse gas increases is the transient climate response— the amount of warming achieved at the time a given addition of greenhouse gas has occurred, but before a longer-term equilib-rium is reached.
By examining temperature and emission patterns for vari-ous periods—such as the interval since the late 1970s, during which global temperatures have risen by about 0.5°C (0.9°F)— researchers have obtained a variety of estimates of transient climate response for doubled CO2. In evaluating the results, this study finds a best estimate of about 1.6°C (2.9°F), with a likely range of 1.3-2.2°C (2.3-4.0°F). If concentrations were to be stabi-lized, eventually the warming would roughly double.
Another way to look at sensi-tivity is the carbon climate response—the temperature ultimately reached due to the addition of a given amount of added CO2. The carbon climate response is linked not only to the warming, but also to the response of the carbon cycle including
the strength of carbon sinks. Recent work indicates that the carbon climate response is nota-bly consistent between different models for a given amount of accumulated emissions, regard-less of how quickly or slowly the carbon is added (see Figure 7).
This new understanding opens the door to a cumulative carbon framework that would allow policy makers to focus on the total amount of emis-sions accumulated over the long term, with less emphasis on the concentrations at any point in time. For example, if just over a trillion metric tons of carbon were added to the air, the best esti-mate of the long-term warming would be close to 2.0°C (3.6°F). Adding the CO2 more quickly would bring temperatures to that value more quickly, but the value itself would change very little.
Thus, emission policies oriented toward the very long term might be able to focus less on when reductions take place and more on how much total CO2 is emit-ted over a long period—in effect, a carbon budget. The possi-bility of greater warming for a given cumulative carbon emis-sion, implying additional risk, cannot be ruled out, and smaller amounts of warming are also possible.
On longer time scales, it is possible that slowly unfolding feedbacks, such as the partial or total loss of polar ice sheets, could continue to transform the Earth’s climate for thousands of years after an initial equilibrium is reached. Earth system sensitiv-ity—our planet’s vulnerability to these delayed effects—is diffi-cult to quantify, but critical to our long-term future.
C
umulative Emissions and Increases
in Global Mean Temperature
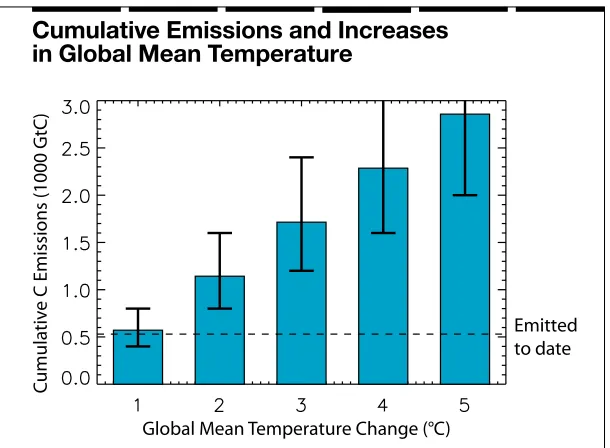
Figure 7. recent studies show that for a particular choice of climate stabilization temperature, there is only a certain range of allowable cumulative carbon emis-sions. Humans have emitted a total of about 500 gigatonnes of carbon to date. The error bars account for estimated uncertainties in both the carbon cycle and in the climate responses to carbon dioxide emissions. Cumulative emissions shown are in teratonnes of carbon (trillion metric tonnes or 1000 gigatonnes).
C
umulative C Emissions (1000 GtC
)
Global Mean Temperature Change (°C)
Scientific progress has increased confidence in the understanding of how global
warming levels of 1º, 2º, 3º, 4º, 5ºC, and so on, affects many aspects of the
physical climate system, including regional and seasonal changes in temperature
and precipitation, as well as effects on hurricanes, sea ice, snow, permafrost,
sea-level, and ocean acidification.
Climate Stabilization Targets
attempts to quantify
the outcomes of different stabilization targets on the climate system, as much
as is possible based on currently available scientific evidence and information.
T
emperatures by
region and season
• Regional temperatures rise in proportion to the average warming over the entire globe.
Local temperatures vary widely from day to day, week to week, and season to season. Longer-term changes due to increased greenhouse gases, on the other hand, are more gradual. Many studies suggest that the spatial pattern of these gradual changes remains the same, even for different increases in global average temperature. This allows us to employ a linear approach in projecting future climate changes, introduced on page 15, in which these patterns of warming can be scaled upward or downward based on each °C of average warming over the entire globe.
Climate Stabilization Targets
draws on simulations produced for a project that was part of the Intergovernmental Panel on Climate Change (IPCC) Fourth Assessment Report1. The various models in the project carried out a
common set of experiments. Each model generated maps of regional warming for a variety of scenarios, each of which portrays a different plausible future, or “storyline,” of global economic development.
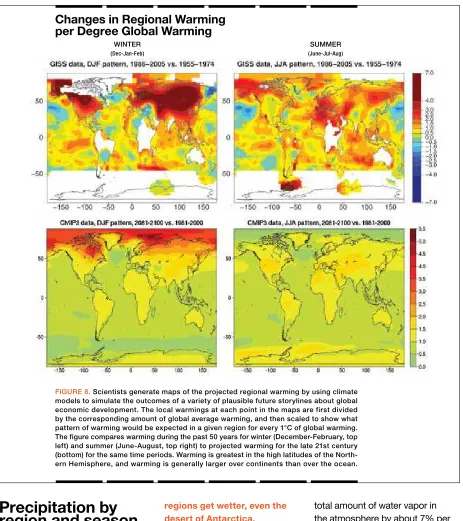
After averaging the normalized maps from all models and scenar-ios, we can assess how much of a rise in average temperature might be expected in different regions for every 1°C of global warm ing. As shown in Figure 8 (bottom left) for the period December through February, polar regions are expected to warm four or more times more quickly than the planet as a whole by the 2080s and 2090s. During the period June through August, (Figure 8, bottom right) the warming is strong est across northern midlatitudes, including the United States, southern Europe, and central Asia.
Many of these patterns are already evident in obser-vations from the past century (Figure 8, top panels). The second half of the 20th century saw intense winter warming across parts of Canada, Alaska, and northern Europe and Asia (top left) and summer warm-ing across the Mediterranean and Middle East (top right). One of the largest differences between 20th-century data and 21st-century projections is across the central United States during the summer. From 1955 to 2005, this region, on average during June, July and August, warmed at less than half the average global pace, but models project that increased dryness in this area would cause it to warm more rapidly than the planet as a whole over this century.
physical climate
changes in the
21st century
Physical climate changes that can be identified or quantified per degree of warming include:
• Precipitation increases or decreases by 5-10% per degree of warming across many regions • Average September extent of Arctic sea ice is reduced by about 25% per degree of warming • Oceans continue to become more acidic (average pH value of seawater continues to decrease) • Risk of very hot summers increases (“very hot” is defined as the hottest 5% of summers) • Amount of rain falling during the heaviest precipitation events increases by 3-10% per degree
P
recipitation by
region and season
• Precipitation increases or decreases by 5-10% per degree of warming across many regions
• At middle and low latitudes (closer to the equator), wet areas get wetter; dry areas get drier. All high-latitude
regions get wetter, even the desert of Antarctica.
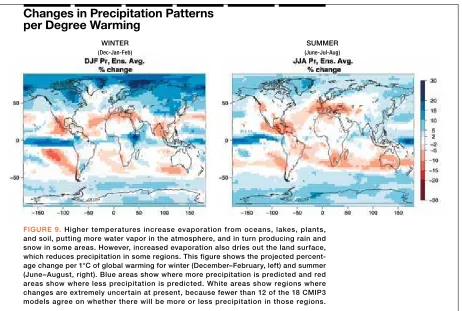
In many ways, global warming is expected to intensify regional contrasts in precipitation that already exist. Warmer tempera-tures tend to increase evaporation from oceans, lakes, plants, and soil. Theory and observations agree that this should boost the
total amount of water vapor in the atmosphere by about 7% per 1°C of warming. Although the enhanced evaporation provides more atmospheric moisture for rain and snow, it also dries out the land surface, which exacerbates the impact of drought in some regions. As a general rule, dry areas are expected to get drier, and wet areas even wetter.
Changes in Regional Warming
per Degree Global Warming
Figure 8. Scientists generate maps of the projected regional warming by using climate models to simulate the outcomes of a variety of plausible future storylines about global economic development. The local warmings at each point in the maps are first divided by the corresponding amount of global average warming, and then scaled to show what pattern of warming would be expected in a given region for every 1°C of global warming. The figure compares warming during the past 50 years for winter (December-February, top left) and summer (June-August, top right) to projected warming for the late 21st century (bottom) for the same time periods. Warming is greatest in the high latitudes of the North-ern Hemisphere, and warming is generally larger over continents than over the ocean.
WiNTer
(Dec-Jan-Feb)
SuMMer
Using the same general approach as for tempera-tures, regional and seasonal maps have been produced that depict the percentage change in precipitation expected for every 1°C of global warming. The results show that many subtrop-ical areas around 30°N and 30°S, where most of the world’s deserts are concentrated, are likely to see reductions of 5-10% in precipitation for every degree of warming across the planet as a whole. In contrast, subpolar and polar regions are expected to see increased precipitation, especially during winter.
The overall pattern of change in the continental United States is somewhat complicated, as the 48 states lie between the drying subtropics of Mexico
and the Caribbean and the moistening subpolar regions of Canada. Most models suggest drying in the southwestern United States.
Different complexities arise in the tropics. For example, although many regions near the equator should moisten, the exact locations will be determined by chang-ing interactions between winds and rainfall (including the El Niño/ Southern Oscillation) that are diffi-cult for present climate models to capture. Two areas of particular concern are the Amazon, home to the world’s largest rainforest, and sub-Saharan Africa, where millions of people are vulnerable to rainfall-induced disruptions in food supply. In both of these areas, some, but not all, models show the potential for dramatic drying.
• Risk of very hot summers increases, where “very hot” is defined as the hottest 5% of summers during the 1971-2000 average
• Amount of rain falling dur-ing the heaviest precipitation events increases by 3-10% per degree of warming
Extreme periods of heat and cold can kill thousands of people in a single region. Likewise, a few days of unusually heavy rain can have major local and regional impacts. Projecting how extreme events like these will change with global warming is a different and more difficult task than
project-Changes in Precipitation Patterns
per Degree Warming
ing the averaged regional and seasonal patterns of changes in average temperature and precipitation.
If temperatures rise by 1°C, one might expect that extreme daily highs and lows would also tend to rise by 1°C. This would intensify warm extremes and modulate cold ones. It is possi-ble that extremes could change in a less straightforward fash-ion: for example, temperature variability might increase or decrease over time, or the high end of the range could rise more or less quickly than the low end. However, the studies conducted to date do not yet provide robust
projections of how variability will change as a function of global temperature, or, in turn, for how daily temperature extremes might change.
Modeling results do allow us to robustly characterize potential changes in seasonal temper-atures. Accordingly, we use average seasonal temperatures as a way to gauge how some local extremes might vary with global warming. Across north-ern midlatitudes, the kind of extremely warm summer that one might experience only once every 20 years (95th percen-tile) would be expected every 2 to 10 years should global
warm-ing reach about 2°C relative to pre-industrial conditions. If global temperature rises to about 3°C, then the majority of summers across the world’s populated areas would be as warm as those experienced only about once every 20 years during the past few decades.
Observations in many parts of the world show that in many cases, intense bouts of rain are already becoming even more intense. Computer models indi-cate that this trend will continue as the Earth warms, even in subtropical regions where the overall precipitation goes down. In general, extreme rain events are likely to intensify by 5-10% for every 1°C of global warming. Theory suggests that the great-est intensification should occur in the tropics, where rain is already the heaviest.
Although there is high confi-dence that extreme rainfall will
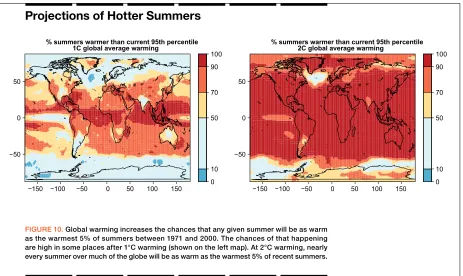
P
rojections of Hotter Summers
Figure 10. global warming increases the chances that any given summer will be as warm as the warmest 5% of summers between 1971 and 2000. The chances of that happening are high in some places after 1°C warming (shown on the left map). At 2°C warming, nearly every summer over much of the globe will be as warm as the warmest 5% of recent summers.
Observations in many parts of
the world show that, in many cases,
intense bouts of rain are already
becoming even more intense.
0
% summers warmer than current 95th percentile 2C global average warming
0
% summers warmer than current 95th percentile
become heavier, local impacts may not necessarily grow in a corresponding fashion. For example, flood risk depends on land use and many other local and regional variables besides precipitation.
H
urricanes and
regional
atmospheric
circulation
• Hurricane intensity increases by 1-4% per 1°C of warming
• Hurricane destructive power (cube of the wind speed) increases by 3-12% per 1°C of warming
• Hurricane frequency decreases by 0-10% per 1°C of warming
• Jet streams and storm tracks generally move toward the poles
Much research has been carried out over the last few years on how hurricane frequency and intensity might change in a warm-ing climate. Initial studies noted that the number and strength of tropical cyclones observed in the Atlantic Ocean has risen dramatically during the past several decades, largely in sync with sea-surface temperatures over the tropical North Atlantic. Because hurricanes draw energy from warm oceans, the projected rise in sea-surface temperatures across much of the tropics would provide additional energy for any cyclones that form.
Recent observational and modeling studies provide an updated picture of how global warming could affect cyclones.
These studies suggest that some of the previously identi-fied increase in Atlantic hurricane numbers can be attributed to a natural cycle causing ocean temperatures in the tropical Atlan-tic to rise and fall over periods of several decades. Trends during a full century or longer would aver-age across these natural internal cycles. However, claims of signifi-cant upward trends over these longer time scales have been questioned as improved observa-tions have revealed that a number of storms went unnoticed in the pre-satellite era.
In general, models of 21st-century climate tend to reduce the number of tropical cyclones observed by 0-10% for every °C of global warming. The average intensity is projected to increase by 1-4% per 1°C, with destructive power (the cube of the wind speed) growing by 3-12% per 1°C. Calculations based on the expected global increase in water vapor show a potential 7% rise per 1°C in the amount of rain falling within 100
kilometers (60 miles) of a tropical cyclone’s center.
Although most tropical oceans are expected to warm, a strong case has been made that it is the relative amount of warm-ing among oceans that affects where hurricanes increase or decrease in number. Because of the circulation pattern of rising and sinking air driven by relatively warm and cool tropical waters, respectively, regions with warmer sea surface temperatures will tend to generate more cyclones at the expense of regions where less warming occurs. While the tropical Atlantic has warmed more rapidly than the other tropi-cal oceans over the past few decades, models provide no consensus that this will continue into the future.
degree in the Southern Hemi-sphere during recent decades, models suggest that much of that change has been driven by the depletion of stratospheric ozone above Antarctica. By the mid-21st century, this ozone depletion is expected to dimin-ish; from that point onward, greenhouse-driven changes in the southern polar jet stream and associated storm track should become evident. The observational record for contrac-tion of the jet streams and storm tracks in the Northern Hemi-sphere is less clear, but models also predict a gradual pole-ward contraction as the century progresses.
Sea ice, snow, and
permafrost
• Annual average extent of Arctic sea ice is reduced by about 15% per degree of warming
• Average September extent of Arctic sea ice is reduced by about 25% per degree of warming, with ice-free condi-tions in September eventually possible
• Snow cover is generally reduced; permafrost thaws
As global warming continues, many forms of ice across the planet are decreasing in extent, depth, and duration. This trend is generally expected to continue,
although there are some impor-tant exceptions.
models showing abrupt drops lasting one or more years.
Substantial reductions in sea-ice extent have occurred around the West Antarctic Peninsula, while increases have occurred in other parts of Antarctica. In contrast to the Arctic, sea ice surrounding Antarctica has expanded, aver-aged around the continent, by a slight but significant amount over the past several decades. This increase may be linked to strato-spheric ozone depletion, and the effect is expected to wane as ozone returns to normal levels by later this century. Still, Antarctic sea ice may continue to decrease less rapidly than Arctic ice, in part because the Southern Ocean stores heat at greater depths than the Arctic Ocean.
In many areas of the globe, snow cover is expected to dimin-ish, with snowpack building later in the cold season and melting earlier in the spring. Accord-ing to one sensitivity analysis, every 1°C of local warming may lead to an average 20% reduc-tion in local snowpack. However, in places such as Siberia, parts of Greenland, and Antarctica where temperatures are cold enough to support snow over long periods, the amount of snowfall may increase even as the season shortens, because the increased amount of water vapor associated with warmer temper-atures may enhance snowfall. Conversely, the largest reduc-tions in snow cover should occur in moist, low-elevation climates such as that of the Pacific North-west, where temperatures are already marginal for snow.
Data from Canada, Alaska, Siberia, and Scandinavia show
that permafrost (soil that remains frozen for at least 2 consecutive years) has gradually warmed and shrunk during the past century, with its global extent decreasing by about 7%. Models suggest that a further decrease of about 30% to more than 50% is possi-ble by mid-century, depending on the model and the warm-ing scenario. Should rapid loss of sea ice occur in the Arctic, additional heat flowing from the Arctic to areas of permafrost could hasten its decline.
Co
ntributors to Sea-Level Rise
Figure 11. Sea level has risen steadily over the past few decades. The bottom panel shows the total observed sea-level rise (blue) with the error range of total sea level (one standard deviation; gray band). The top panel shows the various components that contribute to sea-level rise: thermal expansion in the upper 700 meters of ocean (red) and deeper ocean layers (orange), meltwater from Antarctic and greenland ice sheets (cyan), melt-water from glacier s and ice caps (purple), and storage on land (green).
Sea-level rise and
ocean acidification
• By 2100, global mean sea level rises by 0.5-1.0 meters (20-39 inches)
• Oceans continue to become more acidic (average pH value of seawater continues to decrease)
continually varies, both over the short term because of tidal cycles and storms, and over the long term because of geological factors and climate change.
On average, however, global mean sea level has risen by about 0.2 meters (8 inches) since 1870. A large fraction of the sea-level rise—roughly half of the total from 1993 to 2003—has occurred because of oceans expanding as they warmed. The rest is mainly due to water entering the sea from melting glaciers, ice caps, and ice sheets.
Globally averaged mean sea level will rise over the next century from further ocean thermal expansion (estimated to contribute 0.14-0.32 meters, or 5-12 inches, by 2100) and from additional meltwater and increased iceberg calving, which will probably grow over time in its importance to total sea level relative to thermal expansion. These factors could lead to an estimated 0.5-1.0 meter (20-39 inches) of mean sea-level rise by 2100, depend-ing on the model and scenario. Because recent studies have shown increased melting from glaciers and ice sheets, these estimates are somewhat higher than those in the 2007 IPCC assessment.
Even larger increases in mean sea level—more than 1.0 meter (39 inches) by 2100— could occur as a result of the dynamic behavior (meaning a mechanical collapse rather than gradual melting) of Greenland and Antarctic ice sheets, which is poorly represented in current climate models. The
geologi-cal record of past climates can neither confirm nor rule out the possibility of such rapid rises in sea level. Although they are conceivable, it is not yet possible to quantify this risk. Some corre-lation studies predict sea-level rise up to 1.6 meters (63 inches) by 2100 for a warming scenario of 3.1°C (5.6°F).
As they rise, the world’s seas are also gradually acidifying. This is because of the increas-ing amount of CO2 absorbed by oceans, which has equaled about a quarter of human-produced CO2 emissions in recent years. Consequently, the average pH value of seawater in the surface ocean has dropped by about 0.1 pH units since
pre-industrial times (from about 8.2 to about 8.1), corresponding to a 26% increase in hydrogenions. In turn, these changes influence aspects of ocean chemistry on which many creatures rely— especially plants and animals that build shells and skeletons from calcium carbonate, because the concentration of carbonate decreases as the pH of seawa-ter drops.
If CO2 concentrations rise to 550 ppm, pH would drop by an additional 0.15 units, which could begin to jeopardize shell-building marine life in some areas. Increases in CO2 are projected to harm coral reefs, which also face other stresses due to warming.
Co
mparison of Projected
and Observed Sea-Level Rise
with greenhouse gases held constant during the period from 2100 to 2200. One study found that the meridional overturning circulation, which is projected to decline by as much as 50% by 2100, did not decline further after that. In some models, the circulation strengthened some-what over the course of the 22nd century. Although this suggests that a complete shutdown of this circulation, and the major cool-ing across Western Europe that it would bring, may be unlikely, more long-term modeling must be done to assess whether meridional overturning circu-lation changes might become permanent beyond 2100.
One of the most dramatic changes at Earth’s surface linked
to global warming is the ongoing loss of sea ice across the Arctic Ocean. Although the predicted year varies, by the end of the 21st century most models predict an essentially ice-free Arctic in late summer. The two models with the most sophisticated treatment of sea ice predict that the Arctic will lose its winter ice as well, should CO
2 quadruple from preindus-trial values and remain at that level for several centuries. While an ice-free Arctic could present new economic opportunities, it will also likely have profound impacts on both local and global climate and ecological systems. Among these is the potential to enhance the rate of surface melt of Greenland’s glaciers, which would further accelerate sea-level rise.
A
s climate change unfolds, there are
likely to be surprises, including
outcomes that are dificult or impossible
for any model to quantify.
Complexities and
surprises in a
warming world
As climate change unfolds, there are likely to be surprises, includ-ing outcomes that are difficult or impossible for any model to quantify. National security is one area where a warming Earth and its effects on human societies could have substantial implica-tions. Some of the world’s most intractable conflicts are in regions of food and water scarcity, which are closely tied to variability in temperature and precipitation. One study has found correlations between global
tempera-ture shifts since 1400 and the frequency of wars and related death rates. In Africa, another study suggests that civil wars since 1980 have been roughly 50% more likely in years 1°C warmer than average.
As the time frame of climate change extends to 2100 and beyond, the range of possi-ble outcomes widens further. Ecosystem shifts that are projected to unfold over the next century, such as the expan-sion of Arctic shrublands and the potential decline of some parts of the Amazonian rainforest due to drought, could grow in breadth and intensity.
Just as many effects on the physical climate system can now be identified
and quantified for various degrees of global warming, so too can several of
the impacts expected during the next few decades and centuries.
Climate
Stabilization Targets
identifies and quantifies impacts on food security, coastlines
and infrastructure, streamflow, and wildfire. Effects on human health and
land and ocean ecosystems are also identified but cannot yet be quantified.
Foo
d and
human health
• Yields of corn in the United States and Africa, and wheat in India, drop by 5-15% per degree of warming
• If 5°C (9°F ) of global warm-ing were to be reached, most regions of the world experi-ence yield losses, and global grain prices potentially double
• Crop pests, weeds, and dis-ease shift in geographic range and frequency
• Risk of heat-related illness and death increases
• The timing and geographic range of allergens and vector-borne diseases shifts
Societal well-being in the United States and elsewhere is expected to be affected by a changing climate both directly— as pathogens and other threats evolve—and indirectly, as changes in climate influence food production.
All else aside, increasing the amount of CO2 in the atmo-sphere favors the growth of many plants. Leaf pores, or stomata, shrink in response to the added CO2, which helps plants to conserve water. The enhanced CO2 also stimulates
photosynthesis in plants with a C3 photosynthetic pathway, such as rice and wheat, although not in plants with a C4 path-way, such as maize (i.e., corn). C3 yields could increase by an average of more than 10% if CO2 were doubled over preindustrial values, all else being equal.
Enhanced plant growth from elevated CO2 does not neces-sarily translate into more food, however, because climate changes caused by CO2 can reduce yields in many regions. Crops tend to grow more quickly in warmer temperatures, leaving less time to produce grains. In addition, a changing climate will bring other hazards, including greater water stress and the risk of higher temperature peaks that can quickly damage crops.
Modeling indicates that the CO2-related benefits for some
crops will largely be outweighed by negative factors if global temperature rises more than 1.0°C from late 20th-century values. The true risks may be even greater, as some potentially negative changes—including the likelihood of longer, more wide-spread drought and the potential for weeds, insects, and crop pathogens to spread—are not yet incorporated in most crop models.
Growers in prosperous areas may be able to partially or completely adapt to these threats, for example, by vary-ing the crops they grow and the times at which they are grown. Adaptation may be less effective where local warming exceeds 2°C, however. Its use will also be limited in the trop-ics, where the growing season is restricted by moisture rather than temperature.
Some impacts that can be quantified per degree of warming include:
• 5-15% reductions in the yields of crops as currently grown
• 3-10% increases in the amount of rain falling during the heaviest precipitation events
• 5-10% decreases in streamflow in some river basins, including the Arkansas and the Rio Grande • 200-400% increases in the area burned by wildfire in parts of the western United States
Climate’s effect on human health is mixed with many other influences, making it difficult
to quantify the net risks of climate change. Some insights have been gained, though. For example:
• In recent decades, heat and cold have killed about three times as many people as all other natu-ral disasters combined. As global temperatures rise, the risk of heat-related illnesses and deaths should rise, while the risk of cold-related illnesses and deaths should drop.
• In contrast to earlier findings, insect-borne disease may not change dramatically in preva-lence but may shift location, with the ranges of malaria and other
diseases moving toward some areas but away from others. • Recent studies have highlighted the risks to human health from changes in air and water quality. Ground-level ozone, a lung irri-tant that may trigger asthma in children, could increase in cities around the world as temperatures increase, assuming that the pollut-ants leading to low-level ozone are not reduced. Intensified rainfall will challenge drainage systems and boost the risk of water contami-nation. Recent increases in the length of the pollen season may also boost the incidence of aller-gies, although this is an evolving area of research.
Lo
ss of Crop Yields per Degree Warming
Figure 13. Yields of corn in the united States and Africa, and wheat in india, are projected to drop by 5-15% per degree of global warming. This figure shows projected changes in yield as a function of average global temperature increase for those crops as well as for u.S. soybeans and Asian rice. The expected impacts on crop yield are from both warming and carbon diox-ide increases, assuming no crop adaptation. Solid lines show best estimates, and shaded regions show ranges of projections. Values of global temperature change are relative to the preindustrial value; current global temperatures are roughly 0.7°C (1.3°F) above that value.
WHAT DOES IT MEAN?
The U.S. Corn Belt is projected to experience a loss of 11% corn production
per degree of warming, while at the same time global cereal demand
is expected to rise by roughly 1.2% per year.
That means that farmers would have to work every year to overcome
Co
astlines and
infrastructure
• At a mean sea-level rise of 0.5 meters (20 inches), coastal flooding becomes a threat to 5-200 million people
that impact infrastructure increases
• Demand increases for air con-ditioning and decreases for winter heating
Global population growth is largely centered in coastal cities, many of which may soon be at risk from sea-level rise. However, quantifying the future threat posed to particular coastlines by rising seas and floods is very challenging. Many nonclimatic factors are involved, and the risks will vary greatly from one location to the next. Moreover, infrastructure damage is often triggered by extreme events rather than gradual change. There are some clear “hot spots,” particularly in large urban areas on coastal deltas, includ-ing those of the Mississippi, Nile, Ganges, and Mekong rivers (see Figure 16). Risks to these areas may accelerate if global mean sea level (relative to 1980-1999 average levels) rises beyond 0.3 meters (12 inches), which is expected later this century. At the same time, much can be done to change infrastructure and reduce risk, although it is difficult to make broad-based estimates of vulnerability and potential adaptation costs on coastal infrastructure.
If mean sea level rises by 0.5 meters (20 inches) relative to a 1990 baseline, coastal flood-ing could affect anywhere from 5-200 million people. Up to 4 million people could be perma-nently displaced as erosion could claim more than 250,000 square kilometers of wetland and dryland (98,000 square miles, an area the size of Oregon).
Migra-Increases in the Duration of Heat Waves
Figure 14. Heat waves are expected to last longer as the average global temper-ature increases. Values shown are the changes in the heat-wave-duration-index, measured in days. The index is defined as the longest period each year with at least 5 consecutive days in which daily high temperatures are at least 5°C above the climatological (1961-1990) average for that same calendar day. Projected changes are for 20-year periods during which average global temperature increased by 1°C, 2°C, and 3.5°C, respectively, relative to the 1961-1979 average.
+ 3.5°C
+ 2°C
+ 1°C
• The Arctic experiences major changes affecting infrastruc-ture, including a shorter land transportation season and longer marine transportation season
“Ho
t Spots” of Vulnerability to Sea-Level Rise
Figure 15. Although it is ver y difficult to quantify the future threat posed by rising s e a s a n d f l o o d s to a ll c o a s t a l p o p u l a t i o n s , s eve r a l “ h ot s p ot s” c a n b e i d e n t i -fied. Large urban areas on coastal deltas, including those of the Mississippi, Nile, ganges, and Mekong rivers, are highlighted. This map shows the relative vulnerabil-ity of coastal deltas to sea-level rise that exacerbates natural and human induced subsidence and amplifies the surge intensities of coastal storms. Larger dots indi-cate populations that could be displaced by 2050 if current sea-level trends continue.
tions are already occurring in towns along the coast of Alaska, where reductions in sea ice and melting permafrost allow waves to batter and erode the shoreline.
Many U.S. urban areas are considering a range of adap-tations to the risk of increased flooding on and near coastlines. Proposals being explored include large-scale water diversion from the highly developed Sacramento– San Joaquin Delta in California, which lies below sea level, and flood-protection barricades in
the New York area, a technique already employed near London, St. Petersburg, and Venice.
The use and availability of energy will also be affected by climate change in several ways. Demand for air conditioning is expected to continue to grow in many areas worldwide as temper-atures rise, which poses the risk for electricity shortages related to peak demand. Hydropower, which accounts for most electric-ity in South America and northern Europe, is vulnerable to rainfall
and snowfall variations: every 1% change in precipitation produces about a 1% change in power generation. However, projecting future climate effects on hydro-power is limited by uncertainties in projecting precipitation changes on a local and regional scale.
Streamflow
and fire
• Streamflow decreases by 5-10% per degree of warming in some river basins, includ-ing the Arkansas and the Rio Grande
• Average area burned by wildfire per year in parts of western United States increases by two to four times per degree of warming
In many areas, streamflow is criti-cal to the availability of water. Although each human needs only about 5 liters (1.3 gallons) of water per day for survival, the average daily per-capita water use varies from about 10 liters (2.6 gallons) in Africa to 200 liters (53 gallons) per day in the United States. About 90% of all water use worldwide is for agriculture.
During a year’s time, stream-flow generally equals runoff—the amount of water from snow or rain that flows into rivers and creeks. However, it is not a straightforward task to convert runoff to streamflow in climate modeling. The most common technique is to feed the output from global-model projections of climate into a separate model that depicts smaller-scale river-basin hydrology. In other cases,
global models have been used to directly project runoff based on modeled rainfall and snowfall. Though limited by the resolution of global models, this technique has been shown to be useful for larger river basins.
By using the second tech-nique—direct analysis of runoff from global climate models used in the Fourth Assessment Report (AR4) from the IPCC— we find that future runoff is likely to decrease throughout most of the United States, except for parts of the Northwest and Northeast, with particularly sharp drops in the Southwest. This generally occurs because enhanced evaporation from warming outweighs any poten-tial runoff gain from increases in precipitation. These decreases in U.S. runoff are similar across
most of the IPCC scenarios, and they grow at roughly a linear pace within the range of 1-2°C of global warming. Globally, streamflow in many temperate river basins outside Eurasia is likely to decrease, especially in arid and semiarid regions.
Rising temperatures and increased evaporation can also be expected to boost the risk of fire in some regions. In general, forests that are already fire-prone, such as the evergreen forests of the western United States and Canada, should become even more vulnerable to fire as temperatures warm. At the same time, areas dominated by shrubs and grasses, such as parts of the U.S. Southwest, may see a reduction in fire over time. In these regions, a wet year can boost fire risk the following