AUTOMATIC CALCULATION OF OIL SLICK AREA FROM MULTIPLE SAR
ACQUISITIONS FOR DEEPWATER HORIZON OIL SPILL
Batuhan Osmano˘glu1, Cos¸kun ¨Ozkan2, Filiz Sunar3, Gordon Staples4
1
University of Alaska - Fairbanks, P.O. Box 757320, Fairbanks, AK 99775, [email protected] 2
Erciyes University, Engineering Faculty, Geodesy and Photogrammetry Engineering Dept., 38039 Kayseri,Turkey, [email protected] 3
Istanbul Technical University, Civil Engineering Faculty, Geomatics Engineering Dept., 34469 Maslak Istanbul, Turkey, [email protected] 4
MDA, 13800 Commerce Parkway, Richmond, V7S 1L5, Canada, [email protected]
Commission VII, WG VII/2
KEY WORDS:Marine pollution, Oil spill detection, Probability map, SAR
ABSTRACT:
The Deepwater Horizon oil spill occurred in the Gulf of Mexico in April 2010 and became the largest accidental marine oil spill in history. Oil leaked continuously between April 20th and July 15th of 2010, releasing about780,000m3
of crude oil into the Gulf of Mexico. The oil spill caused extensive economical and ecological damage to the areas it reached, affecting the marine and wildlife habitats along with fishing and tourism industries.
For oil spill mitigation efforts, it is important to determine the areal extent, and most recent position of the contaminated area. Satellite-based oil pollution monitoring systems are being used for monitoring and in hazard response efforts. Due to their high accuracy, frequent acquisitions, large area coverage and day-and-night operation Synthetic Aperture Radar (SAR) satellites are a major contributer of monitoring marine environments for oil spill detection.
We developed a new algorithm for determining the extent of the oil spill from multiple SAR images, that are acquired with short temporal intervals using different sensors. Combining the multi-polarization data from Radarsat-2 (C-band), Envisat ASAR (C-band) and Alos-PALSAR (L-band) sensors, we calculate the extent of the oil spill with higher accuracy than what is possible from only one image. Short temporal interval between acquisitions (hours to days) allow us to eliminate artifacts and increase accuracy.
Our algorithm works automatically without any human intervention to deliver products in a timely manner in time critical operations. Acquisitions using different SAR sensors are radiometrically calibrated and processed individually to obtain oil spill area extent. Furthermore the algorithm provides probability maps of the areas that are classified as oil slick. This probability information is then combined with other acquisitions to estimate the combined probability map for the spill.
1 INTRODUCTION
Marine oil spills are a common threat to all sea bordering coun-tries. The environmental and related economical losses due to an oil spill can be large, and many methods have been developed to monitor oceans in operational conditions. In most cases it is critical to respond to spills in a timely manner, and therefore it is important for such operational systems to provide results in near real time. Once a spill is detected, its behavior can be modeled based on physical models.
Synthetic Aperture Radar (SAR) systems provide a viable option of oil slick monitoring. SAR intensity images are sensitive to surface roughness which is altered in the case of an oil spill. The scattering of oil-free ocean surface is dominated by Bragg scat-tering (Bragg, 1913). A thin oil sheen covering the ocean will reduce the ocean-atmosphere interaction, and alter the smooth-ness of the surface. Therefore, oil slicks appear slightly darker in moderate wind conditions in SAR imagery. SAR systems have an ideal range of wind speed and direction where they are most sensitive, and do not perform well for oil spill detection under very windy or very calm conditions.
There are of course other methods to monitor oceans and detect oil spills, such as optical and infra-red remote sensing, and hy-perspectral imaging (Brekke and Solberg, 2005). No matter how complex or advanced a method is single-handedly all have dif-ferent levels of uncertainties. Therefore it is important to com-bine many observations complementing each other’s weaknesses providing the best possible information. Results from different
remote sensing sensors, as well as field observations can be com-bined, and statistically provide an outcome better than any indi-vidual resource.
In this paper we develop a fully automatic oil spill monitoring systems that is capable of combining data from multiple SAR sources. The focus of this paper is on radar imagery, however the algorithm can be then be expanded to optical imagery and ground measurements as discussed later. A brief background on the technical aspects is provided in Section 2. Results obtained from SAR data over the Deepwater Horizon oil spill are discussed in Section 3.
2 BACKGROUND
Synthetic Aperture Radar imagery is sensitive to surface rough-ness which is altered in case of an oil spill (Alpers and H¨uhnerfuss, 1988). Oil slicks change the smoothness of ocean surface and appear darker compared to surrounding oil free ocean, however the amount of damping is affected with wind and wave condi-tions. Furthermore the speckle effect in SAR imagery limits the reliability of point measurements in the image, causing spurious results (Brekke and Solberg, 2005). In our approach we apply a multiple step processing to limit the adverse effects of speckle, instead of filtering the data with a speckle filter.
There are many methods developed to detect oil spills from SAR intensity images: (1) machine learning and neural-network recog-nition (Kubat et al., 1998, Ozkan and Sunar, 2007), (2) frequency spectrum attenuation (Lombardini et al., 1989, Gade et al., 1998, International Archives of the Photogrammetry, Remote Sensing and Spatial Information Sciences, Volume XXXIX-B7, 2012
XXII ISPRS Congress, 25 August – 01 September 2012, Melbourne, Australia
Kim et al., 2010), (3) segmentation techniques (Barni et al., 1995, Solberg et al., 2007), (4) slick feature extraction (Fiscella et al., 2000, Del Frate et al., 2000). Some algorithms also combine ocean drift models to assist data analysis (Espedal, 1999, Cheng et al., 2011). In addition to SAR intensity, co-polarization differ-ences of multiple polarization SAR data is also suggested for oil spill detection (Migliaccio et al., 2009).
In this paper, our focus is not on developing a method that per-forms better than any one of the methods mentioned earlier, but instead to develop a practical framework where results from dif-ferent methods and sources can be combined to provide a joint solution, which is likely to have less uncertainty. The method can be easily extended to include any geospatial observation (e.g. optical remote sensing, ground measurements), however in this paper our focus is on SAR imagery. The algorithm is composed of three calculation steps: (1) Pixel (point) probability, (2) spatial probability, and (3) spatio-temporal probability. Point probabil-ity is calculated based on normalized radar cross section, where darker pixels get higher probabilities for oil contamination (Barni et al., 1995). Spatial probability is based on the damping ratio given the current wind conditions and imaging parameters (Gade et al., 1998, Kim et al., 2010). Point and spatial analysis results are then combined to provide a joint probability for oil slick at each acquisition. The spatio-temporal probability is estimated from multiple SAR acquisitions separated shortly in time, result-ing in a time varyresult-ing probability of oil slick over target area. All analysis in this paper is done over intensity calibrated, geocoded SAR imagery. Images are calibrated to normalized radar cross section (NRCS). The imagery is resampled to a common geome-try using a sinc interpolator, and land-masked using Global, Self-consistent, Hierarchical, High-Resolution Shoreline data (GSHHS) (Wessel and Smith, 1996).
First and second steps of the algorithm are iterative, and are per-formed at the same time. The first step of the algorithm is a sim-ple dark-object selection routine based on intensity thresholding. At this step, dark areas of the image are assigned a higher proba-bility for an oil spill. The initial threshold for the first step is the noise equivalent sigma zero (NESZ), which is the sensors noise floor. A probability value for each pixel is assigned based on it’s intensity such that:
P(W|σ0) = (σ0−min(σ0))/(T−min(σ0)) (1)
P(O|σ0) = 1−P(W|σ0) (2)
whereP(W|σ0)is probability of oil-free water given the NRCS,
Tis the threshold, andP(O|σ0)is the probability of oil given the NRCS is the complement ofP(W|σ0). TheP(W|σ0)is modi-fied by bringing all larger values to1, constraining the probability values between0and1. Furthermore, iterations start using a mul-tilooked imagery, to reduce the effect of speckle noise. It is worth noting that the multilooking operation changes the dynamic range of the radar imagery. In order to keep the thresholds equivalent at each iteration, multilooked images are further calibrated to have the same dynamic range as the full resolution image.
The second step of the algorithm starts with calculation of damp-ing factor after Gade et al. (Gade et al., 1998, Kim et al., 2010). The estimated damping factors at different wind speeds as a func-tion of Bragg wavenumbers are shown in Figure 1. Figure 1 also shows the maximum theoretical observation range for Radarsat-2, Envisat-ASAR, and Alos-PALSAR SAR systems. The Bragg wavenumber is defined as (Gade et al., 1998):
kB = 2k0sin(φ) (3) wherekB is the Bragg wavenumber,k0 is the radar
wavenum-ber, andφis the incidence angle. Figure 1 shows the maximum expected damping amount which would be observed when the an-gle between the wind, and radar wave is zero. ALOS-PALSAR is not expected to be effective in mild wind conditions, as shown in the figure. The SAR sensors on-board Radarsat-2 and En-visat are both C-Band, and therefore cover similar regions in the wavenumber domain. The slightly larger coverage of Radarsat-2 is due to it’s larger range of incidence angles.
Figure 1: Estimated damping factor as a function of Bragg wavenumber. The theoretical range of SAR systems used in the system are marked with horizontal lines. Each curve represents a different wind velocity.
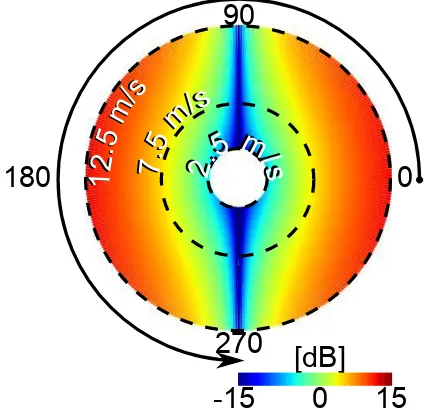
Wind is an important factor to estimate the damping factor, which is also dependent on the relative angle between radar wave and wind direction. Figure 2 shows a plot of expected damping fac-tors at speeds between 2.5 m/sand 12.5m/s. The relative wind direction is plotted at counter-clockwise increasing angles, starting from zero at the horizontal axis. In this study we use wind speed, direction and ocean wave group velocity data from National Data Buoy Center station 42040, located at 29.122N, 88.207W, about 40km NNW of the Deepwater Horizon oil rig.
0
270
180
90
2
2
.5
.5
m/s
m/s
7
.5
m
/s
1
2
.5
m
/s
1
2
.5
m
/s
7
.5
m
/s
[dB]
-15
0
15
Figure 2: Estimated damping factor plotted against the relative angle between radar and wind direction. Radial distance from the center indicates the wind speed.
The first and second steps of the algorithm are run iteratively at five different spatial resolutions. The analysis is performed in a pyramid structure with five different stages. At each stage the im-age is multilooked to the power of two, such that at the first stim-age International Archives of the Photogrammetry, Remote Sensing and Spatial Information Sciences, Volume XXXIX-B7, 2012
XXII ISPRS Congress, 25 August – 01 September 2012, Melbourne, Australia
the image is multilooked to25
, and to24
at the second stage. Both the intensity thresholding and damping factor methods pro-vide results at each stage which are combined using:
JP(O) = P(O|n)∗P(O|d)
P(O|n)∗P(O|d) +P(W|n)∗P(W|d) (4)
whereJP(O)is the joint probability for oil,P(O|n), is the prob-ability of oil given the NRCS,P(O|d)is the probability of oil given the damping factor analysis,P(W|n)is the probability of clear water given the NRCS, andP(W|d)is the probability of clear water given the damping factor analysis. The main reason for combining the two probability functions is that the damping factor analysis will return low probabilities for the center of large slicks. This is due to the fact that the damping factor is calculated against a moving window average. For oil slicks larger than the size of the moving window, the average and pixel values will be very close, returning no dampening. Of course a larger window size can be used to eliminate this problem, however, since that would require human intervention. Contrary to the damping fac-tor analysis, the NRCS based thresholding algorithm will return high probabilities for the center of the slick.
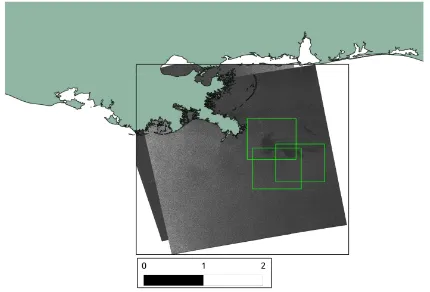
The study area is shown in Figure 3, and is about350km×350km, centered around the Deepwater Horizon oil spill. The locations of the ALOS-PALSAR and Radarsat-2 imagery are shown in the figure. It should be noted that even though the SAR imagery is calibrated to NRCS, there is still a gradual change in intensity along the range direction (Figure 3). The Gulf of Mexico oil spill provides a great test case for the new algorithm, because it is lo-calized and continuous over time. Furthermore there are many published research and ground observations available for validat-ing the method.
Figure 3: The black-box shows our designated study area. GSHHS shoreline is shown in light green. The SAR intensity images are from Radarsat-2, and the one on top is acquired on April 24th 2010. Light green boxes show the footprints for the ALOS PALSAR imagery. The legend shows distance in degrees.
3 RESULTS AND DISCUSSION
SAR images acquired from Radarsat-2 and Alos were processed using the proposed method. Some of the imaging parameters and environmental conditions are summarized in Table 1. Table shows the observed wind-speed, relative angle between the wind and radar wave, and the calculated damping factor (D.F.). The damping factor calculation also takes into account the wave group velocity, and radar incidence angle which are not listed in the ta-ble. The damping factors listed for ALOS-PALSAR are rather low, however they are still above the NESZ of the instrument,
which is about−29dBfor the fine beam single (FBS) imaging mode.
Date Sensor Wind Speed Wind Angle D.F. [m/s] [degrees] [dB]
04-27 Radarsat-2 7.3 173.6 6.6
05-01 Radarsat-2 9.8 228.4 7.6
05-01 Alos-Palsar 7.8 77.0 -16.5
05-04 Alos-Palsar 3.2 50.3 -8.5
Table 1: Data Table
The results of oil spill detection algorithm is shown in Figure 4. The probability maps calculated for the five iterative steps us-ing two different methods and their combination are presented. The results are shown in ascending order of resolution, where the 25
multilooked image is located at the left hand side. The final solution for the processed imagery is shown in the bottom right corner. The joint probability (JP(O)) is calculated using the NRCS based oil probability (P(O|n)) and damping factor based oil probability (P(O|d)) as shown in (4).
Multilook
P
(O
|n
)
P
(O
|d
)
JP
(O
)
5 4 3 2 1
Oil Slick Probability
0 0.5 1
Figure 4: Results for the first (point probability) and second (spa-tial probability) processing steps, for the Radarsat-2 data acquired on April 27th, 2010.
The complementing behavior of the two methods can be seen in Figure 4. While theP(O|n)has very little noise at high multi-looking, the opposite is true forP(O|d), which becomes less and less noisy with decreasing multilooking. Furthermore, the void in the center of the oil spill is visible inP(O|d)results for level five.
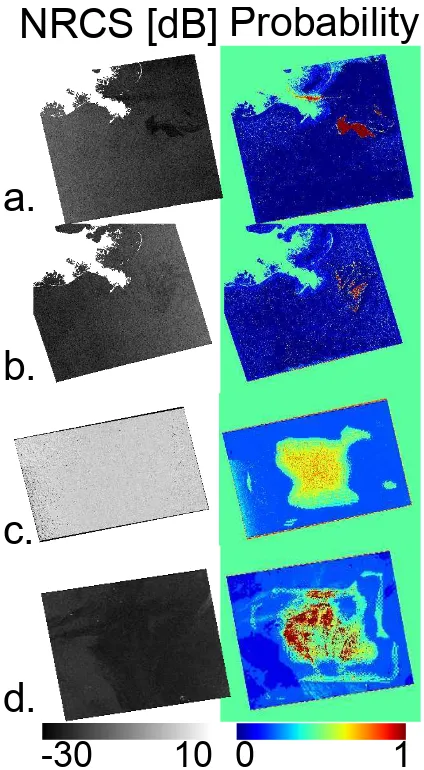
Final results of all the images processed in this study are shown in Figure 5. The analysis using Radarsat-2 imagery obtained better results compared to the Alos imagery. This is very likely due to the small damping factors that are obtained at L-band, as shown in Figure 1. The current algorithm does not employ any weighting to the data, therefore the combined probability of all observations are inconclusive. This can be improved however, by implement-ing a more complex filter to the final stage, such as a Kalman filter, or by simply adding more C-band data to dominate the re-sults. We recently acquired additional imagery from Envisat to test our hypothesis. Utilizing a Kalman filter at the final step of the algorithm will allow for utilizing a larger spectrum of methods and data sets, which may only be useful under certain conditions. It is also worth noting that the Alos-PALSAR imagery, acquired on May 1st, 2010 at 04:10 UTC shows almost no brightness vari-ation.
International Archives of the Photogrammetry, Remote Sensing and Spatial Information Sciences, Volume XXXIX-B7, 2012 XXII ISPRS Congress, 25 August – 01 September 2012, Melbourne, Australia
-30
10 0
1
NRCS [dB] Probability
a.
b.
c.
d.
Figure 5: Joint probabilities for the imagery processed in this study. a)Radarsat-2 27-Apr, b)Radarsat-2 May, c)Alos 01-May, d)Alos 04-May. Alos results are enlarged for clarity.
4 CONCLUSIONS AND FUTURE WORK
More and more remote sensing data is becoming available ev-ery day, some of which are applicable to the the detection of oil spills. In this paper, we presented a method to combine SAR data from multiple sensors, acquired at different times from different geometries, to obtain a combined oil slick probability map for the Deepwater Horizon oil spill. Furthermore, it is also possible to combine results from different algorithms applied to the same data set, to increase accuracy as presented in this paper.
Our fully automatic algorithm can be expanded to include other sensors (e.g. optical, infra-red, hyperspectral), and can be cus-tomized to the operational needs. The algorithm can operate with any sensor and any algorithm that can provide a probability map. The intuitive probability maps assist operators and ground per-sonnel in determining which areas to prioritize. Expansion of the algorithm to utilize MODIS imagery, and a neural-network based SAR oil spill algorithm for a future study is currently under con-sideration.
ACKNOWLEDGEMENTS
The authors would like to thank MDA Geospatial Services for Radarsat-2 data, Alaska Satellite Facility for Alos-PALSAR data, and the European Space Agency for Envisat-ASAR data.
REFERENCES
Alpers, W. and H¨uhnerfuss, H., 1988. Radar signatures of oil films floating on the sea surface and the marangoni effect. Journal of Geophysical Research 93(C4), pp. 3642–3648.
Barni, M., Betti, M. and Mecocci, A., 1995. A fuzzy approach to oil spill detection an sar images. In: Geoscience and mote Sensing Symposium, 1995. IGARSS’95.’Quantitative Re-mote Sensing for Science and Applications’, International, Vol. 1, IEEE, pp. 157–159.
Bragg, W., 1913. The diffraction of short electromagnetic waves by a crystal. In: Proceedings of the Cambridge Philosophical Society, Vol. 17, pp. 43–57.
Brekke, C. and Solberg, A., 2005. Oil spill detection by satellite remote sensing. Remote Sensing of Environment 95(1), pp. 1–13.
Cheng, Y., Li, X., Xu, Q., Garcia-Pineda, O., Andersen, O. and Pichel, W., 2011. Sar observation and model tracking of an oil spill event in coastal waters. Marine pollution bulletin 62(2), pp. 350–363.
Del Frate, F., Petrocchi, A., Lichtenegger, J. and Calabresi, G., 2000. Neural networks for oil spill detection using ers-sar data. Geoscience and Remote Sensing, IEEE Transactions on 38(5), pp. 2282–2287.
Espedal, H., 1999. Satellite sar oil spill detection using wind his-tory information. International Journal of Remote Sensing 20(1), pp. 49–65.
Fiscella, B., Giancaspro, A., Nirchio, F., Pavese, P. and Trivero, P., 2000. Oil spill detection using marine sar images. Interna-tional Journal of Remote Sensing 21(18), pp. 3561–3566.
Gade, M., Alpers, W., H¨uhnerfuss, H., Wismann, V. and Lange, P., 1998. On the reduction of the radar backscatter by oceanic surface films: Scatterometer measurements and their theoretical interpretation. Remote Sensing of Environment 66(1), pp. 52–70.
Kim, D., Moon, W. and Kim, Y., 2010. Application of terrasar-x data for emergent oil-spill monitoring. Geoscience and Remote Sensing, IEEE Transactions on 48(2), pp. 852–863.
Kubat, M., Holte, R. and Matwin, S., 1998. Machine learning for the detection of oil spills in satellite radar images. Machine learning 30(2), pp. 195–215.
Lombardini, P., Fiscella, B., Trivero, P., Cappa, C. and Garrett, W., 1989. Modulation of the spectra of short gravity waves by sea surface films: slick detection and characterization with a mi-crowave probe. Journal of Atmospheric and Oceanic Technology 6, pp. 882–890.
Migliaccio, M., Nunziata, F. and Gambardella, A., 2009. On the co-polarized phase difference for oil spill observation. Interna-tional Journal of Remote Sensing 30(6), pp. 1587–1602.
Ozkan, C. and Sunar, F., 2007. Comparisons of different semi-automated techniques for oil spill detection: A case study in lebanon. In: Mario A. Gomarasca (ed.), 27th EARSeL Sym-posium on GeoInformation, Millpress Rotterdam.
Solberg, A., Brekke, C. and Husoy, P., 2007. Oil spill detection in radarsat and envisat sar images. Geoscience and Remote Sensing, IEEE Transactions on 45(3), pp. 746–755.
Wessel, P. and Smith, W., 1996. A global, self-consistent, hierar-chical, high-resolution shoreline database. JOURNAL OF GEO-PHYSICAL RESEARCH-ALL SERIES- 101, pp. 8741–8743. International Archives of the Photogrammetry, Remote Sensing and Spatial Information Sciences, Volume XXXIX-B7, 2012
XXII ISPRS Congress, 25 August – 01 September 2012, Melbourne, Australia