VEGA-CONSTELLATION TOOLS TO ANALIZE HYPERSPECTRAL IMAGES
V. Savorskiy ab, *, E. Loupian a, I. Balashov a, A. Kashnitskii a, A. Konstantinova a, V. Tolpin a, I. Uvarov a, O. Kuznetsov b, S. Maklakov b, O. Panova b, E. Savchenko b
a Space Research Institute RAS, 117997, 84/32 Profsoyuznaya Str, Moscow, Russia - [email protected]
bKotel’nikov Institute of Radioengineering and Electronics of Russian Academy of Sciences, Fryazino Department,
Vvedenskogo sq., 1, Fryazino, Moscow region, Russia - [email protected]
Commission IV, WG IV/5
KEY WORDS: Services, Remote, Infrastructure, Distributed, System, Internet/Web
ABSTRACT:
Creating high-performance means to manage massive hyperspectral data (HSD) arrays is an actual challenge when it is implemented to deal with disparate information resources. Aiming to solve this problem the present work develops tools to work with HSD in a distributed information infrastructure, i.e. primarily to use those tools in remote access mode. The main feature of presented approach is in the development of remotely accessed services, which allow users both to conduct search and retrieval procedures on HSD sets and to provide target users with tools to analyze and to process HSD in remote mode. These services were implemented within VEGA-Constellation family information systems that were extended by adding tools oriented to support the studies of certain classes of natural objects by exploring their HSD. Particular developed tools provide capabilities to conduct analysis of such objects as vegetation canopies (forest and agriculture), open soils, forest fires, and areas of thermal anomalies. Developed software tools were successfully tested on Hyperion data sets.
1. INTRODUCTION
Recently a remarkable progress has been observed towards greater open access to hyperspectral data (HSD). So, for example, NASA space data centers and NASA contractors increased access to data of hyperspectrometers Hyperion (EO-1, 2003) and HICO (HICO, 2014) mounted onboard satellites NASA EO-1 and International Space Station (ISS), respectively. In 2013, the Russian satellite "Resurs-P" with domestic hyperspectrometer HSA produced by S.A. Zverev Krasnogorskiy Zavod was launched (Arkhipov et al., 2014), whose data also became available for wide research community. This new situation calls for creating data provider services to manage HSD, including not only data ordering capabilities but also a set of analytic tools for remote analysis and processing HSD on data provider facilities.
One of the main obstacles to widening hyperspectrometer application is the fact that satellite hyperspectrometers cannot provide regular and sufficiently frequent coverage of Earth areas on global or even on regional scale. This is why currently hyperspectrometer applications are interesting mainly for scientific researchers. In this regard, the possibility of joint analysis of HSD with multispectral data (MSD) is of great interest. It is necessary primarily for a clear and deeper understanding of various objects and phenomena that we can now permanently monitor using a number of satellite Earth observing systems. Therefore, the introduction of capabilities to work simultaneously with hyperspectral and multispecral data into Earth observation (EO) information systems (IS), whose services and information resources are designed to solve scientific and applied tasks, is actual and relevant.
Assimilation of HSD in EO IS implies not merely adding HSD sets but also upgrading existing functionality to deal with unique HSD features. At least, such software (SW) tools as spectral
* Corresponding author
analysis, HSD classification, and hyperspectral indices exploration should be added. One should keep in mind that these tools have to manage massive and rapidly growing HSD arrays in distributed infrastructure. A common approach to deal with the problem was elaborated in (Loupian et al., 2012). The main conclusion of this work is that efficient usage of EO data (fast data processing, reliable and comprehensive results, capabilities to analyze multiyear global data sets, etc.) can be achieved if we provide users not only with EO data sets and products but also with remotely accessible SW tools to manage and analyze these data sets via Web interfaces. This approach to managing HSD is implemented in the present work.
The main aim of the work was to develop tools to work with HSD in a distributed information infrastructure, i.e. primarily in the remote users access mode via Web interfaces. They should allow users to not only do search-and-retrieval operations on HSD but also provide capabilities to analyze and configure HSD processing procedures in remote mode.
Currently there is an abundance of EO IS (see e.g. references in (Loupian et al., 2012)) providing Web access to catalogues and archives of EO data. However, implementations of SW tools to work with EO data, i.e. to analyze and process them by user requests, in remote mode via common Web interfaces of an EO IS are scarce. Such type of IS was implemented in VEGA-Constellation IS family by research and development team of the Space Research Institute of the Russian Academy of Sciences (IKI RAS) (Loupian et al., 2011; Bartalev et al., 2012; Uvarov et al., 2014; Savorskiy et al., 2014; VEGA, 2015). Design and development of VEGA-Constellation information systems is based on original GEOSMIS technology also elaborated by the IKI RAS team.
2. GEOSMIS TECHNOLOGY ARCHITECTURE
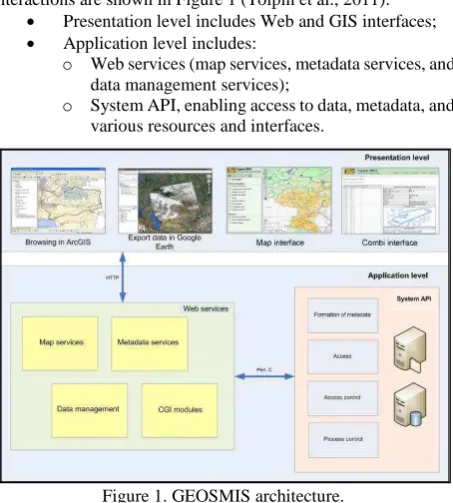
GEOSMIS technology was designed by IKI RAS development team (Tolpin et al., 2011; Savorskiy et al., 2012). GEOSMIS architecture consists of two functional levels whose functional interactions are shown in Figure 1 (Tolpin et al., 2011):
Presentation level includes Web and GIS interfaces;
Application level includes:
o Web services (map services, metadata services, and data management services);
o System API, enabling access to data, metadata, and
various resources and interfaces.
Figure 1. GEOSMIS architecture.
Presentation level is a subsystem that supports interaction with user. This level allows users to work with the system via Web interface or via specialized applications, e.g. GIS. As typical GIS is provided with all basic tools to work with map data, its interactions with GEOSMIS should run on data service level. This is the reason why GEOSMIS is oriented on the development of unified data access interfaces. Presentation level is shown in Figure 2 (Tolpin et al., 2011).
Figure 2. Presentation level architecture.
Work of such interfaces is enabled by a kernel consisting of two object modules:
Map object module is implemented as smisMap;
Metadata object module is implemented as smisMeta.
Map object module displays map information retrieved by data services. In addition, the module allows to send spatial queries and to export displayed data to print service or even to other systems. Metadata object module supports catalog data search and retrieval of data necessary for information displaying on rendering service.
Application level is a subsystem that should enable interaction between interfaces and data. This level consists of CGI services,
core services, system API, and plugins as shown in Figure 3 (Tolpin et al., 2011; Savorskiy et al., 2012).
Figure 3. Structure of Application level functional modules
CGI services receive data via HTTP protocols. In order to provide Application level functionality, three types of CGI services are envisaged:
Map service;
Metadata service;
Data service.
All three types of Web services are realized in frame of one common strategy i.e. are integrated in one common service. Those common services enable support of map data receiving (via GetMap request that is generated in interface by smisMap module), queries on metadata receiving (via GetMetadata request that is generated in interface by smisMeta module), requests on data addition and modification, e.g. addition of polygons and information about them. So, CGI interfaces are capable to provide direct interaction with metadata retrieving services and map information displaying. It is important that they can interact with any amount of spatially distributed services.
System API is a separated part of Application level. It is composed of a set of Perl modules that are located on servers and can get data and work with them on server side. All the other Application level services work with data via those modules. Each module takes responsibility for a definite data type or system part. This allows flexible system configuration, error fixing, and fast software development.
The above approach formed the basis for flexible and robust development of analytical SW tools running in remote access mode with distributed Earth observation data sets. This is proved by GEOSMIS technology implementation (Tolpin et al., 2011) in various monitoring systems operating in Russia, including:
Integrated interface to work with the data of informational system of remote monitoring of the Federal Forestry Agency of Russia (Bartalev et al., 2010; Efremov et al., 2011);
Web interface to work with data of industry-wide monitoring system of Federal Agency for Fisheries of Russia (Solodilov et al., 2011);
Integrated data catalog of the Scientific Center for Earth Operative Monitoring of Russian Space Agency. The interface provides the capability to analyze data from various satellite systems (Bourtsev et al., 2011a);
Joint access system of the European, Siberian and Far Eastern centers for receiving and processing satellite data
“Planeta” of Rosgidromet (Bourtsev et al., 2009; Bourtsev
et al., 2011b).
3. HSD TOOLS IMPLEMENTING TASKS
VEGA-Constellation is a long-term project of IKI RAS aiming at creating information systems or services based on a unified GEOSMIS technology. The different information systems within the VEGA-Constellation are described in detail in (Loupian et al., 2011; Bartalev et al., 2012; Uvarov et al., 2014; Savorskiy et al., 2014). Its interface is shown in Figure 4.
Figure 4. VEGA system user interface (Resurs-P HSA hyperstpectral image over Sochi region,
Eastern Black sea coast, 23.02.2015).
In order to work in information systems of VEGA family with HSD, it was necessary to solve the following tasks:
create a technology for obtaining HSD from various sources including remote ones;
create a technology for HSD backup which should ensure rapid search, selection and display of HSD from long-term and operational archives;
create basic interfaces that should provide capabilities to analyze HSD, including complex analysis of HSD and their products, together with the other information products stored in information systems of VEGA-Constellation family.
4. HIGH PERFORMANCE ALGORITHMS FOR HYPERSPECTRAL DATA MASSIVE MANAGEMENT
The data files from Hyperion USGS archive (Hyperion, 2014) were used as the main source of HSD during the work phase of design and implementation of basic HSD management and analytic software for usage in VEGA environment. For these purposes the IKI RAS team developed its original technology of data exchanges. This technology is described in detail in (Loupian et al., 2012a). It should be mentioned that using the same approach one can realize HSD uploading from another, different from USGS, data sources or providers.
The data were downloaded in the form of zip-compressed files containing 242 GeoTiff images, one per each spectral channel of Hyperion (in the band range from 355.59 to 2577.8 nm), and an ASCII text file with metadata in MTL format. Each file contains a 16-bit (int16) image in UTM projection. Each pixel represents radiation flux intesity.
After downloading, all data are automatically included into a 242-channel GeoTiff file. This procedure is completed by inclusion in the file of a 5-level (5-scale) pyramid. Scale pyramid is formed in order to provide scaling of data in order to significantly speed up access to data sets. This is particularly important for viewing many images in on-line remote mode. After testing, the best compression DEFLATE algorithm was chosen. It allows reducing the storage capacity by 10% compared to the original archive volume. Original spatial resolution, projection and values of the basic scale image remain unchanged.
So, we are able to display, analyze and process data in subsequent procedures without losing their original quality.
Along with the data file, the text annotation in a format suitable for mastering a specialized database is automatically generated. This specialized database is organized by basic software for management of satellite data archives, also developed by IKI RAS (Balashov et al., 2013). Depending on the scene angle, the special product identifiers specific to daytime and nighttime data are received. Such information is supplied to archives built using FDB (File Data Base) technology developed by ISR RAS (Efremov et al., 2004) as well. Hyperion data archive is organized in the same way as the majority of VEGA-Constellation archives, developed by IKI RAS. Namely, high spatial resolution data sets (Landsat, SPOT, Canopus-B, etc) are stored in the same way (Loupian et al., 2011; Bartalev et al., 2012; Uvarov et al., 2014). Curreently IKI RAS HSD archives contain more than 11,000 scenes (mostly of the territory of Northern Eurasia). Their total volume exceedes 3.5 TB.
5. TECHNOLOGY OF HSD ANALYTIC TOOLS
Specialized capabilities that operate within the Web mapping interfaces based on GEOSMIS technology were created (Kashnitskii et al., 2015) in order to work with HSD. These capabilities allow integration of functions that can work with EO data in a variety of information systems based on GEOSMIS technology. Created capabilities allow developing analytic tools to deal with data of individual spectral channels, build color synthesis of arbitrarily selected channels, conduct joint analysis of HSD and data from other satellite sensors, to deal with hyperspectral indices, etc. (see Section 6-8 for descriptions of these capabilities).
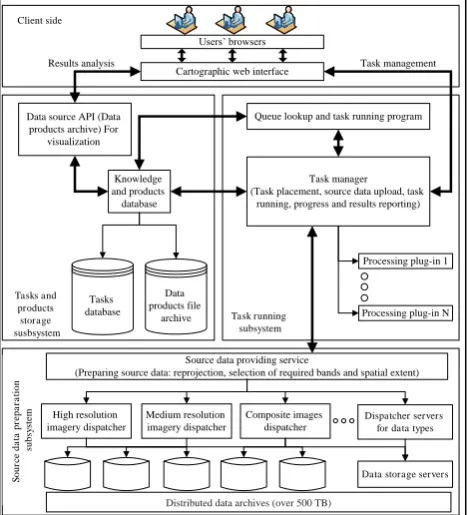
Figure 5. The principal scheme of GEOSMIS technology implementation.
The technology enabling HSD analysis in remote access mode should possess specialized SW components (aggregated in 3 subsystems as presented in Figure 5) in order to implement the following typical milestones for satellite data processing (Kashnitskii et al., 2015):
(Preparing source data: reprojection, selection of required bands and spatial extent)
Medium resolution
(Task placement, source data upload, task running, progress and results reporting)
selection of data sets to be processed;
management and configuration of processing procedures;
execution of processing operations (input data preparation, processing, preservation, and presentation of results);
analysis of the results.
According to the above requirements, GEOSMIS technology principal schematic was designed (Figure 5). The technology was implemented via the following main components (Kashnitskii et al., 2015):
Interface component (IC). IC provides remote control of processing procedures (data selection, parameter setting, execution control, etc.) and analysis of the results. IC is implemented in frame of Web mapping interfaces that are based on GEOSMIS technology. Standard SW means for data search and selection of information from satellite data archives are used (Tolpin et al., 2011). With the development of GEOSMIS technology, a number of universal interfaces, which can be used for various data management purposes, were built.
Task assignments and results storage capacities (TARSC). TARSC consists of assignments database (ADB), file archive with the results of data processing, SW access library, and standardized modules of data source interfaces for the display service, aka smiswms (Tolpin et al., 2011).
Task execution component (TEC). Functionally TEC consists of a task manager with a separate plugin for each type of data processing and programs to control job queue.
Data preparation component (DPC). DPC prepares a list of data sets from the archives in accordance with the user settings and transfer listed data to processing procedures.
Figure 6. Life cycle of processing request.
The IKI RAS team designs all components, which are created as part of GEOSMIS technology, as multipurpose ones for application in various information systems and remote sensing data centers. In accordance with the described principal schematic, a variety of data processing procedures is supported by common life cycle of processing request which is shown in Figure 6. Via Web mapping interface (running on IC) user can make preferable job and task settings. Since the performance of individual processing procedures can take a long time, the interface supports control of processing execution. User task assignment is recorded in ADB. After it, user is informed that the task is queued. Each processing stage with all its parameters is recorded in ADB. If user waits for the job completion, Web interface periodically interrogates ADB task manager TEC and informs user on the status of the job running.
6. VEGA DATA SELECTION POSSIBILITIES
Selection tools are of great importance for HSD handling due to the necessity to search and retrieve HSD sets associated with disparately located and rarely observed objects. Therefore, search and detection of target objects by standard means (Savorskiy et al., 2014), i.e. without any auxiliary information, is very difficult time-consuming procedure leading to inefficient use of system services. To solve this problem, many efforts were devoted to enhancing the selection capabilities of VEGA system with different kinds of auxiliary information available in VEGA databases. VEGA Web interfaces allow using MSD obtained in simultaneous observations, e.g. Landsat, SPOT, Canopus-B data from IKI archives, and active wild fire maps from IKI databases as auxiliary information when selecting HSD sets (Savorskiy et al., 2014).
Along with studying mobile flares from wild forest fires, VEGA services added a capability to detect and explore static, or immobile flares that often can be attributed to anthropogenic activities. The procedure for selecting HSD subsets that describes thermal anomalies of anthropogenic origin is based on VEGA information product called Permanent Flares. These objects are registered in special VEGA DB. They are retrieved from multispectral or hyperspectral observations as fire flames. However, unlike wild fires, e.g. forest or prairie ones, permanent flares do not change their location within few days.
VEGA services allow visualizing the Permanent Flares objects and use this capability for the identification and localization of permanent flares depicted as tiny blue circles in Figure 7. Figure
8 shows an image of one of such permanent flare sites (© Google
Planet Earth) registered as Permanent Flares object in VEGA DB. Analysis of the location indicates that this object is apparently a gas-flaring torch on the territory if a petroleum-producing enterprise.
Figure 7. VEGA visualizing and subselection services: "Permanent Flares" objects (Hyperion observations, 20.05.13,
West Siberia). Target gas flare is located in red circle.1
Figure 9 shows a hyperspectral image of the Permanent Flares object presented in Figure 8. Spectral features confirm that there is a possible gas flare. Note that image in Figure 9 is presented in default visualization mode, however, even in this case one can detect particular hyperspectral features associated with fires (see Figure 10.b). Substantial improvement in recognition of targeted objects can be achieved by application of hyperspectral index technique (see Section 8.2 and Figures 14).
Web interface
Queue lookup and running the task Tasks queue
Preparing source data
Processing
Source data providing service Task
started Tasks
database
Process started
Task completed
Figure 8. "Permanent Flares" object recognized as a gas flare in petroleum-producing enterprise.
May 2014, West Siberia. © Google Planet Earth.
Figure 9. Hyperspectral image of a Permanent Flares object (red circle) obtained from EO-1
(20.05.13, Western Siberia).
7. GENERAL-PURPOSE ANALYTIC TOOLS
In addition to tools implementing selection capabilities of VEGA system, IKI RAS team developed VEGA Web interfaces that incorporate a set of general-purpose analytic tools. They are designed for exploration of a variety of Earth objects in contrast to more specialized ones oriented for investigation of a definite type, or class, of natural objects (Section 8). These tools can also handle both HSD and MSD. Their functionalities were realized in the following remotely accessible user services (Savorskiy et al., 2014; Kashnitskii et al., 2015):
Web mapping (cartographic) interfaces for user access to HSD resources combined with means of MSD access;
space data visualization procedures which were enhanced to work both with HSD and MSD;
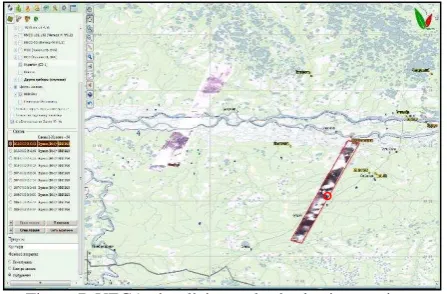
data classification Web tools which were upgraded to work with HSD (Figure 10),
HSD spectral analyzer.
VEGA capabilities were tested by applying the VEGA Web tools for classification of landscapes that contained vegetation cover and thermal anomalies. For example, results presented in Figure 10 show a determination of a Open Flame class on a typical Siberian forest landscape. One can easily select fire fronts (red ring in the center), both visually and by numeric analysis (as belonging to Open Flame class). One of the main conclusions of the test analysis is an independent confirmation of the necessity to develop dimensionality reduction algorithms in order to
increase reliability of class differentiation due to decreasing a required volume of teaching data samples for reaching necessary representative statisitics. This is one of the main objectives for introducition of hyperspectral indices (HSI) for using in HSD analysis (Section 8.2).
Figure 10. Determination of Open Flame class (5) in zone of forest fire. Hyperion observations (08.06.2011, Central part of
East Siberia).
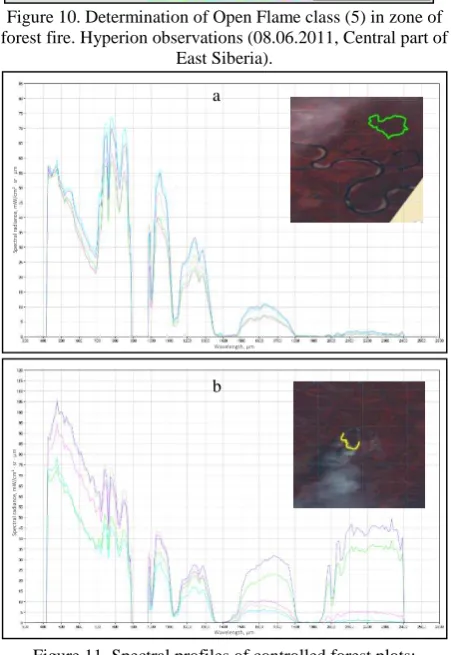
Figure 11. Spectral profiles of controlled forest plots: a) undamaged by forest fire, b) flame front. Hyperion data
(08.06.2011, 60046′ N 88059′ E)
Spectral features of HSD can be analyzed on-line by VEGA Spectral Analyzer (VSA) instrument. VSA is a Web interface tool that was developed by the IKI RAS team for retrieving the parameters of spectral profiles of interactively selected points of hyperspectral image attributed to explored Earth objects. It is one of the principal analytic tools designed as Web services for HSD applications. As an example, Figure 11 shows the results of examining a forest fire. This is the same forest fire as was used in classification presented in Figure 10. So, these services are complementary to each other and available via one common Web interface.
Wavelength, µ
Wavelength, µ
Sp
ec
tr
al
ra
di
a
ce
,
W/
c
² ·
sr
·
µ
Sp
ec
tr
al
ra
di
a
ce
,
W/
c
² ·
sr
·
µ
a
b
Analysis of HSD thermal anomalies associated with open flame on a forest territory demonstrated their principal spectral features. They allow determining both thermal anomaly location and type. One of such features is a presence of spectral intensity maximum near 2.2 μm that is comparable with spectral intensities near
1.1 μm. In absence of flame on a forest plot, the spectral
intensities near 2.2 μm is substantially lower than spectral intensities near 1.1 μm. This is illustrated in Figure 11, where one can see an increase of registered spectral intensities in spectral band over 2.2 μm in presence of open flame.
8. SPECIAL ANALYTIC TOOLS
In addition to general-purpose analytic tools, VEGA incorporates a set of special tools designed for investigation of particular classes of natural objects. Two of such tools are presented in Sections 8.1 and 8.2. They are spectral portraits system and hyperspectral index system (HSI) for investigation of vegetation canopy.
8.1 Spectral portrait system
The spectral portraits system accumulates knowledge about spectral properties of different surface types. A library of spectral portraits is being created to enable comparability of spectral images of individual plots of surface with reference standards to make decisions on their belonging to determined classes. The library is populated with reference spectral portraits, each produced by averaging a set of spectral profiles of the same definite surface type. It allows us to reduce the effect of uncertainties caused by spatial/temporal variability of surface parameters and provide representative statistics.
Spectral profiles obtained from HSD are distinguished by a high degree of details and appear in the shape of continuous curves. A large number of hyperspectral channels makes it difficult to use the entire data array for classification. Therefore, reference spectral portraits, which are of particular interest for research purposes, have to contain only the most informative parts of the spectrum for later use in classification tasks. Using reference spectral portraits implies the following user scenario:
1. Conduct visual detection of a group of characteristic points in a satellite hyperspectral image that can be assumed to belong to a particular surface type.
2. Start Web interface depicting spectral profiles related to the selected set of points of the hyperspectral image.
3. Conduct visual analysis of spectral profiles for the group of points in order to estimate the representativeness of the samples set and spectral separability of object types. 4. Assign the averaged profile of the group of characteristic
points to be standard spectral portrait of particular surface type, name the spectral portrait, and save it in “Spectral
portrait” DB.
5. In order to check class affiliation of any new surface, compare its spectral profile with previously defined standard spectral portraits.
Storage of spectral portraits is accomplished by MS MySQL DB. VEGA table structure allows to store unlimited number of portraits for every user if they have unique portrait names. Each portrait may include a series of spectral profiles that are based on various characteristics, such as spectral brightness or spectral reflectivity.
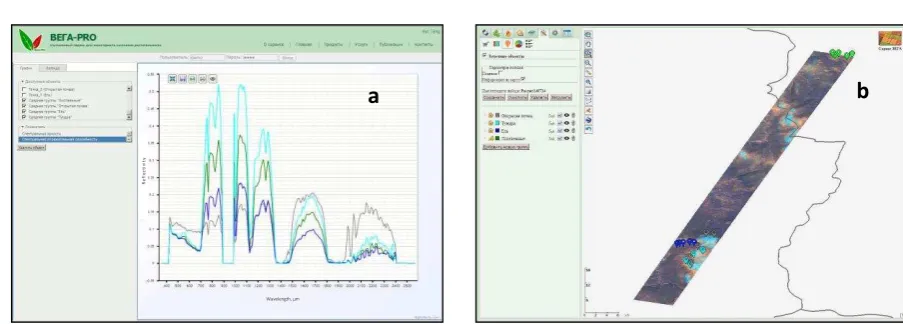
Implementation of the spectral portrait system is illustrated in Figure 12. It shows spectral portraits of some plant species obtained under the described technology (Figure 12 (a)). Figure 12 (b) presents the map of vegetation cover prepared using the spectral portrait data.
8.2 Hyperspectral index system
VEGA system also includes a toolkit called Image Algebra. It allows user to perform arithmetic, logic and various mathematical transformations on any data, including hyperspectral data. The values in the individual channels of satellite images can be converted by a formula given by user directly in the interface. The result is bitmaps created from existing raster layers using arithmetic and logical expressions involving integer and floating point numbers, normalization procedures, and mathematical functions.
With Image Algebra, VEGA cartographic Web interface is capable to calculate different spectral indices "on the fly" and to test experimentally new thematic products. For example, the user can build difference indices using absorption and emission spectral bands for the study of mineralogical and chemical composition of the underlying surface. It should be noted that such operations can be carried out on all data sets available in the archives of VEGA family systems. It means that users can combine not only HSD channels of one scene, but also any channels of multi-temporal scenes of any instrument stored in VEGA archives.
Figure 12. Spectral portraits (a) of vegetation types of deciduous forest (green), spruce (dark blue), tundra (blue), bare soil (dark
grey) and their location on terrain (b).
b
a
Wavelength, µm
R
e
fl
e
c
ti
vit
y
Figure 13. TCARI map of irrigated agriculture area (Hyperion, 05.08.2014, Saratov region).
In addition to to create, store and edit new hyperspectral indices, the VEGA system provides users with preset ihyperspectral indices for such target areas as vegetated (forest and agriculture) plots, open soil surfaces, forest fires locations, areas of thermal anomalies. For each of them VEGA offers a specific set of indices for estimating parameters of the study objects with great accuracy and reliability. Experiments on the use of different indices for Hyperion data showed good results in the study of characteristics of these objects.
A general view of VEGA Web interface for work with hyperspectral indices is shown in Figure 13. It demonstrates a Transformed Chlorophyll Absorption Ratio Index (TCARI) (Haboudane et al., 2002) map of an agricultural area near the southern part of the Volga River. One can see a significant Figure 5. The principal scheme of GEOSMIS technology
implementation.and non-irrigated ones in late summer (dry season for this area).
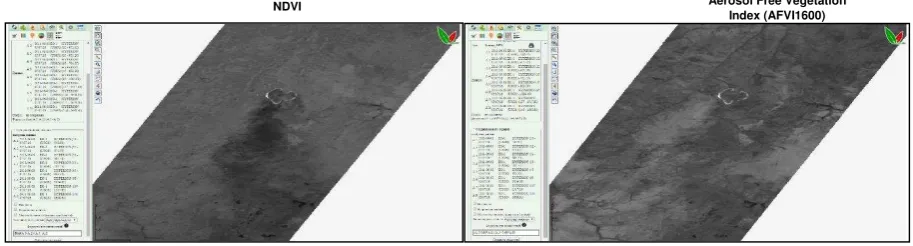
Effectiveness of preset hyperspectral index applications is
illustrated by VEGA presentation of an Aerosol Free Vegetation
Index (AFVI1600) (Karneili_et_al, 2001) map of the vicinity of a gas flare (Figure 16). Notice drastic enhancement in
visualization capabilities of the AFVI1600 map (Figure 14.b) in
the presence of smoke in comparison to NDVI (Rouse J.W. et al.,
1974) (Figure 14.a) or RGB composites (Figure 9). AFVI1600 mapping is also a very productive way to get information on forest fire environment required to produce reliable forecasts of fire dynamics, since, unlike NDVI map, this map provides
information on wood stock under smoke layer (Figure 15).
CONCLUSIONS
The paper presents a variety of remotely accessed services that enable both search and retrieval procedures on HSD sets and their processing and analysis. These services were developed by the IKI RAS team within VEGA-Constellation information systems on the basis of GEOSMIS technological solutions. In particular, the developed tools enable spectral analysis of HSD sets in remote access mode. They also enable flexible applications of hyperpsectral indices for exploration of natural resources. Efficiency of the proposed approach is confirmed and illustrated by Hyperion (EOS-1) data analysis results. The tools proved to be especially useful for HSD analysis in presence of clouds, aerosols or smoke.
ACKNOWLEDGEMENTS
The work is supported by RFBR grant №13-07-00513,
13-07-12116 ofi_m, 16-07-00956. Landsat and Hyperion data were received from the U.S. Geological Survey.
Figure 14. NDVI (a) and AFVI1600 (b) images over gas flare site (red circle). Hyperion observations (20.05.13, West Siberia)
Figure 15. Effectiveness of VEGA system Web interface for forest fire detection based on HSD usage (Hyperion, 05.06.2011).
Aerosol Free Vegetation Index (AFVI1600) NDVI
REFERENCES
Arkhipov, S.A., Baklanov, A.I., Linko, V.M., 2014. Hyperspecral shooting apparatus for the Resurs-P spacecraft. Izvestiya, Atmospheric and Oceanic Physics, 50(9), pp.978-988.
Balashov I.V., Halikova O.A., Burtsev M.A., Loupian E.A., Matveyev A.V., 2013. [Organization of automatic data acquisition from satellite data archiving centers]. Sovremennye problemy distantsionnogo zondirovaniya Zemli iz kosmosa, 10(3), pp. 9-20.
Bartalev S.A., Ershov D.V., Loupian E.A., Tolpin V.A., 2012. [Possibilities of satellite service VEGA using for different tasks of land ecosystems monitoring]. Sovremennye problemy distantsionnogo zondirovaniya Zemli iz kosmosa, 9(1) pp. 49-56.
Bartalev S.A., Ershov D.V., Korovin G.N., Kotelnikov R.V., Loupian E.A., Tshetinskii V.E., 2010. [The main functionalities and structure of the Forest Fire Satellite Monitoring Information System of Russian Federal Forestry Agency (SMIS- Rosleskhoz)]. Sovremennye problemy distantsionnogo zondirovaniya Zemli iz kosmosa, 7(2), pp. 97-105.
Bourtsev M.A., Voronin A.A., Eremeev V.V., Zlobin V.K., Kuznetsov A.E., Loupian E.A., Milekhin O.E., Soloviev V.I., 2009. [Complex of operational processing of meteorological satellite information]. Issledovaniie Zemli iz kosmosa, 1, pp. 16-23.
Bourtsev M.A, Efremov V.Yu., Balashov I.V., Mazurov A.A., Proshin A.A., Loupian E.A., Milekhin O.E., 2011a. [Data handling system for the European, Siberian and Far Eastern centers of Roshydromet]. Sovremennye problemy distantsionnogo zondirovaniya Zemli iz kosmosa, 8(3), pp. 113-119.
Bourtsev M.A., Emelyanov K.S., Efremov V.Yu., Loupian E.A., Mazurov A.A., Pakhomov L.A., Proshin A.A., Savorsky V.P., Artamonova E.V., 2011b. [On the Possibility of Effective Interaction between Satellite Data Receiving/Processing Centers and Remote Monitoring Systems]. Sovremennye problemy distantsionnogo zondirovaniya Zemli iz kosmosa, 8(4), pp. 48-53.
Efremov V.Yu., Loupian E.A., Mazurov A.A., Proshin A.A., Flitman E.V., 2004. [Technology of construction of automated storage systems for satellite data]. Sovremennye problemy distantsionnogo zondirovaniya Zemli iz kosmosa, 1(1), pp. 437-443.
Efremov V.Yu., Balashov I.V., Kotelnikov R.V., Loupian E.A., Mazurov A.A., Proshin A.A., Tolpin V.A., Uvarov I.A., Flitman E.V., 2011. [Integrated mapping interface for operations with ISDM-Rosleskhoz data]. Sovremennye problemy distantsionnogo zondirovaniya Zemli iz kosmosa, 8(3). pp. 129-139.
EO-1 User Guide, 2003. V.2.3, University of Cincinatty. http://eo1.usgs.gov & http://eo1.gsfc.nasa.gov (12 Dec. 2015)
Haboudane D., Miller J.R., Tremblay N., Zarco-Tejada P.J., Dextraze L., 2002. Integrated narrow-band vegetation indices for prediction of crop chlorophyll content for application to precision agriculture. Remote Sensing of Environment, vol. 81, pp. 416–426.
HICO, 2014 http://www.nasa.gov/mission_pages/station/ research/experiments/689.html (12 Dec. 2015)
Hyperion, 2014. http://earthexplorer.usgs.gov (12 Dec. 2015)
Karnieli A., Kaufman Y.J., Remer L., Wald A., 2001. AFRI — aerosol free vegetation index. Remote Sens. Environ., 77, pp. 10– 21.
Kashnitskii A.V., Balashov I.V., Loupian E.A., Tolpin V.A., Uvarov I.A., 2015. [Development of the software tools for satellite data remote processing in contemporary information systems]. Sovremennye problemy distantsionnogo zondirovaniya Zemli iz kosmosa, 12(1), pp. 156-170.
Loupian E.A., Savin I.Yu., Bartalev S.A., Tolpin V.A., Balashev I.V., Plotnikov D.E., 2011. [Sattelite service for vegetation monitoring VEGA]. Sovremennye problemy distantsionnogo zondirovaniya Zemli iz kosmosa, 8(1), pp. 190-198.
Loupian E.A., Balashov I.V., Burtsev M.A., Efremov V.Yu., Mazurov A.A., Maltsev D.V., Matveyev A.V., Proshin A.A., Tolpin V.A., Halikova O.A., Krasheninnikova Yu.S., 2012a. [Opportunities to work with long-term archive of Landsat satellite data on the territory of Russia and neighbouring countries]. Sovremennye problemy distantsionnogo zondirovaniya Zemli iz kosmosa, 9(3), pp. 307-315.
Loupian E.A., Savorskiy V.P., Sholin Yu.I., Aleksanin A.I., Nazirov R.R., Nedoluzhko I.V., Panova O.Yu., 2012b. [Up-to-date approaches and technology arrangement of Earth observation data applications aimed to solve scientific tasks]. Sovremennye problemy distantsionnogo zondirovaniya Zemli iz kosmosa, 9(5), pp. 21-44.
Rouse J.W., Haas R.H., Scheel J.A., Deering D.W., 1974. Monitoring Vegetation Systems in the Great Plains with ERTS. Proceedings, 3rd Earth Resource Technology Satellite (ERTS) Symposium, 1, pp. 48-62.
Savorskiy V., Loupian E., Kaevitser V., Smirnov V., Ermakov D., Balashov I., Bourtsev M., Efremov V., Proshin A., Tolpin V., Uvarov I., Flitman E. V., 2012. Distributed infrastructure enabling effective integration of Earth observation information resources for collective solution of archiving, searching, processing and EO data analyzing tasks. The International Archives of the Photogrammetry, Remote Sensing and Spatial Information Sciences, vol. XXXIX, Part B4, pp. 237-242.
Savorskiy V., Loupian E., Balashov I., Burtsev M., Proshin A., Tolpin V., Ermakov D., Chernushich A., Panova O., Kuznetsov O., Vasilyev V., 2014. Basic technologies of Web services framework for research, discovery, and processing the disparate massive earth observation data from heterogeneous sources. The International Archives of the Photogrammetry, Remote Sensing and Spatial Information Sciences, Vol. XL, Part 4, pp. 223-228.
Solodilov A.V., Pirkov V.N., 2011. [Complex satellite monitoring of fishery ships]. Aerokosmicheskiy kur’yer, 2(74), pp. 68-70.
Tolpin V., Balashov I.V., Efremov V.Yu., Loupian E.A., Proshin A.A., Uvarov I.A., Flitman E.V., 2011. [The GEOSMIS stystem: developing interfaces to operate data in modern remote monitoring system]. Sovremennye problemy distantsionnogo zondirovaniya Zemli iz kosmosa, 8(3), pp. 93-108.
Uvarov I.A., Matveyev A.M., Burtsev M.A., Loupian E.A., Mazurov A.A., Proshin A.A., Savorskiy V.P., Sudneva O.A., 2014. [Arrangement of distributed work with satellite hyperspectral data for solution of scientific and applied problems]. Sovremennye problemy distantsionnogo zondirovaniya Zemli iz kosmosa, 11(1), pp. 322-333.
VEGA, 2015. http://sozvezdie-vega.ru/eng/ (12 Dec. 2015).