DETECTION AND COUNTING OF ORCHARD TREES FROM VHR IMAGES USING A
GEOMETRICAL-OPTICAL MODEL AND MARKED TEMPLATE MATCHING
Philippe Maillarda∗, Mar´ılia F. Gomesa,b
a
UFMG, Departamento de Geografia, Av. Antˆonio Carlos, 6627, Belo Horizonte - MG, Brazil - [email protected] bINCRA, Av. Afonso Pena, 3500, Belo Horizonte - MG, Brazil - [email protected]
Commission VII, WG VII/4-5
KEY WORDS:Orchards, VHR Images, Template Matching, Tree Crown Detection, Geometrical-Optical Model, Tree Counting
ABSTRACT:
This article presents an original algorithm created to detect and count trees in orchards using very high resolution images. The algorithm is based on an adaptation of the “template matching” image processing approach, in which the template is based on a “geometrical-optical” model created from a series of parameters, such as illumination angles, maximum and ambient radiance, and tree size specifi-cations. The algorithm is tested on four images from different regions of the world and different crop types. These images all have<1 meter spatial resolution and were downloaded from the GoogleEarth application. Results show that the algorithm is very efficient at detecting and counting trees as long as their spectral and spatial characteristics are relatively constant. For walnut, mango and orange trees, the overall accuracy was clearly above 90%. However, the overall success rate for apple trees fell under 75%. It appears that the openness of the apple tree crown is most probably responsible for this poorer result. The algorithm is fully explained with a step-by-step description. At this stage, the algorithm still requires quite a bit of user interaction. The automatic determination of most of the required parameters is under development.
1. INTRODUCTION
It is estimated that orchard fruit production represents approxi-mately 3%–4% of the total arable land (FAO, 2012). The EU CAP regulations (EC 73/2009) provide support for permanent crops like hazelnuts, almonds, walnuts and fruits in general (San-toro et al., 2013; Aksoy et al., 2012; Tasdemir, 2010) but eligible orchards need to have a certain size and tree density, depending on the type of crop. The task of estimating fruit production gen-erally implies counting trees, a time consuming task that could benefit from the use of the very high resolution (VHR) satellite images now available, but also the near-global high resolution image coverage such as is provided by Google-Earth and other internet-based image services. An orchards is a plantation of trees of the same species and often the same age. Consequently, trees in orchards usually have similar sizes and shapes and are regu-larly spaced. Image processing can be adapted to such a task, providing efficient algorithms that can take advantage of the par-ticular aspect of the orchards and the availability of VHR images.
Very high spatial resolution remote sensing images represent a cost effective and reliable way of obtaining information about trees. It may be the only practical manner to ensure a sustain-able stewardship of forests with the necessary data about trees in a synoptic and repetitive form for large areas and over long periods of time (Shao and Reynolds, 2006). As remote sensing goes, it is generally the tree crown that stands as the basis for the data required for the inventory, for it allows determining not only the tree’s size but also its position, the density of leaf coverage, and in some cases the species. It can also be used to estimate ecological parameters such as the density of the population, the health condition of the trees, their volume, their biomass, and carbon sequestration rates (Ke and Quackenbush, 2011; Perrin, 2006; Erickson, 2004).
The analysis of individual trees based on remote sensing images is a complex problem given the variability of the size, shape, and
∗Corresponding author
spectral response of the crown. What is detected as a single object may in fact be, in some cases, a separate group of branches, or in other cases a group of trees(Pu and Landry, 2012). Other sources of error are caused by the proximity of neighbouring trees, trees’ being located under other trees, trees in the shade, or trees that have a low spectral contrast with the background (Wulder et al., 2000). Still, the information provided this way is crucial to a series of applications, such as the inventory and management of forested areas as well as of parks and urban forests. It can also be used for counting and monitoring trees in orchards or under power lines to prevent damage and accidents. In the case of or-chards, VHR remote sensing can also contribute to early stress detection, yield prediction, and phenology monitoring (Stuckens et al., 2010).
Larsen et al. (2011) have made a review of six algorithms (ar-guably the most well recognized) for the detection of individual trees and concluded that no single algorithm is best for all situa-tions of tree density and characteristics. Furthermore they found template matching (TM) to produce the best results for individ-ual isolated trees, which is often (but not always) the situation in orchards where trees are generally well separated from each other.
Recently, Gomes and Maillard (2014) used a marked point-process (MPP) and TM with a 3D geometrical-optical model (GOM) to locate isolated trees of varying size and shape in urban environ-ments. Because trees in orchards are often individually distin-guishable and have a similar shape and size, they are perfect can-didates for TM with a 3D GOM. In this article, VHR Google Earth images were used for identifying orchard trees. Orchards being collections of individual trees often arranged regularly, a combined TM-GOM algorithm can easily be adapted for the task of tree counting in a timely fashion.
structur-ing element which is compared to the image or texture analysis or a combination of both. The use of some structuring element (usually a circular shape) is closely related to template matching (TM).
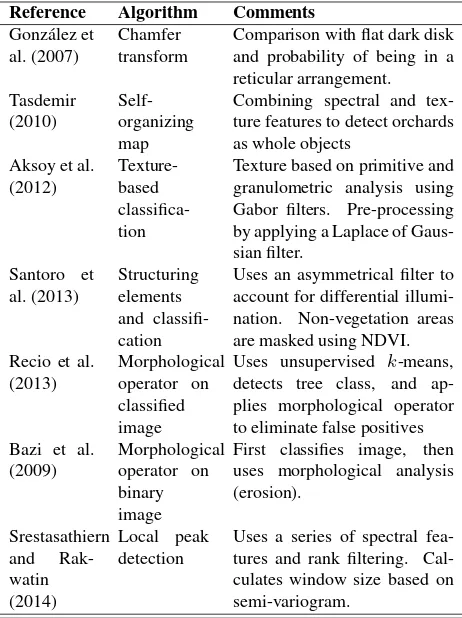
In this selection of approaches, three (Bazi et al., 2009; Recio et al., 2013; Santoro et al., 2013) used some morphological ap-proach based on some simple shape to detect the trees. A fourth (Gonz´alez et al., 2007) used a Chamfer transform, which is also shape-based. One approach employed region growing on spectral features (Srestasathiern and Rakwatin, 2014) and two (Tasdemir, 2010; Aksoy et al., 2012) aimed at detecting whole orchard plots rather than the trees. These latter two approaches offer an inter-esting complement to the tree detection problem, in which the detection of the orchards prior to the tree detection phase would reduce significantly the search areas and eliminate false positives found outside the orchards.
It has become clear that the use of some kind of morphological el-ement represents a key elel-ement in detecting orchard trees in VHR images. It is also the approach we have favoured here but we opted to introduce a three-dimensional structuring element based on a GOM to make the approach more consistent with the specific characteristics of the image at hand.
Reference Algorithm Comments
Gonz´alez et al. (2007)
Chamfer transform
Comparison with flat dark disk and probability of being in a reticular arrangement. ture features to detect orchards as whole objects
Texture based on primitive and granulometric analysis using Gabor filters. Pre-processing by applying a Laplace of Gaus-sian filter.
Uses an asymmetrical filter to account for differential illumi-detects tree class, and ap-plies morphological operator
Uses a series of spectral fea-tures and rank filtering. Cal-culates window size based on semi-variogram.
Table 1: List of articles dedicated to orchard tree detection us-ing VHR images (≤1 m) along with their respective generic ap-proach.
The objective of this research is to introduce an adaptation of TM with a 3D GOM to detect and count trees in orchards in VHR images such as provided by Google Earth. The TM is adapted to this particular situation by placing marks to “reserve” the space for each tree found. The approach also incorporates a module to determine a near-best model (GOM radius, and illumination pa-rameters) from an image sample. Lastly, the algorithm can han-dle both monochromatic and multi-spectral images. Results are
presented for four sample scenes (two monochromatic and two multi-spectral) from different countries and crop types.
2. METHOD
By using a GOM, the effects of varying illumination (sun eleva-tion and azimuth) become an advantage rather than an obstacle, especially when the background is homogeneous. In terms of data, VHR image data, including a large proportion of Google Earth images, have sufficient resolution for identifying orchard trees. In this case however, the illumination parameters are not readily available and must be determined. Although we have im-plemented an automated routine to determine most of these pa-rameters (sun elevation, sun azimuth, crown size), it is still in development to make it perform better and the user’s visual es-timation is usually quicker and often better than our automated estimation.
The proposed approach is to introduce an adaptation of the al-gorithm mentioned above (TM and MPP) to detect and count trees in orchards of different types. Aiming at a regional appli-cation, Google Earth images were used to demonstrate a proof-of-concept with images of lesser spectral and radiometric quality. The algorithm uses measure of the similarity between the GOM and the image to estimate the probability of being the centre of a tree and then places a mark for that tree in a non-overlapping position (unless some overlapping is allowed). The overlapping parameter can also be used to force a minimum spacing between the tree crowns; in this case a negative value is used. The algo-rithm also incorporates a module to determine the illumination parameters (sun azimuth and elevation, maximum and ambient radiance) from a sample.
2.1 Geometrical-Optical 3D Model
In creating a valid 3D geometrical-optical model we have cho-sen a simplified version in which the crown is reprecho-sented by a dome of varying skewness, a Lambertian reflectance model with ambient light and a projected shadow on the ground. Equations 1 and 2 give the formulation of our model, in which each pixel is treated as a singular surface.
L=Lmax×
Here,Lis the radiance of the pixel,Lmaxis the maximum radi-ance of the tree,cos(i)is the angle between the incidence angle of the sun and the normal of the tree surface,θsis the solar ele-vation angle,θnis the slope of the object surface,φsis the solar azimuth,φnis the aspect of the object surface andamb repre-sents the ambient diffuse lighting.
The geometrical-optical model is adjusted according to the spe-cific illumination parameters of the image and the size of the trees present on the scene. Figure 1 shows two examples of tree models with similar reflectances but different solar elevations.
(a) (b)
Figure 1: Illustration of the geometrical-optical model of tree crown as seen in two different solar elevation angles: (a)20◦and (b)45◦.
2.2 Algorithm
The algorithm is based on three principles: Firstly, it assumes that the trees have a dome-like shape approximated with a GOM and the right illumination parameters; Secondly, that there is little or no overlap between the trees; Thirdly, that the pixel with the highest similarity represents the most likely central position of the tree.
The algorithm is not based on a “marked point process” since it is not completely random. It does however take advantage of the principle of a mark to ensure that the trees found follow a rank based on the similarity between the image and the GOM. The marked process makes sure that the location where a tree has been detected cannot be occupied by another tree unless some overlap has been previously allowed. The GOM is a simple dome model in which the height is estimated to be 1.5 times the diame-ter of the crown. To simplify the problem, we have employed the same diameter for all trees in the orchard (this can eventually be modified to incorporate a range of diameters). The algorithm re-sponsible for the detection of trees can be best explained through a step-by-step description.
Step 1. Get user parameters: percentage of overlap allowed, min-imum similarity value, tree diameter, and coordinate of sample tree. These parameters cannot yet be estimated automatically and are entered by the user. The illumina-tion parameters can opillumina-tionally be entered by the user; if not, they will be estimated by the program using the tree sample.
Step 2. If the sun elevation and azimuth are not provided by the user, these parameters are automatically estimated by the program using the coordinates of at least one tree sample from the image. The program then computes the similar-ity between the sample and all possibilities of illumina-tion parameters in steps of 10 degrees in azimuth and 5 degrees in sun elevation.
Step 3. Calculate a similarity value (SV) for each pixel. The sim-ilarity is a combination of the cross-correlation and the normalized absolute difference between the GOM and the image at each pixel location and is given by Eq. 3.
Sm=γ−αND (3)
whereγ is the cross-correlation,NDis the normalized absolute difference, andα is a constant weight factor (usually between0.25and0.5depending on radiometric quality of the image). The cross-correlation and absolute difference are calculated as follows (Eq. 4 and 5).
γ(x, y) = age that corresponds to a circle of the same radius, so that two matrices of same dimensions are always compared. Theω¯andf¯are their respective means. The values ofγ
range between−1and1. The same logic is used in Eq. 5, which computes a normalized difference value between the same two matrices.
Step 4. If the image is a multispectral image, repeat step 3 for all bands and make the similarity cumulative (the final value will then be divided by the number of channels/bands).
Step 5. Sort the pixels by decreasing similarity and store the co-ordinates. If the value is lower than the minimum al-lowed, the pixel is not stored.
Step 6. Place a temporary tree mark (circle) at the next pixel lo-cation with the highest similarity value.
Step 7. Verify whether the space is already occupied by a tree. If some overlap is allowed, make sure that the number of non-zero pixels is smaller than the percentage of overlap allowed. An output image is created to receive a perma-nent mark of the GOM shape with the associated simi-larity value.
Step 8. Validate the results. The validation is performed by com-paring the number of trees found and their locations. The comparison is made by tree and not by pixel. Alterna-tively, it can be done by estimating the overall number of trees using the density of a representative sample and comparing this with the number of trees found.
By ordering the image pixels by their SV and progressively oc-cupying the space with tree marks, the tree detection criterion au-tomatically decreases with time until it reaches a minimum spec-ified by the user.
2.3 Test and Validation
enhanced for sharpness. The first two were used in monochro-matic mode while the last two were kept in RGB mode. To val-idate the results, we asked three geography students to manually interpret and mark the trees belonging to the orchards for all test images and we have evaluated the results in the following way:
• the total number of trees (N) was determined by the inter-preters;
• matching trees were computed as true positives (TP) and are defined by the number of trees found by the algorithm;
• unmatched trees (present on the image but absent from the results) were marked as false negatives (FN);
• trees marked by the algorithm but not by the interpreters were marked as false positives (FP);
• the final accuracy was computed asNT P+F N ×100.
The results show the proportion of true tree crowns found relative to the total number of tree crowns that should have been found plus the crowns that were found by the algorithm but are not trees. By further adding the wrongly found trees, the index shows a fairer value of success.
The interpreters were told not to mark trees that were much smaller or larger than the average tree in the orchards. This was initially necessary because we used a single crown size to compute simi-larity values in our tests. We are currently correcting this short-coming by applying successive passes with different crown sizes, starting with larger crown sizes and ending with smaller ones. This order is logical since larger trees occupy larger areas and can be more difficult to find, whereas small tree GOMs can pro-duce high similarity values even on large trees but not the inverse. Also, valid trees that were found by the algorithm but did not per-tain to an orchard were not computed as false positives. As a fur-ther improvement, restricting the search to within the boundaries of the orchards would increase the accuracy and would enable the similarity parameter to be relaxed.
3. RESULTS AND DISCUSSION
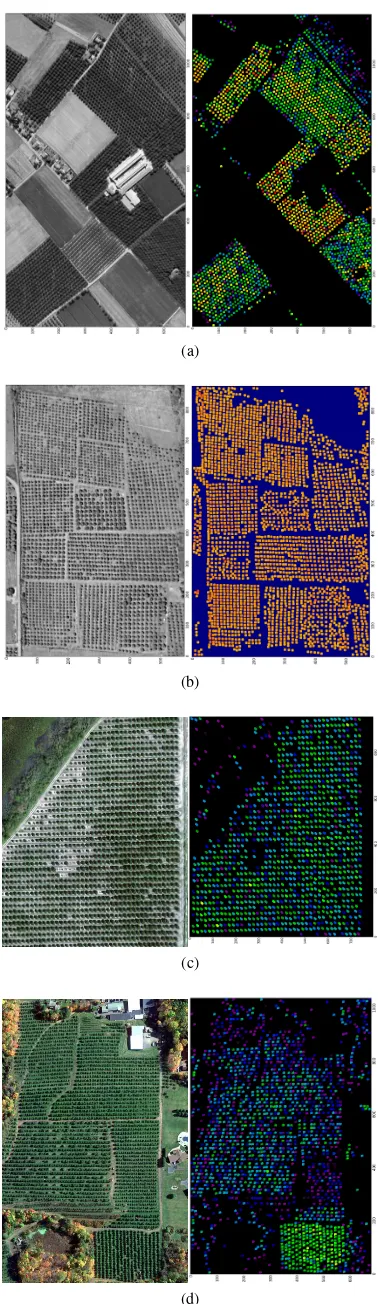
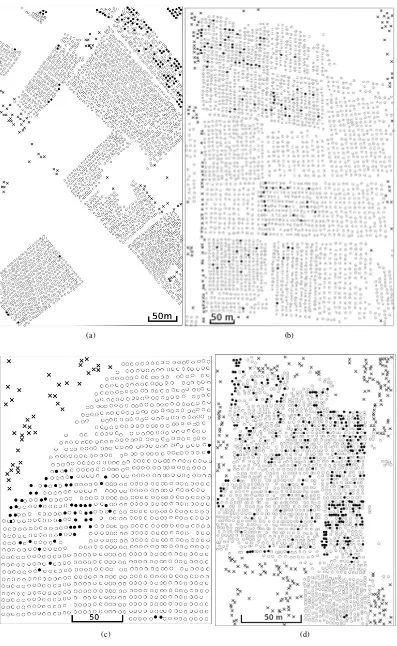
Table 2 shows an overview of the results for the four test images while the graphical results are shown in Figures 2 and 3. Fig-ure 2 shows the original images and a colour-coded result where the warmer tones indicate stronger similarity values and Figure 3 represents a mapping of the results showing the true positives (◦), the false negatives or missing trees (•), and the false positives (×). Figure 4 shows the histogram of similarity values for the four images as well as the sample tree used to compute the maxi-mum relative radiance and the ambient light (the relative radiance in the shadows).
TheGrenobletest image (Figures 2a and 3a) is characterized by densely arranged walnut trees which have a large round crown (Figure 5a) so that the model was well correlated with the trees in the image and produced an overall accuracy of≈90%. But the fact that the trees are close to one another still produced 103 “misses”. This forced the relaxation of the similarity threshold and caused a few false positives (69), all of which are outside the orchards. Interestingly, the histogram of SVs (Figure 4a) is clearly bimodal with the right peak roughly corresponding to the walnut trees.
In the case ofJuazeiro(Figures 2b and 3b), the area is popu-lated by mango trees that, like the walnut trees, have large round
(a)
(b)
(c)
(d)
Test Image Type N TP FP FN Overall User
M/C accuracy accuracy
Grenoble M 2435 2289 69 103 90.19% 94.00% Juazeiro M 2534 2441 114 93 92.92% 96.33% Citrus Grove C 1185 1131 39 54 91.28% 95.44% Southington C 1873 1576 224 297 72.63% 84.14%
Table 2: Results of the tree counting algorithm for the four test images (France, Brazil, two in the USA). Legend: Type M=monochromatic, Type C=color N=number of trees, TP=true positive, FP= false positive, FN=false negative. User accuracy is the success rate attained when considering only the trees within the orchard’s limits (no comission error).
crowns (Figure 5b) that generated a success rate of≈93%. The algorithm produced a fair amount of both false positives (114) and false negatives (93) mainly because of the variation of tree crown size and the particular situation of the dirt road on the left of the image that created a pattern of light and shade similar to the trees (approximately one-third of the false positives came from that road). Unlike the Grenoble case, the histogram of SVs (Fig-ure 4b) has a unique peak showing that there is little difference between the trees and their surroundings. Again, all false posi-tives are outside the orchards.
TheCitrus Grovecolour test image generated somewhat similar results with≈91% overall success (Figures 2c and 3c). The fact that colour was used improved the results by about 6% in relation to using a monochromatic channel (not shown here). Although most trees in the orchards are well defined, there are quite a few clearly smaller trees that were not detected. The SV histogram is clearly multi-modal with three dominant peaks and some sec-ondary ones. This is due to the effect of using the three colour channels since some pixels were correlated to the GOM in one channel but not in the other ones, and shows the contribution of colour to help separate trees that are similar to the GOM and the sample relative radiance values.
TheSouthingtontest image produced poorer results with an over-all success rate of only≈73% (Figures 2d and 3d). We attribute this to two main facts. Firstly, apple trees are known to be ill-shaped, with a sparser crown than the other three fruit trees (Fig-ure 5d). Secondly, the orchards in Fig(Fig-ure 3d are not very regular, with trees varying widely in size and spacing. The interpreters re-ported having the most difficulty with the Southington test image because of these variations. It can be observed in the two figures (Figures 2d and 3d) that the orchard located on the Southeast corner was well processed with only one false negative. This or-chard is also characterized by the warmest colour, meaning that high SV were obtained in it.
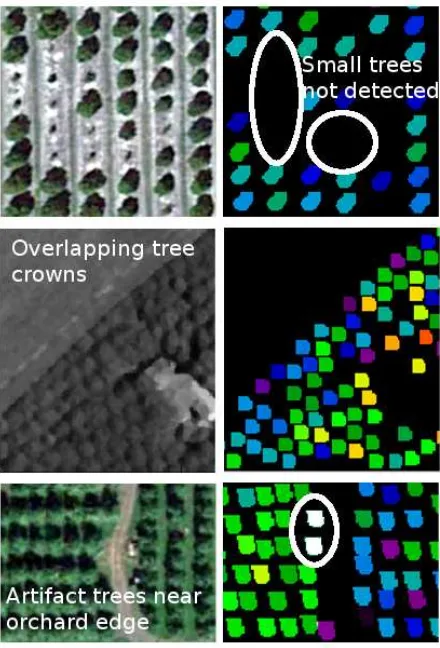
The colour-coded images based on SV (Figure 2, right column) give a good indication of the strengths and weaknesses of the algorithm. As shown in Table 2, the algorithm worked well in most situations. It did not perform well in cases where the trees were much smaller or much bigger than the average or when their shape was very different from the idealized dome we used as a GOM. Similarly, it did not produce high SV in cases where the tree crowns overlap each other, as in the Southeast orchard of the Grenoble image (Figure 2a). It also appears that the edges of the orchards generated more false negatives, probably because these edges are often in contact with other objects like trails, roads, houses or even trees of different species with a different size. The most common of these problems are illustrated in Figure 6. A significant improvement could be achieved by limiting the search to within the orchards’ boundaries, which would eliminate most
false positives, as shown in the rightmost column of Table 2 (user accuracy).
In its current stage of development, the algorithm requires eight parameters: sun elevation, sun azimuth, maximum radiance, am-bient radiance, crown radius, percent of projected shadow (GOM), minimum similarity value, and spacing/superposition allowed. The first six parameters can be estimated through a routine that is ac-tivated when the parameter is not supplied. For this to take place, the user needs to provide at least one coordinate of a typical tree crown in the image (if more than one coordinate is supplied, the routine analyses all trees and returns average values for the six parameters). At this stage we have found that a visual estimation of these parameters by the users is at least as good as the one sup-plied by the routine, and we are still working on improving the parameter estimation routine. In the case of real panchromatic or multi-spectral images, the first two parameters are included in the metadata of the image. Our next version of the algorithm will also include the possibility of running successive passes each with a different tree crown size, starting with the larger radius.
(a) Grenoble (b) Juazeiro
(c) Citrus Grove (d) Southington
Figure 4: Similarity value histograms for the four test images. The grey tone corner images represent the the scale geometrical-optical models and the sample on which it was based.
4. CONCLUSIONS
(a) (b)
(c) (d)
(a) Walnut (b) Mango
(c) Orange (d) Apple
Figure 5: The different types of fruit trees analysed with the tree-counting algorithm. Note how the apple tree crown is much more open than the other three types.
Figure 6: Some of the problem situations encountered by the tree counting algorithm.
by the user. The following points summarize the results obtained.
• Almost all trees found within the orchards’ limits are true positives.
• Without considering the false positives outside the orchards’ limits, the overall success increases to over 93% in three of the four test images (except Southington).
• Many false negatives created doubts in the interpreters, be-cause of their small size or their odd shape.
• The algorithm is quite efficient when the trees in the or-chards are well separated and have a uniform shape.
In its present state, the algorithm still relies on a threshold that is set by the user, but we think this could be replaced by lim-iting the search to actual orchards and providing a tree density value. Further refinements will test other measures of similarity, like the Spectral Information Divergence (SID) proposed by Du et al. (2004) and used by Stuckens et al. (2010) for citrus tree recognition. Work is also underway to incorporate the context and take advantage of the fact that orchard trees are never iso-lated. Lastly, we are looking into testing the approach proposed by Tasdemir (2010) that detects orchards as a single object be-fore detecting and counting the tree crowns within the orchards, which would lead to a more robust hierarchical approach.
ACKNOWLEDGEMENTS
This work was produced within the context of a project of tree crown detection of the authors, and did not receive any specific financing. The authors are grateful to Google for enabling the download of very high resolution colour images from the Google Earth application. Finally we would like to thank Barbara Hen-rique Oliveira, Iara Marques Vilela and Dayane Freitas for map-ping all the trees in the test images.
REFERENCES
Aksoy, S., Yalniz, I. Z. and Tasdemir, K., 2012. Automatic detec-tion and segmentadetec-tion of orchards using very high resoludetec-tion imagery.IEEE Transactions on Geoscience and Remote Sens-ing, 50(8), pp. 3117–3131.
Bazi, Y., Al-Sharari, H. and Melgani, F., 2009. An automatic method for counting olive trees in very high spatial remote sensing images. In: Proceedings of the 2009 IEEE Inter-national Geoscience and Remote Sensing Symposium, Vol. 2, IEEE, Cape Town, South Africa, pp. II.125–II.128.
Du, Y., Chang, C.-I., Ren, H., Chang, C.-C., Jensen, J. O. and DAmico, F. M., 2004. New hyperspectral discrimination mea-sure for spectral characterization.Optical Engineering, 43(8), pp. 1777–1786.
Erickson, M., 2004. Segmentation and Classification of Indi-vidual Tree Crowns in High Spatial Resolution Aerial Images. PhD thesis, Swedish University of Agricultural Sciences, Up-psala.
FAO, F., 2012. Statistical Yearbook 2013: World Food and Agri-culture. FAO (Food and Agriculture Organization of the United Nations), Rome.
Gonz´alez, J., Galindo, C., Arevalo, V. and Ambrosio, G., 2007. Applying image analysis and probabilistic techniques for counting olive trees in high-resolution satellite images. In:
Advanced Concepts for Intelligent Vision Systems, Springer, pp. 920–931.
Ke, Y. and Quackenbush, L. J., 2011. A review of methods for au-tomatic individual tree-crown detection and delineation from passive remote sensing.International Journal of Remote Sens-ing, 32, pp. 4725–4747.
Larsen, M., Eriksson, M., Descombes, X., Perrin, G., Brandt-berg, T. and Gougeon, F., 2011. Comparison of six individual tree crown detection algorithms evaluated under varying forest conditions. International Journal of Remote Sensing, 32(20), pp. 5827–5852.
Perrin, G., 2006. Etude du couvert forestier par processus ponctuels marqu´es. PhD thesis, Ecole Centrale Paris.
Pu, R. and Landry, S., 2012. A comparative analysis of high spa-tial resolution IKONOS and WorldView-2 imagery for map-ping urban tree species. Remote Sensing of Environment, 124, pp. 516–533.
Recio, J., Hermosilla, T., Ruiz, L. and J.Palomar, 2013. Auto-mated extraction of tree and plot-based parameters in citrus orchards from aerial images. Computers and Electronics in Agriculture90, pp. 24–34.
Santoro, F., Tarantino, E., Figorito, B., Gualano, S. and D’Onghia, A. M., 2013. A tree counting algorithm for preci-sion agriculture tasks. International Journal of Digital Earth, 6(1), pp. 94–102.
Shao, G. and Reynolds, K. M., 2006. Computer applications in sustainable forest management,. Vol. 11, Springer.
Srestasathiern, P. and Rakwatin, P., 2014. Oil palm tree detection with high resolution multi-spectral satellite imagery. Remote Sensing (MDPI), 6(10), pp. 9749–9774.
Stuckens, J., Somers, B., Albrigo, G. L., Dzikiti, S., Verstraeten, W. W., Swennen, R., Verreyne, S. and Coppin, P., 2010. Off-nadir viewing for reducing spectral mixture issues in citrus orchards. Photogrammetric Engineering & Remote Sensing, 76(11), pp. 1261–1274.
Tasdemir, K., 2010. Classification of hazelnut orchards by self-organizing maps. In:IAPR Workshop on Pattern Recognition in Remote Sensing, 2010, IEEE, pp. 1–4.