GEOSPATIAL CHARACTERIZATION OF BIODIVERSITY: NEED AND CHALLENGES
P. S. Roy
Indian Institute of Remote Sensing, ISRO, 4, Kalidas Road, Dehradun, India
Commission VI, WG VI/4
KEYWORDS: Biodiversity Characterization, landscape, remote sensing, Geographic Information System
ABSTRACT
Explaining the distribution of species and understanding their abundance and spatial distribution at multiple scales using remote sensing and ground based observation have been the central aspect of the meeting of COP10 for achieving CBD 2020 targets. In this respect the Biodiveristy Characterization at Landscape Level for India is a milestone in biodiversity study in this country. Satellite remote sensing has been used to derive the spatial extent and vegetation composition patterns. Sensitivity of different multi-scale landscape metrics, species composition, ecosystem uniqueness and diversity in distribution of biological diversity is assessed through customized landscape analysis software to generate the biological richness surface. The uniqueness of the study lies in the creation of baseline geo-spatial data on vegetation types using multi-temporal satellite remote sensing data (IRS LISS III), deriving biological richness based on spatial landscape analysis and inventory of location specific information about 7964 unique plant species recorded in 20,000 sample plots in India and their status with respect to endemic, threatened and economic/medicinal importance. The results generated will serve as a baseline database for various assessment of the biodiversity for addressing CBD 2020 targets.
1.0. INTRODUCTION
Biologically diverse ecosystems apart from providing the basic ecosystem services like climatic stabilization and carbon sinks is also a vital resource for technological development in agriculture, pharmaceuticals and other technological innovations. The loss of biological diversity reduces our ability to adapt to the change. This loss is compounded by the loss of knowledge of biodiversity especially among people with close relationship with the natural ecosystem. Recently there is a perceptible change in understanding the priorities of biodiversity conservation and management mainly through spatial delineation of the biodiversity rich and poor areas (Behera et al., 2005; Roy et al., 2005; Kempf, 1993). The meeting of COP 10 for achieving CBD 2020 targets involve direct in-situ monitoring along with satellite remote sensing of the various ecological attributes and protected area boundaries to identify the loss of species and habitats, influence of various pressures and Land use and land cover change in understanding the ecosystem structure and functioning for human benefit (GEOBON, 2011).
The COP 10 for the first time has attempted to assess the adequacy global observation system for monitoring biodiversity. They have set 20 targets organized under 5 strategic goals for the period 2011-2020. The goals and targets comprise both aspirations for achievement at the global level, and a flexible framework for the establishment of national or regional targets. The five strategic goals are (GEOBON, 2011). :
• Strategic Goal A: Address the underlying causes of biodi-versity loss by mainstreaming biodibiodi-versity across govern-ment and society
• Strategic Goal B: Reduce the direct pressures on biodiver-sity and promote sustainable use
• Strategic Goal C: To improve the status of biodiversity by safeguarding ecosystems, species and genetic diversity • Strategic Goal D: Enhance the benefits to all from
biodi-versity and ecosystem services
• Strategic Goal E: Enhance implementation through par-ticipatory planning, knowledge management and capacity building
Presently in all the biodiversity rich tropical and sub-tropical regions with special reference to India, spatially represented ecological database is almost non-existent. The gap in baseline data has also been highlighted in the report of the COP 10 meeting for achieving CBD 2020 targets. Absence of adequate and authentic spatially linked database on population structure, population dynamics, edaphic and limiting factors makes it difficult for characterization, monitoring and required conservation of the species. Recent improvements in Remote Sensing and GIS has enabled us to categorize and spatially map species congregation and stratify the vegetation types based on ecological gradients and environmental drivers.
With the increasing technology availability both in spatial and spectral sensors it is much more robust in identifying areas for conservation.
The satellite remote sensing based vegetation type assessment in the Indian tropical conditions is dependent on the spatial scale as well as the seasonal repetitivity of the satellite data. Finer spatial resolution in the satellite data enables the finer delineation of the various tones and textures of the major vegetation types in relation to the bio-geographic, topographic and geomorphologic conditions in the region. The forests of India especially the deciduous forest which constitute the majority of the forest cover in the country, shows distinct phenological characteristics and can be effectively used for their type classification.
1.1. Assessment of Biodiversity
Spatial organization of biodiversity on the earth co-evolves with the physical environment of the region, in general and the local biotic influences in particular. It is also understood that ecological systems do not exist as discrete units but represent a continuum on an environmental gradient consisting of different land cover patches in the form of landscapes. Landscapes represent a mosaic of interacting ecosystems in relatively large to very large areas consisting of patches of different land use and land covers. Patch dynamics in the landscapes, one of the key ecological processes, is best understood and explained by analyzing the size, shape and arrangement of the patches in time and space. These patches are repositories of past and present environmental events and conditions including societal interactions. The landscape processes have significant bearing on the diversity at landscape level and thus becomes an important characterizing parameter of a landscape.
Though, biodiversity is generally appreciated at the species level, it needs to be assessed and conserved at all levels of ecological organization and spatio-temporal scales viz.; ecosystems containing rich biodiversity, large numbers of threatened or endemic species that are important for migrating species, have social, economic, cultural or scientific significance, or support key processes. Collections of taxa might form an accurate representation of some biological distributions where well-designed and well-resourced surveys have been used to collect the data. Taxa collections may also be used with some reliability at coarse scales (for example, grid cells of 50 km or 250 km), but usually become less reliable at the scale of individual reserves. On the other hand, museum and herbarium data on the locations of taxa are biased, having been collected for a different purpose (systematic), and often in an opportunistic manner, from the places that collectors expected to find what they were looking for or that were conveniently accessible.
Various methods viz, empirical, statistical and computational are now available for modeling wider spatial distribution patterns from the point records that field samples represent, but their reliability is also at least partly a function of the degree of spatial bias. New systematic field surveys to fill gaps are the best solution but they can be expensive and time consuming. A limitation of the field based data lies in extending the insights from the data to regional or global scales. Methods to reduce
the amount of time spent collecting data are therefore of interest (Innes and Koch, 1998).
1.2. Biodiversity assessment at landscape level
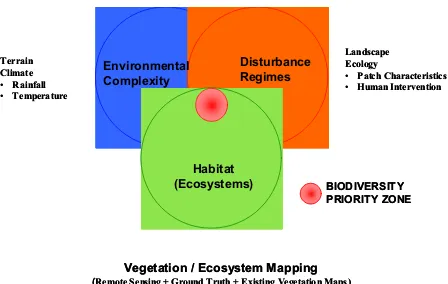
The present study hypothesizes to identify biodiversity conservation priority zones at landscape level interlaced with environmental complexity, disturbance index and habitats (Fig 1). Ecosystems are units in space composed of group of different organizations having varying influence in the system structurally as well as functionally, with exchange of energy and individuals within the system as well as with other neighboring ecosystems. Studying the ecosystem dynamics and biodiversity change at patch level seems an appealing ecological basis for understanding these processes (Wu and Loucks, 1996), but landscape ecology seeks to understand the ecological functions of larger areas and hypothesize the spatial arrangement of ecosystems, habitats or communities that have ecological implications in biological richness distribution (Romme and Knight, 1982; Turner, 1987, Gottlli, 2002).
Fig 1. Approach for biological richness assessment at landscape level (Roy and Tomar, 2000)
In landscape ecology, biodiversity is considered an integral part of the broader concept of landscape heterogeneity for management and conservation. Therefore, to characterize a landscape, diversity plays an important role; it acts as insurance for the system by increasing its ability to withstand change. In an effort to save biodiversity, several protected areas (Biosphere Reserves, National Parks and Wildlife Sanctuaries) have been earmarked. Even though these areas are protected, however they are not free from various degrees of human interference. Therefore, it is essential to study landscape elements for their status, interactions and importance.
Impact on biodiversity due to fragmentation of ecological units has been well documented at the landscape level-using patch number, size, shape, abundance and forest matrix characteristics (Forman and Godron, 1986; Skole and Tucker, 1993; Roy and Tomar, 2000). Ecosystem degradation and patch characteristics are associated with a degree of fragmentation (Mertens and Lambin, 1997 and Roy et al., 1997). Fragmentation apart from creating niches for the invasive species also isolates the endemic geenpools leading to loss of the genetic diversity and in long run loss of species.
Environmental (Remote Sensing + Ground Truth + Existing Vegetation Maps)
Landscape (Remote Sensing + Ground Truth + Existing Vegetation Maps)
Landscape Ecology
• Patch Characteristics
Disturbance is a discrete event along the passage of time that modifies landscape, ecosystems, community and population structure (White and Pickett, 1985). The disturbance leads to processes like fragmentation, migration, local and regional extinction. At landscape level, disturbance is related to patch structure and spatial arrangement and determines the fate of patches, their size and duration. Severe disturbance generally has depressing effect on biodiversity, but intermediate disturbance has been reported to enhance diversity in a system (Pickett and White, 1985). But disturbance of any intensity will always have a deleterious effect on the biological diversity of a region. Human activity has widespread impact on biodiversity, affecting ecological entities from species to whole communities and ecosystems, though heterogeneity in the landscape can be due to moderate disturbance. The disturbance regimes can be measured by using different indices i.e., degree of fragmentation, fractal dimension, contagion, juxtaposition, evenness and patchiness (Li and Reynolds, 1994).
Identifying regions having high biological richness or biologically rich areas under threat has an immense bearing on the prioritization and also helps in inventorization of endemic and threatened species. a top-down approach to biodiversity characterization form landscape to species can also uses landscape modeling techniques for identification of potential sites for endangered and threatened species for conservation in situ the species by protecting their habitats (Giriraj, A. 2006). Furthermore this technique is also helpful in identifying potential biodiversity rich areas for intensive exploration for improving the plant biodiversity inventory.
2.0. STUDY AREA
The study has been conducted in India in three phases. India lies to the north of the equator between 6°44' and 35°30' north latitude and 68°7' and 97°25' east longitude. India has a coastline of 7,517 km. India covers a total geographical area of 32,87,590 km2 with 20.75% total forest cover. There are major 16 forest type groups and is a home to estimated 1.2 million species.
The natural tropical ecosystems have the largest share of the world’s vascular plant species (i.e., 45% of the total). India which is ranked as eleventh mega-biodiversity centre of the world and the third in Asia with a share of about 11% of the total floral resources has more than 17,000 species, of which 33% are endemic. The vast geographical expanse of the country has resulted in enormous ecological diversity, which is comparable to continental level diversity scales across the world. India is also recognized as one of the twelve Vavilovian centres of origin and diversification of cultivated plants (Vavilov, 1951). About 320 species belonging to 116 genera and 48 families of wild relatives of crop plants are known to have originated here.
India's unique geography and geology strongly influence its climate comprising of six major climatic subtypes, ranging from desert in the west, to alpine tundra and glaciers in the north, to humid tropical regions supporting rainforests in the southwest and the island territories.
3.0. METHODOLOGY
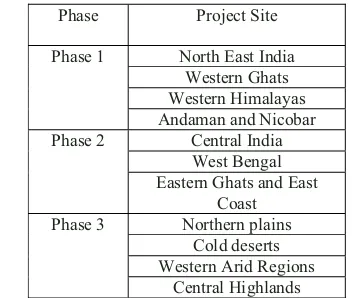
The project has been carried out in three phases. Phase-I of the project was completed in 2002 and covered North-Eastern Region, Western Himalaya, Western Ghats and Andaman and Nicobar Islands covering about 44% extent of the total forest cover of India. Phase-II of the project has covered West Bengal, Central India, Eastern Ghats and East Coast. The phase II covers about 42% of the total forest cover of India. The remaining areas have been covered in the Phase III of the project (Table 1).
\
Phase Project Site
Phase 1 North East India Western Ghats Western Himalayas Andaman and Nicobar Phase 2 Central India
West Bengal Eastern Ghats and East
Coast Phase 3 Northern plains
Cold deserts Western Arid Regions
Central Highlands
Table 1. Different regions covered in the different phases of Biodiversity Characterization at Landscape Level Project
Since the project has been carried out over 12 years involving 68 scientists and 57 research scholars from 27 organizations, making a seamless database for the entire country has been a challenge. The first and foremost was converting the phase I database which has been mapped in LCC projection with Everest datum to LCC WGS 84 datum. Using various transformation techniques with the help from SOI, the database were projected in WGS 84 datum. In areas where the WGS 84 datum transformation could not be properly carried out the regions were re-interpreted. After the projection parameters were matched the edge matching of the various regions were taken up to produce a seamless vegetation type database. Around 19750 GPS field sample points collected during the last 12 years have been tagged to the vegetation type map and necessary transformation done.
The seamless national database was subjected to landscape analysis to compute fragmentation, porosity, juxtaposition, interspersion, disturbance index and finally biological richness. The detailed methodology followed is described subsequently. 3.1. Data Inputs
3.2. Vegetation Type Mapping
The vegetation type mapping was carried out using two season (dry and wet period) satellite images of IRS LISS-III data, based on the phenology of the vegetation cover. On screen digitization was adopted for the vegetation type mapping as the delineation of the finer phenological and type variation was possible. The vegetation types were classified according to their separability on the satellite imagery. Climatic and physiognomy based classification principles were used to develop vegetation classification scheme and broadly fits into the existing Champion and Seth’s forest classification scheme followed in the Indian sub continent. Tone and texture of the satellite image were correlated with ground based observation and corresponding image chips were made for reference for on-screen digitization. The biogeography and altitude zone maps are also used to define classes. Wherever necessary, field knowledge was used to delineate the locale specific types of ecological significance.
3.3. Forest Sampling
Stratified vegetation type maps were used for forest sampling. The sample size was based on variability from 0.002 to 0.005% depending on the complexity in the area. Stratified random sampling, based on the probability proportion to size, was performed covering the local or microclimatic variability. Field information on cover type, locality, aspect, slope, geographical location using GPS, signs of disturbance and altitude were noted. Within each sample plot, following nested approach, the measurements on all trees (20x20 m), shrubs (10x10 m) and herbaceous plants (1x1m) were enumerated, and ancillary information such as unique species, various life forms and economic uses were also noted. The field data was analyzed for spatial patterns of vegetation type, species diversity, TIV, ecosystem uniqueness, biodiversity value and species richness. Further details on sampling protocols are explained in NRSA publications (NRSA, 2007). The sample size selection and adequacy was analyzed by non-parametric bootstrapping approach and Jacquard curves.
3.4. Disturbance Index
Disturbance is a manifestation of the impact of anthropogenic activities and natural disturbance on the landscape change. The disturbance is manifested in the spatial extent and distribution of the vegetation cover as well as species composition. In this model for generation of disturbance surface, as a first step, Cumulative landscape metric surface is prepared as a combination of different landscape metrics viz., fragmentation, Juxtaposition, Interspersion, Fractal Dimension, contagion etc. In the next step biodiversity driver surface, which reflect the spatial distribution of the anthropogenic/natural forces on the landscape is prepared using disturbance generating factors viz, proximity to roads, villages, fire intensity, shifting cultivation, mines and disturbance indicator parameters (diversity, invasive species, regeneration potential etc.) using ground based sampling data. Using these two surfaces, we run the model to generate the disturbance surface. A user grid cell of nxn (e.g. n=500 m) is convolved with the spatial data layer with a criterion of deriving a specific landscape metric value within
the grid cell. The iteration is repeated by moving the grid cell through the entire spatial layer. An output layer with the specific landscape metric value of a parameter is derived and associated to this a look- up table (LUT) is generated which keeps the normalized data of the landscape metric values per cell in the range of 0 to 10.
3.5. Biological richness surface
Biological richness surface is generated from a combination of the outputs of the different sub-models in an iterative process calculated cell by cell across the spatial domain of the model extent (Fig 2). The spatial layers involved in preparation of biological rich regions are – i) Disturbance, ii) Terrain and the non spatial layers are i) Ecosystem uniqueness, ii) Species richness and iii) Biodiversity value. The gradients of disturbance identified are weighted with ecosystem uniqueness, species diversity and biodiversity value, terrain complexity to identify biologically rich regions. Terrain complexity was calculated based on slope or elevation variance in a given cell of defined size. Ecosystem uniqueness of given forest type is weighted based on no. of endemic species, protected areas and composition of IUCN category of species.
Each plant has got its own value in terms of live stock, medicinal use, human food, fuel wood, timber, charcoal etc. and secondary benefits like production of oil, fiber, mats making, ropes and baskets, tanning leather etc. and indirect benefits like shape hedges, soil stabilization, nitrogen fixation role and scientific importance (Belal and Springuel, 1996). The economic importance may be related to the whole of the plant or part of it. Based on its importance, an importance value index can be derived and a range of 0 – 10 point scale is assigned for each use. Thus, the Total Importance Value (TIV) based on potential importance of the plant to the local economy is calculated as follows:
U1 + U2 + U3 + ………Un TIV % = --- x 100 No. of uses x Maximum value
Where, TIV is Total importance Value and U is importance Value for each particular use (i.e. timber, fuel wood, food etc.).The TIV of different values of all the economically important useful plants of a given forest type is s summed up to bring representative biodiversity value for each forest type.
4.0. RESULTS AND DISCUSSION:
4.1. Vegetation Type
and land use are distributed through-out the country and occur according to their bio-geographic preference. Forest which includes mixed natural formations, gregarious formations, locale specific formations, forest plantations and degraded classes and woodland covers around 19.5% of the total geographic area (TGA) of the country.
4.2. Fragmentation status
Fragmentation calculated as the number of patches of forest and non-forest in 500mx500m grid has been graded into 3 classes (low medium and high) with the values ranging from 1-38 for the entire country. The pixels having the fragmentation index values of 1 were categorized as low fragmentation, medium fragmentation have been assigned to pixels having value of 2. All the pixels having values from 3 - 38 have been categorized as high fragmentation areas. Analysis of fragmentation status in the Indian landscape has shown that considerable area around 50% of the forests is under low fragmentation. This indicates that most of the forested areas are under some protection as shown by low fragmentation in-spite of various pressures.
Disturbance Index:
Being one of the most populated regions of the world, the entire country has a very high level of anthropogenic pressure although the extent of the pressure varies from region to region. The disturbance index map of the country shows that the disturbance in the vegetated areas of the country is maximum in the western Himalayas, followed by regions in the north east where shifting cultivation is prevalent. Although Western Ghats have high amount of anthropogenic pressure, the disturbance is high only in some pockets due to prevalence of various plantations of coffee, aracanut, etc.
The Disturbance Index computed has a range of 0-72 for the entire country. The range have been categorized as low (11-18), medium (19-23), high (24-28) and very high (28-72). The mixed formations have the highest area under low disturbance and Scrub / Shrub land has the maximum area under high and very high disturbance Degradational formations as expected show a good amount of disturbance Analysis of the disturbance index in Indian vegetated regions have shown that although the disturbance is mostly concentrated in the degraded areas and scrub/shrubland, most of the natural formations are relatively undisturbed. Since the natural mixed formations contribute mostly to the biodiversity of India, the mixed natural formations have been analysed in details as to the detailed distribution of the various vegetation types with respect to the disturbance regimes.
Biological Richness (BR) Index:
India due to its unique location and varied bio-geography has a rich biological diversity. Due to the high population pressure, most of the natural areas of India are under tremendous pressure as a result of resource exploitation, need for agricultural land and development. In spite of the pressure India harbours two biodiversity hotspots in the world. The biological richness map computed has a biological richness values in the range of 17-90. The range have been categorized
similar to the disturbance index as low (17-40), medium (41-54), high (55-70) and very high (71-90).
It has been observed that the very high biological richness is present in North-east, Western Ghats, Andaman & Nicobar Islands and in some patches of Eastern Ghats especially Araku valley of Andhra Pradesh and Orissa border. This is as expected as the North eastern India especially the Arunachal Pradesh and Andaman and Nicobar Islands is a part of Indo-Malayan biodiversity hotspot and the Western Ghats is another hotpost recognized by the CBD.
Fig 2: Schematic representation of Spatial Landscape Analysis Modeling (SPLAM) (Roy et al., 2005)
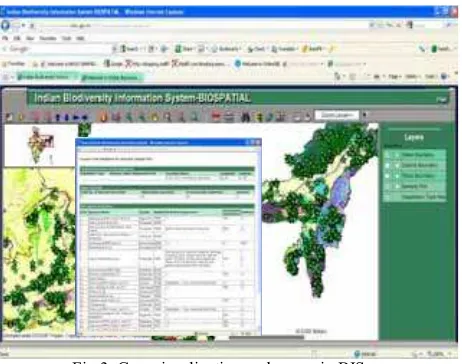
Fig 3. Geo-visualization and query in BIS
5.0. CONCLUSION
Biodiversity is a natural wealth of a nation, for which accounting and auditing is of paramount importance for intellectual property characterization and its conservation.
Proper documentation of biological diversity is essential for conservation and sustainable use of this natural wealth for the benefit of mankind. The outcome of the nationwide project – “Biodiversity Characterization at Landscape Level” have been quite significant, particularly the wall to wall and holistic database on the key inputs describing the quality and quantity on the vegetation and biodiversity at different spatial levels. This database is a baseline database on vegetation types, fragmentation status and biological richness of Indian landscape which is the key to biodiversity conservation planning and developing future management strategies for conservation efforts. Wide dissemination and utilization of data has been achieved through development of Web GIS enabled information and data services to the range of users where the geo-spatial database has been organized as a central database repository and published into internet domain through Biodiversity Information System (BIS) (Figure 3).
Using the spatially linked species database across the country in association with spatial ecological data, risk species and habitats under potential species loss risk can be identified using statistical modeling. This can form one of the databases for prioritization of ecosystem conservation. In the coming decades these information archived and disseminated by documentation of biodiversity and its associated knowledgebase will help in conservation and sustainable use of the biological resources for the benefit of mankind.
Having created a baseline data for phyto-diversity, one of the major challenges is integration of the faunal diversity in the landscape level characterization of biological diversity or biological richness wherein the mobile population of the fauna and their corridors need to be assessed (Roy et al, 2010). Monitoring of the biodiversity based on the baseline database need to be taken up. Appropriate methodologies need to be formulated for rapid assessment of the changes which have taken place. There is also need to identify the indicators of biodiversity changes amenable through satellite remote sensing for accurate monitoring of the changes. The databases also need to be regularly updated with the generation of new information and suitable mechanism need to be put in place. There is an urgent need to bring the distributed information on biodiversity like the faunal data of Zoological Survey of India, Historical plant species and distribution database of Botanical Survey of India, other biodiversity related database of various other universities and institutions, traditional knowledge mostly unwritten about the medicinal properties and other economic uses of the plants and animals in one common platform. To adress this a web-portal is being mooted for data organization, services and dissemination wherein each data source of the parent institution will act as a node for web portal in form of Indian Bio-resource Information Network (IBIN).
The database created will act as a surrogate for the conservation and sustainable management of the biological resources. The database will allow identification of gap areas, species/ habitat relationship and helps in biodiversity conservation planning by setting priority areas.
REFERENCE
Behera, M. D., Kushwaha, S. P. S. and Roy, P. S. 2005. Geo-spatial modeling for rapid biodiversity assessment in Eastern Himalayan region. Forest Ecology and Management, 207: 363-384.
Biradar, C.M., Saran, S., Raju P. L. N and Roy P. S. 2005. Forest canopy density stratification: How relevant is biophysical spectral response modelling approach? Geocarto International, 20 (1), 1-7
Chuvieco E 1999. Measuring change in landscape pattern form satellite images: short term effects of fire on spatial diversity,
International Journal of Remote Sensing, 20 (12), 2331-2346.
Coulson RN, Lovelady CN Flamm RO, Spradling SL and Saunders MC. 1990. Intellegent geographic information systems for natural resource management. In: MG Turner and RH Gardner (eds), Quantitative Methods in Landscape
Ecology, Ecological studies 82 New York: Springer-Verlag pp
153-172.
Forman, T.T.R. and M. Godron. 1986. Landscape Ecology. Wiley and Sons, New York.
GEOBON, 2011. Adequacy of biodiversity Observation System to Support the CBD 2020 targets. Report prepared for
the Convention of Biological Diversity, CSIR-NRE, Pretoria,
SA.
Giriraj, A. (2006). Spatial characterization and conservation prioritization in tropical evergreen forests of Western Ghats, Tamil Nadu using geoinformatics. PhD thesis, Bharathidasan University, Tamil Nadu.
Helmer E. H., Ramos O., Lopez T. M., Quinones M. and Diaz W. (2002). Mapping the Forest type and land cover of Puerto Rico, a component of the Caribbean Biodiversity Hotspot.
Carribbean Journal of Science, 38:165-183.
Innes JL, Koch B (1998) Forest biodiversity and its assessment by remote sensing. Global Ecology and Biogeography Letters
7:397–419. doi:10.2307/2997712.
Kempf, E., 1993. The law of the mother: protecting indigenous people in protected areas, World Wide Fund for Nature, Union
European IUCN, Sierra, and San Francisco.
Li, H., and J. F. Reynolds. 1994. A simulation experiment to quantify spatial heterogeneity in categorical maps. Ecology
75:2446–2455.
Mertens, B. and Lambin, E.F. 1997. Spatial modelling of deforestation in southern Cameroon. Applied Geography 17 (2): 143-162.
NRSA, 2007. Biodiversity Characterisation at Landscape Level in Eastern Ghats and East Coast using remote sensing and Geographic Information System. National Remote Sensing Agency, Hyderabad. ISBN-978-81-7525-878-5.
Pickett, S. T. A., and P. S. White. 1985. The ecology of natural
disturbance and patch dynamics. Academic Press, Orlando,
Florida, USA.
Geospatial model for Biodiversity Characterisation at Landscape level - a study in Andaman and Nicobar Islands, India. Ecological Modeling Vol. 185 No. 2-4, pp 349-369. Roy, A., Shantala Devi, Bijan Debnath, Murthy, M.S.R. (2010). Geospatial Model For Identification Of Potential Ecological Corridor In Orissa. Journal of Indian Society of Remote Sensing 38, 387-399.
Roy, P.S. and Tomar, S. 2000. Biodiversity characterization at landscape level using geospatial-modelling technique.
Biological Conservation. 95(1): 95-109.
Roy, P.S., S. Tomar and C. Jegannathan. 1997. Biodiversity characterisation at landscape level using satellite remote sensing. NNRMS Bulletin B-21, 12-18p.
Skole, D., and Tucker, C. 1993. Tropical deforestation and habitat fragmentation in the Amazon: satellite data from 1978 to 1988. Science 260: 1905-1910.
Vavilov, N.I. 1951. The Origin, Variation, Immunity and Breeding of Cultivated Plants. Selected writings. Ronald Press, New York.
White, P.S. and S.T.A. Pickett. 1985. Natural disturbance and patch dynamics: an introduction. In S.T.A. Pickett and P.S. White (eds.), The Ecology of Natural Disturbance and Patch
Dynamics, Academic Press, New York, pp.3-13.
ACKNOWLEDGEMENT