AUTOMATED CONSTRUCTION OF COVERAGE CATALOGUES OF ASTER
SATELLITE IMAGE FOR URBAN AREAS OF THE WORLD
Hiroyuki Miyazaki a,*, Koki Iwao b, Ryosuke Shibasaki a
a Center for Spatial Information Science, The University of Tokyo, Japan - (heromiya, shiba)@csis.u-tokyo.ac.jp b National Institute of Advanced Industrial Science and Technology, Japan – [email protected]
Commission VIII, WG VIII/8
KEY WORDS: coverage catalogue, urban area, gazetteer, ASTER, metadata database
ABSTRACT:
We developed an algorithm to determine a combination of satellite images according to observation extent and image quality. The algorithm was for testing necessity for completing coverage of the search extent. The tests excluded unnecessary images with low quality and preserve necessary images with good quality. The search conditions of the satellite images could be extended, indicating the catalogue could be constructed with specified periods required for time series analysis. We applied the method to a database of metadata of ASTER satellite images archived in GEO Grid of National Institute of Advanced Industrial Science and Technology (AIST), Japan. As indexes of populated places with geographical coordinates, we used a database of 3372 populated place of more than 0.1 million populations retrieved from GRUMP Settlement Points, a global gazetteer of cities, which has geographical names of populated places associated with geographical coordinates and population data. From the coordinates of populated places, 3372 extents were generated with radiuses of 30 km, a half of swath of ASTER satellite images. By merging extents overlapping each other, they were assembled into 2214 extents. As a result, we acquired combinations of good quality for 1244 extents, those of low quality for 96 extents, incomplete combinations for 611 extents. Further improvements would be expected by introducing pixel-based cloud assessment and pixel value correction over seasonal variations.
1. INTRODUCTION
Urbanization has been a main concern for regional and global environmental change (Foley et al., 2005) and socio-economic problems (Angel, Sheppard, and Civco, 2005). Various kinds of studies have used satellite-derived global urban area maps to evaluate critical aspects of urbanization for global environmental change, such as size, scale and form of cities and conversion of land cover. The studies using global urban area map had provided valuable information of urbanization especially for less documented regions. As the studies on urbanization progressed, however, 1-km spatial resolution of global urban area map have gotten obsolete for measuring spatial structure of urban area in fine scale (Angel, Sheppard, and Civco, 2005) and for modelling land use conversion with socio-economic variables (Nelson and Robertson, 2007). Developing high-resolution urban area map would be key issue for promoting new insights on urban dynamics. Several studies had developed urban area map only for their cases using high-resolution satellite images (e.g. Landsat, Terra/ASTER, IKONOS and Quickbird) and shown valuable outcome; however mapping urban area using high-resolution satellite images involves considerable time and labour cost. It prevents comprehensive and comparative studies on urban dynamics on world’s cities.
Extents of urban area are often broader than coverage of a satellite images. Therefore, you are required to collect satellite images for a city when you conduct satellite-based analysis of urban area of the city. We regard ready-to-use collection of satellite images for every city will promote comprehensive studies of urban area using satellite images. In this paper, we
present a method for constructing catalogues of satellite images of cities of the world. We also present a result of the method spatial query to identify scenes covering the inclusion extent; and assigning the orders to reduce cloud contamination. Here, we describe each step.
2.1 Defining urban extent of cities
For the urban area mapping, we had to define the spatial extent to be mapped. Fortunately, many existing maps of broad scale have already spatially indexed the cities of the world with geographical coordinates. Among them, we employed GRUMP Settlement Points (GSP; http://sedac.ciesin.columbia.edu/gpw/), a global gazetteer of populated places, as a primary index of the cities. The first reason of using it is that it had an almost complete coverage for the cities of more than 1000 population. Second, it had been manually associated to geographical coordinates of the cities. This direct human input is indispensable for accurate association of place names with geographic data because insufficient information from the source prevents automatic matching (Doerr and Papagelis, 2007). Third, GSP includes the estimated population of each city, which can be used to order priority of the urban area mapping.
International Archives of the Photogrammetry, Remote Sensing and Spatial Information Sciences, Volume XXXIX-B8, 2012 XXII ISPRS Congress, 25 August – 01 September 2012, Melbourne, Australia
In some intensively populated region, the coordinates of the cities are mutually so close that those would be within an extent of a satellite images. Such cities are often continuously connected as a cluster of urban area. However, clusters larger than swath of satellite images could be divided if the catalogues are constructed by cities which are separated into different scenes. Therefore, we defined clusters of urban area from GSP. We assembled the coordinates of the cities close to each other into a COC. The distance was set to 30 km considering the 60-km swath widths of the ASTER/VNIR. Finally, clusters of urban area were constructed with the extent of 30-km buffer from the assembled point coordinates of the COC.
2.2 Determining combination of scenes
To simplify selection procedure of satellite images, we assumed that merging satellite images with zero cloud contamination and little cloud will achieve a combination free of cloud or less cloud. That assumption indicates that choosing the least contaminated satellite images would provide the least contaminated combination. Once picking up the least cloud-contaminated scenes, we may remove redundant scenes which are overlapping with each other so that necessary scenes are preserved for completing coverage of urban extent of a city of interest.
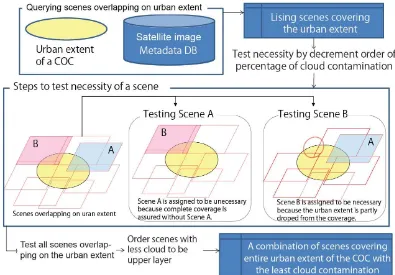
With that assumption and strategy, we proposed an algorithm to determine the least cloud-contaminated combination using metadata database of satellite images with percentile of cloud contamination (Figure 1).
1. Order scenes overlapping with urban extent of a city by percentage of cloud contamination in decrement.
2. Test the necessity of the first scene for keeping complete coverage on the urban extent. If the urban extent is still covered without the scene, the scene is assigned unnecessary, and vice versa.
3. Test the necessity of all the scenes. The scenes assigned to be necessary are to be included in the combination with the least contaminated with cloud. 4. Order the scenes included in the combination by percentage of cloud contamination incrementally.
3. RESULT AND DISCUSSION
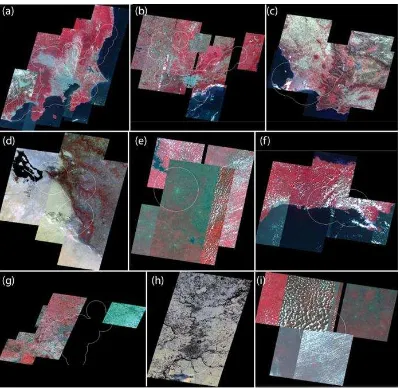
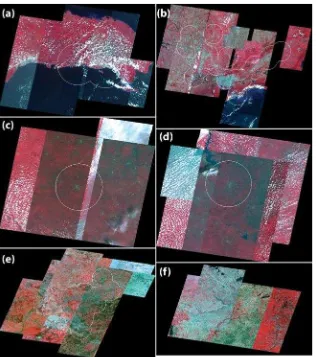
For the experiment, we used the 3734 data points of the subset with more than 0.1 million from the GSP. By the 30-km rule, the 3734 data points were assembled into 2214 COCs. The combinations of the scenes for the COCs were determined by the procedure of checking necessity. To reject apparently unusable scenes, we set constrain on cloud contamination less than 20%. We also considered incidental failure of SWIR sensor, which is used for assessing cloud contamination, from 1 April in 2008, and set search period from the beginning to 31 March in 2008. As a result, for 1951 of the 2214 COCs, the combinations of the 11802 scenes were successfully assigned. For the other COCs, there was not any scene with condition of cloud contamination less than 20% over the search period. In ASTER/VNIR images were successfully organized; however, for the other 611 COCs, the combinations were incomplete to cover the extent of the COC or considerably contaminated with cloud. For the 611 COCs, we manually selected ASTER/VNIR images and ordered them (Figure 3). By the manual procedure, the visual appearances of the merged images were improved; Figure 1. Steps to test necessity of scenes overlapping on urban extent of a crowd of cities.
International Archives of the Photogrammetry, Remote Sensing and Spatial Information Sciences, Volume XXXIX-B8, 2012 XXII ISPRS Congress, 25 August – 01 September 2012, Melbourne, Australia
however, some of them were still contaminated with cloud and haze.
In the selection of satellite images, cloud contamination was the main obstacle to determine the best combination of the satellite images. In this experiment, we used the database with rate of cloud contamination assessed by scene; therefore we could not reject cloud contamination partly occurred in the images. By assessing cloud contamination for each pixel (e.g. Tonooka et al. 2010), good-quality pixels of images partly contaminated with clouds would be combined with other good-quality pixels. Pixel-based assessment also would yield availability of the rejected images by less-than-20% criteria to be used for the urban area mapping, indicating that the pixel-based assessment would be necessary for completing the urban area map of the cities of the world.
4. CONCLUSION
In this paper, we presented a method to construct coverage catalogues of satellite images of urban areas of the world. We proposed and implemented an automated algorithm to select the best combination of satellite images covering a target COC. The experimental results showed that there were considerable spaces
to be improved for complete coverage of urban area maps, especially with assessing cloud contaminations. We found that omitted cloud contaminations from the assessment were major causes of inferior quality of the merged satellite images. We regard that introducing pixel-by-pixel assessment of cloud contamination is needed for better quality of the urban area maps.
The method had still much space to be improved; however, we regard that, with the improvement, it would be a great contribution to completing high-resolution urban maps of the world and realizing Global Earth Observation Systems of System (GEOSS).
ACKNOWLEDGMENT
This research used ASTER Data beta processed by the AIST GEO Grid from ASTER Data owned by the Ministry of Economy, Trade and Industry of Japan. The study was supported by a grant from Grant-in-Aid for JSPS Fellows (22-2598).
Figure 2. Examples of the results of automated selecting the ASTER/VNIR images. The background images are false color composite of the merged ASTER/VNIR. The white lines represents the boundary of the crowd of cities. (a) Tokyo (Japan), (b) Sao Paulo (Brazil), (c) Cape Town (South Africa), (d) Najaf (Iraq), (e) Yamoussoukro (Republic of Cote d'Ivoire), (f) La Romana (Dominican Republic), (g) Koln (Germany), (h) Rockford (United States of America), (i) Gagnoa (Republic of Cote d'Ivoire)
International Archives of the Photogrammetry, Remote Sensing and Spatial Information Sciences, Volume XXXIX-B8, 2012 XXII ISPRS Congress, 25 August – 01 September 2012, Melbourne, Australia
REFERENCES
Angel, Shlomo, Stephen C Sheppard, and Daniel L Civco. 2005. The Dynamics of Global Urban Expansion.
Doerr, M, and M Papagelis. 2007. “A Method for Estimating the Precision of Placename Matching.” IEEE Transactions on Knowledge and Data Engineering 19 (8): 1089-1101. doi:10.1109/TKDE.2007.1033. Foley, Jonathan A, Ruth DeFries, Gregory P Asner, Carol
Barford, Gordon Bonan, Stephen R Carpenter, F Stuart Chapin, et al. 2005. “Global Consequences of Land Use.” Science 309 (5734): 570-574.
doi:10.1126/science.1111772.
Nelson, G C, and R D Robertson. 2007. “Comparing the GLC2000 and GeoCover LC land cover datasets for use in economic modelling of land use.” International Journal of Remote Sensing 28 (19): 4243-4262. Tonooka, Hideyuki, Kunjuro Omagari, Hirokazu Yamamoto,
Tetsushi Tachikawa, Masaru Fujita, and Zaoreguli Paitaer. 2010. ASTER cloud coverage reassessment using MODIS cloud mask products.
Figure 1. Examples of the results of manual selection of ASTER/VNIR images. The background images are false color composite of ASTER/VNIR. The white lines represent the boundary of the crowd of cities. (a) La Romana (Dominican Republic), (b) Sao Paulo (Brazil), (c) Gagnoa (Republic of Cote d'Ivoire), (d) Yamoussoukro (Republic of Cote d'Ivoire) , (e) Koln (Germany), (f) Rockford (United States of America)
International Archives of the Photogrammetry, Remote Sensing and Spatial Information Sciences, Volume XXXIX-B8, 2012 XXII ISPRS Congress, 25 August – 01 September 2012, Melbourne, Australia