SHADOW EFFECT ON PHOTOVOLTAIC POTENTIALITY ANALYSIS
USING 3D CITY MODELS
N. Alam a, *, V. Coors a, S. Zlatanova b, P. J. M. Oosterom b
a Faculty of Surveying, Computer Science and Mathematics, Stuttgart University of Applied Sciences, Schellingstr. 24, 70174 Stuttgart, Germany - (nazmul.alam, Volker.coors)@hft-stuttgart.de
b OTB, GIS-technology, Delft University of Technology, Jaffalaan 9, 2628 BX Delft, The Netherlands – (S.Zlatanova, P.J.M.vanOosterom)@tudelft.nl
KEY WORDS: Shadow Detection, Solar Energy, Photovoltaic System, 3D City Models, Potentiality Analysis, 3D GIS
ABSTRACT:
Due to global warming, green-house effect and various other drawbacks of existing energy sources, renewable energy like Photovoltaic system is being popular for energy production. The result of photovoltaic potentiality analysis depends on data quality and parameters. Shadow rapidly decreases performance of the Photovoltaic system and it always changes due to the movement of the sun. Solar radiation incident on earth’s atmosphere is relatively constant but the radiation at earth’s surface varies due to absorption, scattering, reflection, change in spectral content, diffuse component, water vapor, clouds and pollution etc. In this research, it is being investigated that how efficiently real-time shadow can be detected for both direct and diffuse radiation considering reflection and other factors in contrast with the existing shadow detection methods using latest technologies and what is the minimum quality of data required for this purpose. Of course, geometric details of the building geometry and surroundings directly affect the calculation of shadows. In principle, 3D city models or point clouds, which contain roof structure, vegetation, thematically differentiated surface and texture, are suitable to simulate exact real-time shadow. This research would develop an automated procedure to measure exact shadow effect from the 3D city models and a long-term simulation model to determine the produced energy from the photovoltaic system. In this paper, a developed method for detecting shadow for direct radiation has been discussed with its result using a 3D city model to perform a solar energy potentiality analysis.
* Corresponding author.
1. INTRODUCTION
Photovoltaic potentiality analysis is very complex and important task, since this expensive technology has become an essential part of urban planning. Even governments in some countries are also boosting and supporting photovoltaic energy production by involving private households through various strategies. China is fuelling the solar companies with cheap loans amounting 21 billion euros which lowers price 30 percent below the production cost. Germany has also been supporting solar industry with subsidies, incentives and feed-in tariffs (Wasserrab, 2011). But before installing it is essential to know how much energy will be produced and how long will it take to recover the cost. Photovoltaic cells are expensive and if it is placed at a wrong place where due to shadow, the production is much lower than it was measured from potentiality analysis, they will lose money. Therefore it must be investigated to measure exact shadow effect and sunlight intensity on each surface. Energy production from photovoltaic system depends of incident solar energy and photovoltaic efficiency. Efficiency of photovoltaic cell depends on spectrum and intensity of incident light and temperature of the cell. Solar energy incident upon a surface depends on longitude, latitude, sun angles, surface tilt, surface orientation, contribution of direct and diffuse radiation, absorption, reflectance, shadow caused by surrounding objects etc. 3D models are most realistic options for detecting shadow and other parameters. Advancement in geo-information is producing high quality and realistic 3D urban models including high geometric details which are being used for urban planning, cultural heritage, navigation, gaming, disaster management, architecture and other purposes. A good
basis for automatic detection of best fitting roof and façade surface for photovoltaic cells in terms of energy performance and integration possibilities are 3D city models. Buildings are the largest consumers of energy in cities. For large scale implementation in the urban areas building integrated photovoltaic system is an appropriate option. A calculation procedure of shading factor under complex boundary condition can be found in Cascone et al. (2011), which introduced an external shading reduction coefficient of the incident solar radiation based on simplified hypothesis. Baum (2009) has developed shadow analyzer tool for the analysis of the shadow from external objects as well as sun tracking solar collector for very small area, which gives an approximate result by considering default monthly probabilities of clear sky. Joachem et al. (2009) considered shadowing effects by calculating the horizon of each point, which used full 3D information based on input LIDAR point clouds where small objects are not considered and excluded from the profile line. Hofierka & Kaňuk (2009) presents a methodology for photovoltaic potential which includes a shadowing algorithm which was unable to be used with vertical façades. Izquierdo et al. (2008) described a method for estimating the potential roof surface for large-scale evaluations excluding façades. Here the influences of hourly shadow on monthly values and spacing needed between modules to avoid shadowing are taken into account.
The paper has been organized with a brief introduction at the beginning explaining background of photovoltaic energy and motivation for this research in section 1. Then some related researches have been mentioned to find out the gap in literature.
The effect of shadow on photovoltaic cells and a methodology for detecting shadow from direct radiation has been explained in section 2. Then result has been shown applying the methodology and some brief idea about the future work of this research has been presented in section 3 and 4.
2. METHODOLOGY
The simulation of the shadow effect is based on the 3D data. To consider the shadow effect a model has been developed, which determines the exact shadow projected onto each of the surfaces of the analyzed area for direct radiation. For photovoltaic potentiality analysis knowing incident radiation on each cell is important, because partial shading cause different results in different cases. Effectiveness of a cell depends on amount of incident sunlight and its intensity. Photovoltaic cells electricity production is proportional to the intensity of sunlight only until the entire module is exposed to the sun, but this does not happen simultaneously. In a module photovoltaic cells are connected in series. Dart or shadow significantly reduces the performance. The weakest link cell in the chain limits the amount of energy production. Therefore it is important to know the exact shadow location. The amount of power loss also depends on the size and darkness of shadow. But darkness of shadow depends on diffuse radiation and many other parameters. At this phase of the research only direct radiation has been considered but other parameters will be considered in future phases.
The 3D models are mostly consisting of polygons. First step is to read these sets of polygons and then triangulate each of them. Shadow will be calculated for specific points distributed over the surface, which will represent the whole surface. So to achieve a fine resolution each triangle is further triangulated and middle point of each side is connected and thus the triangle is divided into four smaller triangles, the process is repeated until the length of the smallest side is larger than the desired resolution. This resolution represents the maximum distance between two points. Then the centroid of the triangle is measured and a line towards the sun’s direction is calculated representing the sun’s ray. Here the real time sun information is used. The next step is to look if the sun’s ray intersects any of the surfaces. For this purpose it is checked if the line intersects with any of the triangles found in the second step. As light always follow straight line, a simple line plane intersection check will give shadow information. If any intersection point is found then the triangle can be declared as a shaded triangle and joining the shaded triangles together will help to find the shadow polygon on any surface. The process may face problem with thin triangles. So, for triangles with very narrow angles triangulation can be done by dividing the triangles according to the longest side. Thus the problem with thin triangles can be avoided and a high quality result can be obtained. The transparency of the obstacle in this case has an impact. This approach is only applied for direct or beam radiation. For diffuse radiation surrounding buildings and objects should also be considered. Any reflective surface in surrounding area would cause an increase in diffuse radiation. The procedure has to be applied for every time step of the simulation due to the changing solar position. The complete process has been illustrated in Figure 1.
Figure 1. Workflow of shadow detection (Alam et al, 2011)
Only the roof surface and façades were taken into account. The steps has been discussed below:
2.1 Sun angles detection
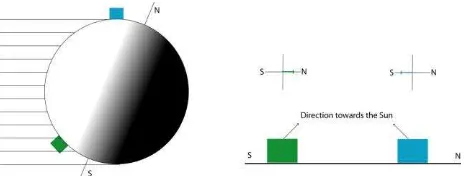
In this step, sun’s azimuth and zenith are calculated with the simulation engine INSEL (Schumacher, 1991) at any specific time. Azimuth is measured from north and zenith is measured from ground level. Approximately at noon azimuth will be close to 180 degree in northern hemisphere and close to zero degree in southern hemisphere shown in Figure 2. This depends upon the direction of sun from any point on earth.
Figure 2. Direction of the sun at different hemisphere measured from north
2.2 Potential surface filtering
Then tilt and orientation are calculated from the surface by extracting the surface normal. Angular distance of surface normal from the ground and north were measured. The motion of sun has a great impact on the amount of power received by the PV system. The availability of direct radiation is the most when the surface normal and the sun’s ray is parallel and it is near to zero when the surface normal and sun’s ray has an angle more than 90 degree. So, the surface filtering must pass these two conditions:
90 90 t z
o
a (1)
where a = azimuth o = orientation z = zenith t = tilt
An additional filtering for surface dimension is applied to avoid the narrow surface not suitable for PV installation. So, for surface dimension filtering, requirements for minimum length
and width of a PV array must be fulfilled. For rectangular
lm = minimum length requirement for PV array wm = minimum width requirement for PV array
Irregular shaped surface are placed in a bounding box (approximated by a smaller box) determined by south-west and north-east corner or upper-left and bottom-right corner. So, for irregular shaped surface: triangles extracted from potential surfaces are further subdivided into smaller triangles. This subdivision for potential surface is done in two steps: thin triangle subdivision and regular triangle subdivision.
2.3.1 Thin triangle subdivision: If a triangle has an angle
less than 30 degree then this subdivision is applied. Here the thin triangle is divided into two triangles by joining the middle point of the longest side and the opposite vertex. The resulting triangles are assigned with thin triangle subdivision indices. The resulting triangles are further passed through the triangle subdivision process.
2.3.2 Regular triangle subdivision: If thin triangle
subdivision process is passed then the triangles are passed through this regular triangle subdivision process. A maximum distance between two points is assumed as the resolution (i.e. 10 cm). Each sides of the triangle are divided into two parts. The middle points are connected to form four smaller triangles. Then each resulting triangle is further passed through this process until the smallest side of the triangle is less than resolution. The final triangles are assigned with regular triangle subdivision indices.
2.4 Sun’s ray calculation
Centroids of final subdivided triangles are assumed as the target points for which shadow will be calculated. Whether the above the top most point in the city model.
2.5 Potential shadow caster filtering
For each point, the whole city models are divided into four quadrants, divided by the north-south and east west axis. The quadrant, which contains the sun, is marked as active quadrant and surfaces, which have at least one vertex in this area, are selected as potential shadow caster surface. Surfaces, which are below the target point, are further filtered from the selection by comparing the elevation or height of each vertex of the surface with the target point.
2.6 Shadow calculation
This is the main step, where shadow is calculated. A line-plane intersection check is performed here. A line can be expressed
A triabgle can be expressed as:
R
At intersection point the point on line will be equal to the point on surface so by solving the equation in matrix form:
lm = minimum length requirement for PV array wm = minimum width requirement for PV array
If the line lies upon the surface or parallel then la– lb, P1– P0, P2 – P0 will be linearly independent. In this case, if line lies upon the surface then the point must be also marked as shadowed. To determine if the line lays upon the surface a further line-line intersection check is performed for each side of the triangle with the sun’s ray by solving equation of two lines. If two lines are Ma + (Mb– Ma)t1 and Na + (Nb– Na)t2 then t1
and t2 can be obtained by solving the equations for x and y. If the value for t1and t2 also satisfies the equations for z then there
is an intersection. Then it is checked if the intersection point lies within the lines. If all requirements are fulfilled for intersection then the point is marked as shadowed point.
2.7 Surface regeneration
Only the surfaces where at least one subdivided triangle is shadowed are considered for surface regeneration. This step is only necessary when a visual output for real time shadow is required for an instance of time. If the calculation is carried out for any longer time period like and hourly or minutely shadow calculation then this step might be excluded. Neighbouring subdivided triangles with same shadow status are joined together to form shadow and non-shadow region. These regions are further merged with other neighbouring region with similar shadow status.
The whole process produces result for an instance of time. To get hourly or minutely shadow calculation this has been repeatedly applied and the result has been presented in a tabular form.
3. IMPLEMENTATION
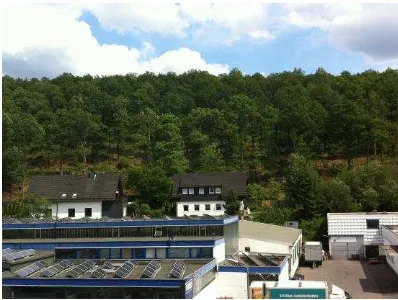
To implement this method a specific area in Germany was considered. Former military area Scharnhauser Park shown in Figure 3 is an urban conversion and development area of 150 hectors in the community of Ostfildern on the southern border near Stuttgart with 7000 inhabitants. About 80% heating energy demand of the whole area is supplied by renewable energies and a small portion of electricity is delivered by existing roof top photovoltaic system (Tereci et al, 2009). This has been selected as the study area for this research because of availability CityGML and LIDAR data, building footprints and existing photovoltaic cells on roofs and façades. Two types of data have been considered for this research, CityGML and LIDAR for accuracy. Line plane intersection method has been used initially for direct radiation. LIDAR points are suitable for selecting points on a surface from which the suns direction represents the line. For CityGML data these points needs to be extracted using surface subdivision and triangulation. But planes are represented by facesets in CityGML, which is also need for the algorithm. LIDAR points are needed to be converted into planes using surface reconstruction. So, both types of data are potential for this research.
Figure 3. Residential area Scharnhauser Park (Eicker et al, 2010)
An existing method for photovoltaic potentiality analysis which doesn’t consider shadow has been selected as a starting point. Solarcity3D is a student project from University of Applied Sciences Stuttgart. This is a Software Interface for the calculation and visualization of photovoltaic potential in city areas. It connects 3D city models and simulation engines for the calculation and visualization of potential energy yields. Parameters considered here are geographical position and
orientation, roof area and pitch, climate conditions etc (Solarcity3D, 2009). This will be modified and fast and exact shadow detection method will be added and effect will be determined during this research as well as the guideline for minimum quality of data required for the calculation will also be prepared.SolarCity3D is the base of this research so the shadow calculation has been integrated with its system architecture.
Figure 4. System Architecture (Alam et al, 2011)
For shadow calculation geometrical information is needed as input and semantic information serves the simulation tool. Citymodel Administration Toolkit (CAT3D) has been used, to handle, manage and merge different formats of 3D Geodata, DBMS, and data schema on the server side. It provides data in different layers, which can group objects thematically for clients to query models according to needs. CAT3D framework is divided into four parts: Data Connectors, Data Format Creators, Data Mapping and Utilities (Knapp et al, 2007). Shadow calculator gets the information from CAT3D framework and performs shadow calculation at specified time interval (per day, hour, minute) and prepares a CSV file with shadow information for each building. This file is feed into the SolarCity3D for solar potentiality analysis with the simulation engine INSEL. A 3D viewer is used for classified visualization of the results. And the final potentiality result with shadow consideration is also presented in excel file. Figure 4 represents the whole system architecture.
4. RESULT & ANALYSIS
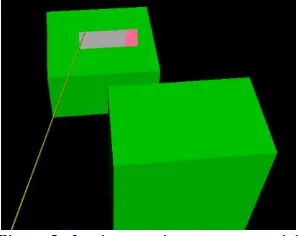
Initially to check the algorithm a test model with two buildings as shown in Figure 5, have been tested one of which has a photovoltaic module on its roof.
Figure 5. Implementation on a test model
The model has been tested for each hour of the year, which means 8760 times. The test has given correct tabular result
which is too big to present here. But it is clear from Figure 5 that if the yellow line represents sun’s ray then the pink area will be in shadow caused by the building in front.
Then the method was applied for actual city models. In Figure 6 most of the roofs are shadowed marked by green because it was early in the morning and the yellow line is direction the sun.
Figure 6. Shadow area in the morning
Figure 7 show the result of afternoon when more roofs marked in red gets sunlight.
Figure 7. Shadow area in the morning
The information of shadow is obtained for the whole model where the surface is potential for energy production. As energy production of a photovoltaic module is determined by the weekest link, the position of shadow will affect the result. In Figure 8 shadow caused by the linear object partially blocks 4 cells in module A and 5 cells in module B which will cause significant difference in energy production than unshadowed module at same condition. The linear objects might be electric or telephone wire, or antenna, which are only present in detail city models. An example has been presented in Figure 9 for existing photovoltaic modules.
Figure 8. Shadow from a linear object on photovoltaic module
Figure 9. Shadow from a temporary objects like antenna and signboard on photovoltaic module
In the right side of Figure 9 a rectangular object is blocking the photovoltaic module. This is a temporary object and might not always be present within the city model. But it has also significant impact on energy production.
Figure 10. Shadow on photovoltaic module of same size and shape but in different location.
In figure 10 shadows of same size but on different position will cause different shadow effect. Because for module A 12 cells are completely shaded and for module B 6 are completely shaded and 12 are partially shaded, which means 18 cells are affected in module B.
Terrain has also big impact on shadow calculation. In Figure 11 an example has been presented where photovoltaic modules has been installed beside a hill which causes daily reduction of sun hour. But if the terrain is not included in the city model then the result will be very different from the reality.
Figure 11. Shadow area in the morning
5. CONCLUSION AND FUTURE WORK
A general research challenge has been introduced for using 3D city models to estimate shadow effect in solar potentiality analysis. The parameters for photovoltaic energy prediction, solar energy parameters and facts have also been mentioned. We have discussed about technologies involved to represent 3D city models. The test implementation on a study area for beam radiation has also been presented. Future work of this research will focus on detection of diffuse radiation, impact of reflection, utilization of programmable rendering pipeline of modern graphics hardware or GPU. This research will also focus the data quality of 3D city models and LIDAR point clouds, which is minimum for solar energy potentiality estimation. Future work of this research also includes development of soft shadow algorithm will consider the indirect radiation also. When the sun is blocked by any obstacle, only the direct radiation is blocked but it doesn’t get completely dark. Then exact shadow algorithm will be developed for both hard and soft shadow and also reflectance, texture, color of surrounding objects. This will represent the real life shadow impression. Quality of data plays a vital role in this research. There will always be a limit to what extent the building information as well as neighbouring object information can be extracted. The emphasis of next part of research work would be to prepare a suggestion or a guideline of which kind of data have influence on the photovoltaic output. Finally a demo version of the shadow simulator will be prepared. This will provide a service to calculate real time shadow as well as total and average shadow to feed in to the photovoltaic potentiality simulator and also as an output data.
REFERENCE
References from Journals:
Cascone, Y., Corrado. V & Serra, V., 2011. Calculation procedure of the shading factor under complex boundary conditions. Solar Energy, 85(10), pp. 2524-2539.
Hofierka, J. & Kaňuk, J., 2009. Assessment of photovoltaic potential in urban areas using open-source solar radiation tools. Renewable Energy, 34(10), pp. 2206-2214.
Izquierdo, S., Rodrigues, M. & Fueyo, N., 2008. A method for estimating the geographical distribution of the available roof surface area for large-scale photovoltaic energy-potential evaluations. Solar Energy, 82(10), pp. 929-939.
Joachem, A., Hoefle, B., Rutzinger, M. & Pfeifer, N., 2009. Automatic roof plane detection and analysis in airborne LIDAR point clouds for solar potential assessment. Sensors, 9(7), pp. 5241-5262.
References from Other Literature:
Alam, N., Coors, V, Zlatanova, S. & Oosterom, P., 2011. Shadow effect on photovoltaic potentiality analysis using 3D city models. In: Proceedings of the Joint ISPRS Workshop on 3D City Modelling& Applications and the 6th 3D GeoInfo Conference, 26-28 June, 2011, Wuhan, China.
Eicker, U., Strzalka, A., Schulte, C. Bogdahn, J., Schumacher, J., Coors, V., 2010. Large Scale Integration of Photovoltaic in Cities ICSU 2010, 1st International Conference on Sustainable Urbanization, 15-17 December 2010, Hong Kong, China
Schumacher, J., 1991. Digitale Simulation regenerativer elektrischer Energieversorgungssysteme, Dissertation, Universität Oldenburg, Oldenburg, Germany.
SolarCity3D, 2009. Solar Potential Calculation and Visualization based on 3D CityModels. [Poster]. Stuttgart : HFT Stuttgart, 2009. Student Project.
Tereci, A., Schneider, D., Kesten, D., Strzalka, A. & Eicker, U., 2009. Energy Saving Potential and Eco-nomical Analysis of Solar Systems in the Urban Quarter Scharnhauser Park, ISES Solar World Congress, Renewable Energy Shaping Our Future. 11-14 October 2009Johannesburg, South Africa.
References from websites:
Baum, I. V., 2009. Documentation on Dr. Baum Research e.K. “Shadow Analyzer”, Schwäbisch Hall, Germany.
http://www.drbaumresearch.com/prod38.htm. (11 Dec. 2010)
Waserrab, J., 2011. Report on Deutsche Welle “Germany’s solar industry loses its shine”, Bonn, Germany.
http://www.dw-world.de/dw/article/0,,15423618,00.html (29 Sep. 2011)