Biochemical Systematics and Ecology 29 (2001) 125}136
Species discrimination and population
di
!
erentiation in ants using microsatellites
Julie M. Macaranas
1
, Donald J. Colgan
*
, Richard E. Major,
Gerasimos Cassis, Michael R. Gray
Centre for Biodiversity and Conservation Research, Australian Museum, 6 College Street, Sydney 2010 NSW, Australia
Received 24 November 1999; accepted 22 March 2000
Abstract
This study was conducted to establish the regional scale of population di!erentiation of ants in the wheat belt of central western New South Wales. Microsatellite variation was surveyed at
"ve loci in two morphologically similar ant species (designated `Aa and `Ba) from the
Camponotus ephippiumcomplex. Three of the"ve scored microsatellite loci were highly variable with totals, in the two species, of 11, 13 and 42 alleles. The other loci had two and three alleles. The mean number of alleles per locus per sample ranged from 2.0 to 4.6 for species A and from 1.4 to 3.8 in species B. Mean observed heterozygosity was 0.385 for species A and 0.363 for species B. The geographic distribution of genotypes was signi"cantly non-random for all tested loci in both species. Eight of 47 alleles in species A and 15 of 28 in species B were restricted to a single site. Allelic accumulation percentages were calculated for several orderings of samples
*level of heterozygosity, sample size and geographic position. In all orderings three or more samples must be included for more than three-quarters of alleles to be represented. ( 2001 Elsevier Science Ltd. All rights reserved.
Keywords: Camponotus; Ant; Microsatellite; Species discrimination; Genetic variation
1. Introduction
There has been a long and continuing interest in the genetics of ants, with eager application of new techniques to questions about colony structure and nest
1Present address: DFID Fish Genetics Program at Asian Institute of Technology, Aquaculture & Aqua-tic Resources Management Program (AARM). PO Box 4, Klong Luang, Pathumthani 12120, Thailand.
*Corresponding author. Tel.:#61-2-9320-6000.
E-mail address:[email protected] (D.J. Colgan).
inter-relationships (Pamilo et al., 1997). In general, signi"cant genetic structuring in ant species has been observed at scales of tens of metres and of a few kilometres.
At these scales, the amount of di!erentiation is strongly associated with the
sociogenetic organisation of a species' colonies and its means of dispersal
(Sundstrom, 1993; Seppa and Pamilo, 1995; Chapuisat et al., 1997; Tay et al., 1997; Ross et al., 1997). Monogynous species, which generally take part in mating
#ights and found new nests independently, are less di!erentiated than polygynous
species. These are characterised by reduced queen dispersal during mating with budding as a major mode of nest founding (Pamilo et al., 1997; Pedersen and Boomsma, 1999).
In contrast to the level of interest in local genetic di!erentiation, there has
been relatively little emphasis on regional level di!erentiation in ants. This level
would be important for the extension of ants' use as ecological species indicators
(Andersen, 1990; Bestelmeyer and Wiens, 1996) to conservation genetics. This
paper examines genetic variation at the regional level in ants of the Camponotus
ephippium species group in the wheat belt of central western New South Wales. Microsatellites were chosen for study, as they have proven generally applicable
to analyses of "ne-scale di!erentiation and gene #ow studies in ants (Pamilo
et al., 1997). Moreover, primers have been developed forCamponotusby Gertsch et al.
(1995) and Crozier et al. (1999), the latter already having proven successful in
ampli"cation of DNA from species other than C. consobrinusin which they were
developed.
Habitat fragmentation potentially causes di$culties for the maintenance of genetic
and species diversity by restricting gene #ow and lowering the likelihood of
re-establishment of locally extinct populations through immigration (reviewed in For-man, 1995; Setterle et al., 1996). Questions of concern include the degree to which fragmentation has reduced intra-population variation, whether this has impinged on variation in the regional population considered as a whole, and what strategy should be adopted for reservation practices to maximise the probability of maintaining genetic variability.
2. Materials and methods
2.1. Study site
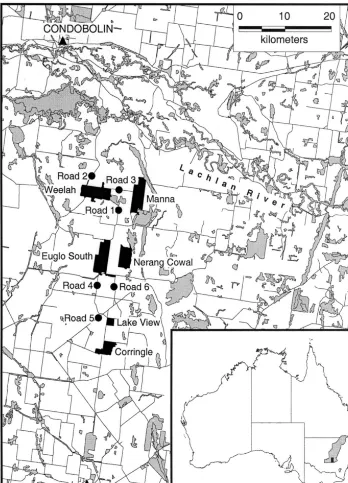
The study area (Fig. 1) lies in the wheatbelt of New South Wales between West Wyalong and Condobolin. Sivertsen and Metcalfe (1995) describe its vegetation. Only 16% of the native vegetation in the region has escaped the clearing that began on an extensive scale in the late 1800s. Much of the remnant native vegetation is on public land such as state forests and roadside reserves. The sample sites comprise six state forests between 640 and 1860 ha in area and six long roadside reserves of approximately 20 m in width. The length of the study area is about 40 km from north to south and its breadth about 14 km, with 1.2 km between the nearest pair of sites.
Fig. 1. Map of the study area. The inset shows the location of the area in the central wheat belt (shaded). The state forests are: Weelah, Manna, Euglo South, Nerang Cowal, Lake View and Corringle. The road reserves are numbered from 1 to 6 and are indicated by"lled circles. Other areas of native vegetation are shown by light shading.
2.2. Study species
C. ephippiumgroup species are widely distributed in the area (Major et al.,1999). Worker ants, of what was believed to be one species based on morphological taxonomy (voucher specimen numbers K150547-9, K150550-1 and K150552-3), were
sampled by hand. One ant was taken from each 20}30 m length (approximated) along
the entire distance of a 500 m transect bisected by a road or, for the state forests, a management trail. Ants were missing from some parts of the transects. Samples were stored in ethanol. This procedure was adopted to improve estimation of population genetic parameters by reducing multiple sampling from single nests. Multiple samp-ling from a single colony might still occur if it were polydomous and its nests were highly dispersed.
2.3. Molecular methods
Individual ants were fully rehydrated in distilled water and their gasters removed
before DNA extraction using the Rapidgene Genomic DNA puri"cation kit (Amresco
USA). Five microsatellite primer pairs developed for other Camponotus species
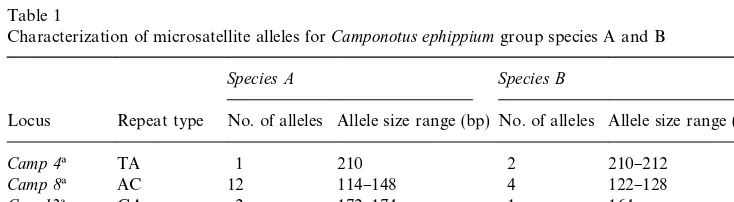
(Gertsch et al., 1995:Camp4 andCamp8; Crozier et al., 1999:Ccon12,Ccon70 and
Ccon79) readily generated PCR products (see Table 1).
PCR was performed under the following conditions: 5 min at 963C, 1 min at 563C,
1 min at 723C (1 cycle), followed by 1 min at 943C, 1 min at 563C, 1 min at 723C (34
cycles) and"nally 1 min at 943C, 1 min at 563C, 5 min at 723C. PCR reaction mixtures
(25ll) contained 25}200 ng of genomic DNA, dCTP, dGTP and dTTP at 200lM,
dATP at 10lM, 25 pmoles of primer, 1.5 mM MgCl
2, 1lCi ofa33P-dATP (1500 Ci
mmol~1, Bresatec Australia), 1]reaction bu!er and 0.5 U of Thermostable DNA
polymerase fromThermus &icelandicus' (Advanced Biotechnologies, UK). Each
reac-tion was covered with 50ll mineral oil. PCR products (excluding oil overlay) were
mixed with 7ll of Stop solution (United States Biochemical), heated to 943C for 2 min
and immersed in ice water before application to a sequencing gel (6% 19 : 1
acrylam-ide:bis-acrylamide, 7 M urea). Electrophoretic runs using 1]TBE bu!er (89 mM
Tris-HCl pH 8.3, 89 mM boric acid, 5 mM EDTA) lasted from 1.5 to 3.5 h according to the size of the microsatellites. At least three reference microsatellites were included
in every run. After vacuum-drying, the gel was used to expose X-ray"lm for at least
16 h. Microsatellite size and sequence were determined from non-radioactive PCR products of known homozygotes. For sequencing using dye terminator technology on
a PE 377, products were cleaned using the QIAQUICK PCR puri"cation kit (Qiagen,
Germany).
Allelic size estimates were based on the relative mobility of sequenced alleles and/or
microsatellite ladders. ForCcon79, sizes could only be roughly estimated from the
sequenced alleles as bands at this locus did not produce a ladder-like pattern.
Generally, (but see the`Resultsasection below), alleles were designated alphabetically
in order of decreasing mobility, with the most anodal being designated A.
Estimates of genetic variability were obtained using the BIOSYS 1.7 program
(Swo!ord and Selander, 1989). Clustering based on Nei's unbiased genetic distance
Table 1
Characterization of microsatellite alleles forCamponotus ephippiumgroup species A and B
Species A Species B
Locus Repeat type No. of alleles Allele size range (bp) No. of alleles Allele size range (bp)
Camp 4! TA 1 210 2 210}212
Camp 8! AC 12 114}148 4 122}128
Ccon12! GA 2 172}174 1 164
Ccon70" GA 23 175}227 19 166}246
Ccon79" GA 9 310}350 2 304}306
!Primers were developed by Gertsch et al. (1995) forC. ligniperdaandC. herculeanus. "Primers were developed by Crozier et al. (1999) forC. consobrinus.
and population structure statistics using Weir's (1990) approach were estimated with
GDAWIN version d10 (Lewis, 1996) which incorporates the analytical approach of Weir (1990). Mantel tests of the correlation between genetic distance and the geographic
separation of sample sites were based on the Spearman rank correlation coe$cient and
used GENEPOP (Raymond and Rousset, 1995) with 1000 permutations.
3. Results
The absence of many heterozygote classes for each of the loci suggests that two
genetic species were present in ourCamponotus ephippiumsamples (Table 1). These
taxa were not distinguished morphologically in the"eld or in previous collections.
However, the two taxa could usually be distinguished by size with the bene"t of the
hindsight provided by genetic criteria. The species were designated as`Aaand`Ba.
Ants could de"nitely be assigned to species A or species B according to their
phenotypes atCcon12, Ccon79 and Ccon70, as none were heterozygous at any of
these loci for alleles from each of the two taxa. Except forCcon70, all alleles from both
species were included in the nomenclatural ordering for each locus. The alleles present
in species A are detailed in Table 2 and those present in species B in Table 3. ForCcon
70, alleles with apparently similar fragment sizes had di!erent numbers of
dinucleot-ide repeats. For this locus, alleles were designated according to ordering within species, with upper case letters in species A and lower case in species B.
Microsatellite sequences (GENBANK Accession numbers (AF062568-AF0625582)
were highly conserved within and between species for Ccon12, with only one base
substitution apart from the number of dinucleotide repeats.Camp4,Camp8,Ccon70
andCcon79 sequences were conserved within species, but di!ered between them. At
Camp4, base changes between species occurred in eight positions. AtCamp8, indels
were observed at two positions. At Ccon79, species B had a large deletion in the
microsatellite repeat region. Complete sequences forCcon70 from species B have not
been obtained but a part sequence of allele D of species A (215 bp) has 40 GA repeats while allele i of species B (216 bp) had only 32.
Table 2
Measures of variability for each site sample ofCamponotus ephippiumgroup species A. Alleles found in a sample are indicated for each locus exceptCamp4which was"xed for allele B in species A. Alleles that were found only in a single sample are indicated in bold letters. Standard errors are given in parentheses
Population Mean sample size per locus
Mean no. of alleles per locus
Ccon12 Camp8 Ccon79 Ccon70 Mean heterozygosity
Observed Expected
Sites
Manna 8.6 (0.4) 3.6 (1.2) AB HJL DFGH DGHJKMQT 0.543 (0.17) 0.514(0.14) Euglo South 11.8 (0.2) 3.6 (1.6) AB MHK CG ABEFGMNQRS 0.356 (0.13) 0.385 (0.14) Nerang Cowal 12.0 (0) 4.4 (1.5) B ABDEGH ACDFG EILMOPRSW 0.233 (0.12) 0.423 (0.18) Lake View 10.0 (0) 2.0 (0.4) B BLH BH GJL 0.540 (0.23) 0.367 (0.15) Corringle 11.0 (0) 3.6 (1.2) AB HML ACFG JKMORSTU 0.364 (0.16) 0.448 (0.16) Road 1 8.6 (0.2) 2.2 (0.6) B HM DFG IMPT 0.172 (0.09) 0.246 (0.14) Road 2 4.0 (0) 3.0 (0.9) B CDH CEDG FHQSUW 0.300 (0.15) 0.400 (0.18) Road 3 9.2 (0.4) 4.2 (1.2) AB EHJLM CDEGHI BCDHQR 0.488 (0.20) 0.577 (0.16) Road 4 10.8 (0.2) 4.6 (1.3) AB CFHK ACDEGH KMNRSP 0.425 (0.17) 0.464 (0.18) Road 5 6.0 (0.4) 2.6 (0.8) AB H CEGH LOSTV 0.425 (0.23) 0.353 (0.19)
Total 92.0 (0.9) 9.4 (4.0) 0.385 (0.14) 0.499 (0.17)
Table 3
Measures of variability for each site sample ofCamponotus ephippiumgroup species B. Alleles found in a sample are indicated for each locus exceptCcon12that was"xed for allele C in species B. Alleles that were found only in a single sample are indicated in bold letters. Standard errors are given in parentheses
Population Mean sample size per locus
Mean no. of alleles per locus
Camp4 Camp8 Ccon79 Ccon70 Mean heterozygosity
Observed Expected
Sites
Weelah 11.8 (0.2) 3.8 (1.6) AB IJKL JK bcdehijkqr 0.415 (0.18) 0.439 (0.16)
Manna 3.0 (0) 2.4 (0.7) AB IJKL K acin 0.333 (0.18) 0.413 (0.20)
Total 37.8 (0.6) 5.6 (3.4) 0.363 (0.13) 0.390 (0.16)
Table 4
Levels of di!erentiation inCamponotus ephippiumgroup species A and B. The parametersf,Fand/P(Weir, 1990) are analogous to Wright'sF
is,FitandFst, respectively. Ranges in brackets are the con"dence limits
from 999 bootstrap pseudosample replicates using GDAWIN (Lewis, 1996). Estimates of gene#ow are calculated from the relationNm+(1//P}1)/4
Species f F /P Nm
A 0.094 0.243 0.164 1.27
[0.049}0.180] [0.217}0.330] [0.131}0.200]
B !0.130 0.140 0.239 0.80
[!0.455}0.057] [!0.074}0.236] [0.176}0.317]
Microsatellite genotypes for all scored individuals are available from the"rst or
second authors. Statistical analyses for species B were limited due to its low sample size at a number of sites. The mean number of alleles per locus (APL) within samples ranged from 2.0 to 4.6 for species A (Table 2) and from 1.4 (in the two singleton samples) to 3.8 in species B (Table 3).
At each highly polymorphic locus in species A, some alleles, such as allele H at
Camp 8, allele G at Ccon 79 and allele M at Ccon 70, were found in almost all
sites. Other alleles were restricted to particular sites (Table 2). Variation among
sites for species B was mostly observed atCcon70. Except for allele i, found in"ve of
seven sites, there was very little similarity of allelic pro"les between sites. In total,
there are eight alleles from a total of 47 in species A which are found in only one
sample and 15 of 28 in species B including 14 of 19 at Ccon70. In species B, this
may be partly an artefact of low sample numbers. Notably, however, both singleton
samples in this species (Corringle and Lake View) haveCcon70 alleles that are seen
nowhere else.
The percentage of variation, considered as the number of alleles, included in a selection of populations was calculated for orderings of population addition based on observed heterozygosity, sample size and position on a north-to-south transect. For instance, the order of addition of populations by heterozygosity in species B was Weelah SF, Manna SF, Lake View SF, Corringle SF, Roads 3, 2 and 6.
With only one population, 18 of 27 ("67%) of alleles in species B were included.
The addition of subsequent populations gives 74, 78, 81, 88, 96 and 100% of alleles. For heterozygosity in species A, the accumulation percentages are: 49, 57, 72, 77, 91,
94, 96, 98, 100 and 100. For the north}south transect in species A the percentages are:
30, 53, 68, 77, 81, 85, 94, 94, 96 and 100. For the transect in species B, the percentages are: 30, 74, 81, 89, 93, 96 and 100. For sample size in species A, the percentages are 46, 65, 76, 85, 87, 98, 98, 98, 100 and 100 and in species B, these are: 30, 70, 78, 85, 93, 96 and 100.
s2tests of heterogeneity suggest that the geographic distribution of genotypes is
signi"cantly non-random for all loci in species A (P"0.046 forCamp4,P(0.005 for
the others). This was also the case for all loci exceptCcon12, where the test was not
possible, in species B (P(0.005 for all).
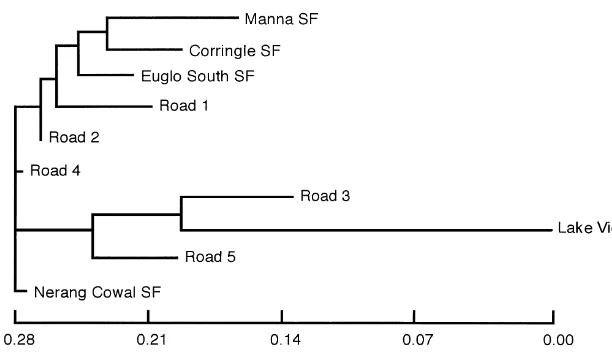
Fig. 2. Neighbor-joining tree of populations ofC. ephippiumspecies A based on Nei's unbiased genetic distance.
Measures of di!erentiation using population structure statistics are shown for
species A and B in Table 4 (for species B, the singleton samples Lake View and
Corringle SFs were omitted from calculations). The values of /P (analogous to
Wright'sF
ST) for species A (0.164) and B (0.239) indicate signi"cant genetic di!
erenti-ation within the total populerenti-ation of each species. Estimating migrerenti-ation rates by the
formulaNm+(1//P}1)/4, gives values of 1.27 for species A and 0.80 for species B.
GENEPOP was used for the private alleles method of migration rate estimation
corrected for sample size Barton and Slatkin, 1986).Nmestimated from this approach
is 0.99 in species A and 0.33 in species B.
Neighbor-joining phenograms based on Nei's unbiased genetic distance
(Fig. 2*for species A, species B not illustrated) show some groupings of proximal
populations (e.g. Manna and Weelah SFs in species B), but most clusters have little apparent relationship to geography. We conducted Mantel tests of the correlation of
genetic di!erentiation, measured asF
ST/(1!FST) and the natural logarithmic
trans-formation of geographic distance. Under the null hypothesis of no association be-tween the matrices, the probability of observing a correlation greater than that actually seen is 0.28 for species A and 0.56 for species B.
4. Discussion
The microsatellite data are unequivocal that there are two species of ants in our
study sample of Camponotus ephippium.This is not surprising as the taxon is known to
studies. The species have no alleles in common at three loci. One of these is highly variable in both species and one is highly variable in one of the species. Although the use of microsatellites for systematic purposes has been suggested (Chapuisat,
1996; Crozier et al., 1999), the "eld remains relatively neglected as it is usually
supposed (e.g. Bruford et al., 1996) that the high mutability of microsatellite loci would
obscure interspeci"c di!erences.
Neither species A nor B is genetically homogeneous over the sampled region. Gene
#ow within the species is low, with the higher estimates ofNmof 1.27 (for species A)
and 0.8 (for species B) being at the lower bound of values required for population
homogenisation (Slatkin, 1987, 1994). Non-signi"cant Mantel tests of the correlation
of genetic di!erentiation and geographic distance suggest, however, that isolation by
distance is not playing a predominant role in causing this heterogeneity in either species.
The sampling design of the present survey was intended to study a di!erent
spatial scale to the microgeographic, colony-level di!erentiation that is often
observed in polygynous ant species (Chapuisat et al., 1997). With this design, a proportion of colonies could, theoretically, be represented by more than one individual. Even highly polydomous species have nest aggregations generally separ-ated by less than 10 m (Seppa and Pamilo, 1995; Pedersen and Boomsma, 1999). Examples of larger aggregations are known, however, and in one extreme instance,
a `supercolonya of the ant Formica paralugubris has a linear extent of 0.7 km
(Chapuisat et al., 1997). The e!ects of scoring multiple individuals from a colony
might reduce estimates of gene #ow or intrapopulation variability but would not
signi"cantly alter our general conclusions that there is regional heterogeneity in allelic
frequencies.
Accumulation percentages suggest that almost all alleles that would be discovered by extensive sampling are already found in our samples. A corollary is that the samples contain most alleles that would have been present had there been no habitat loss or fragmentation. Apparently, population sizes within fragments have been
su$cient to prevent major losses of variation due to inbreeding. We do not, however,
have baseline data that would permit estimation of the loss of variation within individual populations. The overall heterogeneity of allelic frequencies in both species and the geographically restricted range of many alleles has implications for the design of reserves for invertebrate conservation. In no tested ordering of the samples for allele accumulation for either species would it be possible to represent more than three quarters of the genetic variation without reservation of three or more sites. Conse-quently, multiple reserves would be required for any comprehensive attempt to conserve genetic diversity at the regional level.
Acknowledgements
We gratefully acknowledge the assistance of Derek Smith and Rebecca Harris in collecting the ants and Greg Gowing for preparing Fig. 1. Steve Shattuck of
CSIRO Division of Entomology, Canberra, did species group identi"cation of the
samples. Ross Crozier kindly provided microsatellite primer sequences prior to publication and commented on an earlier version of the manuscript. We also thank the State Forests of New South Wales for allowing us to conduct research on their estate. This project was funded by the Centre for Biodiversity and Conservation Research.
References
Andersen, A.N., 1990. The use of ant communities to evaluate change in Australian terrestrial ecosystem: a review and a recipe. Proc. Ecol. Soc. Aust. 16, 347}357.
Barton, N.H., Slatkin, M., 1986. A quasi-equilibrium theory of the distribution of rare alleles in a subdivided population. Heredity 56, 409}415.
Bestelmeyer, B.T., Wiens, J.A., 1996. The e!ects of land use on the structure of ground-foraging ant communities in the Argentine Chaco. Ecol. Appl. 6, 1225}1240.
Bruford, M.W., Cheesman, D.J., Coote, T., Green, H.A.A., Haines, S.A., O'Ryan, C., Williams, T.R., 1996. Microsatellites and their application to conservation genetics. In: Smith, T.B., Wayne, R.K. (Eds.), Molecular Genetic Approaches to Conservation. Oxford University Press, New York, pp. 278}297.
Chapuisat, M., 1996. Characterization of microsatellite loci inFormica lugubris Band their variability in other ant species. Mol. Ecol. 5, 599}601.
Chapuisat, M., Goudet, J., Keller, L., 1997. Microsatellites reveal high population viscosity and limited dispersal in the antFormica paralugubris. Evolution 51, 475}482.
Crozier, Y.C., Kaufmann, B., Carew, M.E., Johnson, R.N., Fraser, V., Oldroyd, B.P., Crozier, R.H., 1999. Polymorphism, mutability, and cross-generic utility of microsatellites developed for the antCamponotus consobrinus. Mol. Ecol. 8, 271}276.
Forman, T.T., 1995. Land Mosaics: the Ecology of Landscapes and Rregions. Cambridge University Press, Cambridge.
Gertsch, P., Pamilo, P., Varvio, S.-L., 1995. Microsatellites reveal high genetic diversity within colonies of
Camponotusants. Mol. Ecol. 4, 257}260.
Lewis, P., 1996. Genetic Data Analysis, version d10. University of Mexico, Albuquerque (http://chee.unm.edu/gda/.)
Major, R.E., Smith, D., Cassis, G., Gray, M., Colgan, D.J., 1999. Are roadside strips important reservoirs of invertebrate diversity? A comparison of the ant and beetle faunas of roadside strips and large remnant woodlands. Aust. J. Zool. 47, 611}624.
Pamilo, P., Gertsch, P., Thoren, P., Seppa, P., 1997. Molecular population genetics of social insects. Ann. Rev. Ecol. Syst. 28, 1}25.
Pedersen, J.S., Boomsma, J.J., 1999. Genetic analysis of colony structure in polydomous and polygynous ant populations. Biol. J. Linn. Soc. 66, 115}144.
Raymond, M., Rousset, F., 1995. GENEPOP (version 1.2): population genetics software for exact tests and ecumenicism. J. Hered. 86, 248}249.
Ross, K.G., Krieger, M.J.B., Shoemaker, D.D.W., Vargo, E.L., Keller, L., 1997. Hierarchical analysis of genetic structure in native ant populations: results from three classes of molecular markers. Genetics 147, 643}655.
Seppa, P., Pamilo, P., 1995. Gene#ow and population viscosity inMyrmicaants. Heredity 74, 200}209. Setterle, J., Margules, C., Poschlod, P., Henle, K. (Eds.), 1996. Species Survival in Fragmented Landscapes.
Kluwer Academic Publishing, Amsterdam.
Sivertsen, D., Metcalfe, L., 1995. Natural vegetation of the southern wheat-belt (Forbes and Cargelligo 1:250 000 map sheets). Cunninghamia 4, 103}128.
Slatkin, M., 1987. Gene#ow and the geographic structure of natural populations. Science 236, 787}792. Slatkin, M., 1994. Gene#ow and population structure. In: Real, L.A. (Ed.), Ecological Genetics. Princeton
University Press, Princeton, NJ, pp. 3}17.
SundstroKm, L., 1993. Genetic population structure and sociogenetic organisation inFormica truncorum
(Hymenoptera; Formicidae). Behav. Ecol. Sociobiol. 33, 345}354.
Swo!ord, D. L., Selander, R. B., 1989. BIOSYS-1: a computer program for the analysis of allelic variation in population genetics and biochemical systematics. Release 1.7. Illinois Natural History Survey, Cham-paign, USA.
Tay, W.T., Cook, J.M., Rowe, D.J., Crozier, R.H., 1997. Migration between nests in the Australian arid-zone antRhytidoponerasp.12revealed by DGGE analyses of mitochondrial DNA. Molec. Ecol. 6, 403}411. Weir, B.S., 1990. Genetic Data Analysis. Sinauer Associates, Sunderland.