www.elsevier.comrlocateratmos
Relationships between air mass properties and
mesoscale rainfall in New Zealand’s Southern Alps
D.S. Wratt
b,), M.J. Revell
b, M.R. Sinclair
b, W.R. Gray
b,
R.D. Henderson
c, A.M. Chater
aa
Canterbury Regional Council, Timaru, New Zealand
b
National Institute of Water and Atmospheric Research, Wellington, New Zealand
c
National Institute of Water and Atmospheric Research, Christchurch, New Zealand
Received 18 June 1999; received in revised form 12 October 1999; accepted 12 October 1999
Abstract
This paper identifies relationships between air mass properties and mesoscale rainfall when moist air blows over New Zealand’s Southern Alps from the Tasman Sea. Around 50% of the variance in six-hourly rain volumes summed across three separate cross-mountain raingauge transects and in six-hourly rain volume spilling across the alpine divide are statistically explained by the following properties of the approaching air mass: relative humidity, wind velocity normal to the mountains, air mass stability and synoptically induced upward motion. These factors also
Ž .
explain about 25% rf0.5 of the variance in the downwind distance reached by the spillover rainfall. For the highest 10% of six-hourly rainfalls, spillover distance and magnitude are negatively correlated with the 700 or 500 hPa temperature. Multiple linear regression equations suitable for predicting rainfall intensity and spillover are developed. A progression is described in the magnitude and depth of vertical motion and resulting condensation rates over the mountains as the properties of the incoming air mass evolve through a storm. These changes, together with greater downwind advection of ice particles compared to raindrops, explain the observed statistical relationships between the air mass properties and mountain rainfall.q2000 Elsevier Science B.V.
All rights reserved.
Keywords: Air mass; Rainfall intensity; Rainfall spillover; Rain gauge transects; Orographic rainfall
)Corresponding author. National Institute of Water and Atmospheric Research, Wellington, New Zealand.
Fax:q64-4-386-2153.
Ž .
E-mail address: [email protected] D.S. Wratt
0169-8095r00r$ - see front matterq2000 Elsevier Science B.V. All rights reserved. Ž .
Hills where precipitation processes have been extensively studied by British
meteorolo-Ž .
gists e.g., Browning et al., 1974 and the major mountain chains of North America
Že.g., Marwitz, 1980 , the Andes and the Himalayas. The Southern Alps lie at similar.
latitudes to the European Alps and the Pyrenees. However, unlike both of those mountain chains, they are relatively isolated in a large region of the ocean. In addition, they have a more two-dimensional structure than the European Alps. Thus, they provide an excellent laboratory for studying orographic precipitation processes. SALPEX pro-cess studies and validations of high resolution models over the Southern Alps contribute to the general need for research to improve quantitative precipitation forecasts in
Ž .
mountainous areas Smith et al., 1997 .
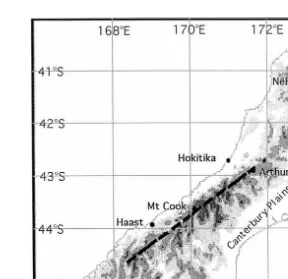
The Southern Alps and associated ranges form an 800-km long SW–NE oriented
Ž .
barrier to the predominantly westerly flow over New Zealand’s South Island Fig. 1 .
Ž .
Many peaks exceed 2500 m in altitude and the highest Mount Cook has an elevation of 3754 m. In the central part of the South Island, the main alpine divide is within 40 km of the west coast, and a substantial plain occurs to the east of the mountains. Further north and south, the mountains extend across more of the island.
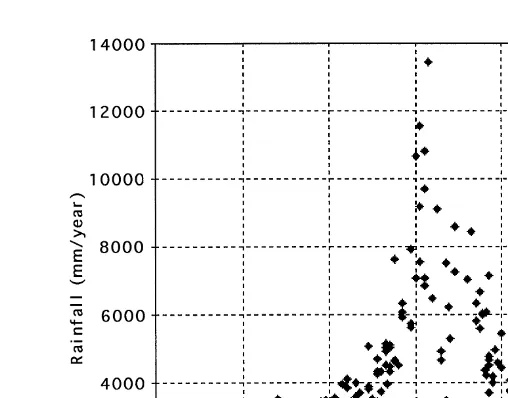
Ž
The distribution of mean annual rainfall across the Alps is well documented e.g.,
.
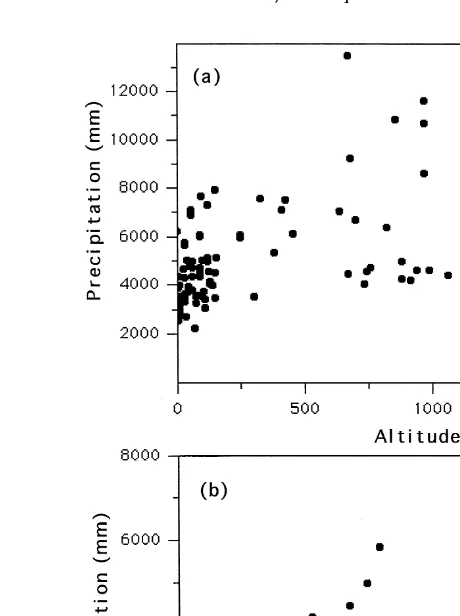
Chinn, 1979; Griffiths and McSaveney, 1983; Henderson, 1993; Wratt et al., 1996 . Fig. 2 summarizes data from all available automatic and daily measurement sites along the full length of the Southern Alps. It demonstrates that the distance away from the main divide is a strong determinant of mean annual rainfall, which rises from 2–3 m on the western coastal plain to 11–12 m about 20 km upwind of the main alpine divide, then drops below 500 mm in the eastern downwind plains. Fig. 3 plots mean annual rainfall vs. altitude, separately for stations northwest and southeast of the main alpine divide. Altitude has been used elsewhere in the world to characterize orographic precipitation
Ž .
enhancement e.g., Lauscher, 1976 . However, Fig. 3 shows that in the Southern Alps
1
Ž .
Fig. 1. South Island topography. The dashed line is the base from which the distances in Fig. 2 are measured.
rainfall does not correlate strongly with the altitude in the immediate vicinity of the raingauge.
The factors influencing precipitation intensity and distribution within individual storms, and particularly spillover of precipitation across the main alpine divide, are still
Ž .
incompletely understood. Hill 1961 concluded: It is necessary to have a disturbance in the flow to bring about an eastwards spread of the rain and even so the occurrence of rain on the plains appears to be rather fortuitous and difficult to associate with any of the normal parameters such as the structure of the wind field or the static stability or the humidity of the air.
Improved quantitative forecasts of spillover of heavy precipitation across the main divide during northwesterly storms are highly desirable, since this spillover is the main source of water for New Zealand’s South Island hydroelectricity watersheds. More data are now available than when Hill undertook his 1961 study, including several years of data from cross-alpine transects of automated raingauges. As no routine atmospheric thermodynamic soundings are made immediately west of the mountains, upwind condi-tions are inferred for this study from operational global analyses made by forecasting
Ž .
centers such as the European Center for Medium-Range Weather Forecasts ECMWF . These analyses use available upper air soundings and satellite temperature retrievals
Fig. 2. Cross-alpine pattern of mean annual rainfall. The horizontal axis shows distance normal to the dashed line in Fig. 1, which approximately marks the main alpine divide. Data points represent individual automatic
Ž .
and manual daily raingauges.
Ž .
As part of the SALPEX Mountain Meteorology project Wratt et al., 1996 we have
Ž
revisited the issues of precipitation intensity and spillover. A pilot study Sinclair et al.,
.
1997 related the time variation of cross-alpine spillover within one northwesterly storm
Ž .
to airflow characteristics. Then Chater and Sturman 1998 examined spillover into the Waimakariri catchment at the northern end of the Alps, for 6 months in 1994. In this paper, we extend these studies to include a large number of storms spanning all seasons over a broader geographical region. We utilized 5 years of rainfall observations from three cross-alpine transects in the northern, central and southern parts of the Alps, together with meteorological information from ECMWF analyses.
1.1. Southern Alps weather
The Southern Alps lie within the northern periphery of the mid-latitude Southern
Hemisphere westerlies. Migrating anticyclones, typically in the 33–408S latitude band,
Ž .
pass eastward at 3–7-day intervals Coulter, 1975; Sinclair, 1996 . Low pressure troughs typically pass over New Zealand between pairs of anticyclones. These troughs extend from low pressure centers that migrate eastward at latitudes south of New Zealand
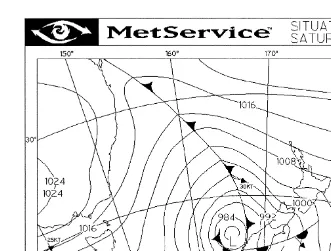
ŽSinclair, 1994a . Meridionally or NW–SE oriented fronts are a common weather.
Ž .
Fig. 3. Mean annual rainfall plotted as a function of height for a stations northwest of the main alpine divide
Ž .
and b stations southeast of the main alpine divide. The same data are used as for Fig. 2.
and showery weather. Fig. 4 shows an example of a pressure analysis for a front approaching the South Island over the Tasman Sea.
1.2. Mountain rainfall processes
Research in Europe and North America on the influence of mountain barriers on precipitation amount and distribution, and on the interaction between mountain barriers and extra-tropical weather systems has been summarized in several book chapters and
Ž
review papers e.g., Smith, 1979; Cotton and Anthes, 1989, Chap. 12; Barry, 1992,
.
Chap. 4 . As air rises over a mountain barrier, it cools bringing the air to saturation, so that after some delay, ice crystals or raindrops form and fall to the ground. The
Ž . Ž
condensation rate c for saturated air subject to orographic lifting is given by Barry,
.
1992 :
Ers
cs y
H
rw d zŽ .
1Ez
Ž .
Fig. 4. A pressure analysis reduced to mean sea level showing northwesterly flow across the Alps in the
Ž .
warm sector ahead of an approaching cold front courtesy of the Meteorological Service of New Zealand .
where r is saturation mixing ratio and w is vertical velocity. To first order, the verticals
velocity induced by flow over the terrain is:
Eh Eh
wsvP=hsu qÕ
Ž .
2Ex Ey
Ž .
where h is the terrain height, and vs u,Õ is the velocity in the horizontal plane of the
air just upwind of the mountains. Thus, one would expect stronger cross-mountain winds
Ž .
to lead to more precipitation, since they increase the value of vP=h Sinclair, 1994b .
However, there are various complicating factors. Hydrometeors do not fall out immedi-ately upon saturation of the air. In a cumulus cloud, it probably takes about 20 min for
Ž .
droplets to grow to raindrop size by coalescence in clean maritime air Banta, 1990 , or about half as long for snowflakes to form by the Bergeron–Findeisen process when both
Ž .
ice crystals and supercooled drops are present Barry, 1992 . Under some conditions a
Ž .
slowing and deviation of the flow can occur as air approaches the Alps Revell, 1993 , providing extra time for droplet formation and growth. Under suitable conditions, ascent of air over mountains can release potential instability, triggering convective cloud
Ž .
growth and precipitation Smith, 1979 . Such convective instability can occur as a cold front approaches a mountain barrier, because at lower levels the front may be retarded,
Ž
allowing upper level cold air to over-ride the warmer air from ahead of the front Smith,
.
conver-gence in depressions and uplift along fronts before the air reaches the region of mountain-induced upward motion. Orographic uplift may further intensify such rain. Also, precipitation of snow or raindrops from higher levels may seed low cloud which forms due to orographic uplift, leading to further precipitation enhancement through the
Ž .
seeder–feeder process Bergeron, 1965 .
Factors expected to affect precipitation in the Southern Alps can be identified from
Ž .
initial SALPEX studies Sinclair et al., 1997; Chater and Sturman, 1998 , the experience
Ž .
of New Zealand weather forecasters M. Pascoe, personal communication , and the ideas discussed above. These considerations suggest intensity and spatial distribution of rainfall in the Alps are likely to be sensitive to the following characteristics of the air approaching the South Island over the Tasman Sea:
Ø the magnitude of synoptically forced upward motion,
Ø relative humidity and liquid water content,
Ž
Ø wind speed normal to the mountain barrier which carries hydrometeors downwind as
.
well as affecting vertical motion through Eq. 2 ,
Ž .
Ø stability or potential instability ,
Ø strength and orientation of an approaching cold front.
Low freezing levels may also favor downwind spillover, since ice crystals are carried
Ž
much further in the wind than raindrops because of their slower fall speed Collier,
.
1975 . These hypotheses governed our selection of air mass characteristics for use in the regression analyses.
2. Data
2.1. Rainfall data
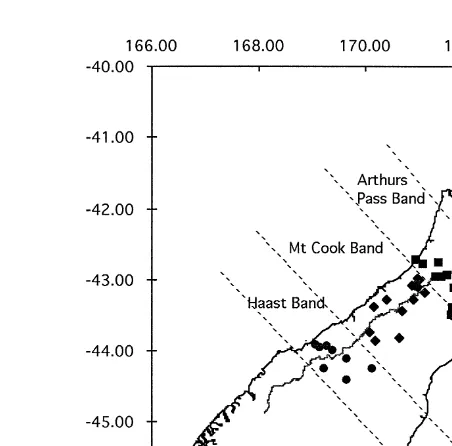
The rainfall data for this study came from 37 recording raingauges in the Southern Alps. The gauge sites were classified into three bands across the mountains as shown in
Ž .
Fig. 5. To obtain the desired long time series 5 years we were constrained to using gauges which had been installed as part of the routine monitoring network of the
Ž .
National Institute of Water and Atmospheric Research NIWA , before SALPEX was designed. Because of access difficulties in the extremely rugged terrain, the gauges do not lie along narrow cross-mountain lines. Most were of the tipping bucket type, with a resolution of 0.5 mm per tip. Some were tilting siphon gauges, with a resolution of about 0.1 mm. The data are stored in the TIDEDA rainfall database maintained by NIWA as
Ž .
an archive of 6-min rainfall accumulations Rogers and Thompson, 1992 .
Fig. 5. Locations of the three cross-alpine raingauge bands. The line down the interior of the island is the location of the alpine divide. Latitude and longitude are shown along the sides of the figure.
study, since this was when the maximum number of cross-alpine stations were operating reliably. We could have increased the number of gauges in our study substantially by
Ž .
also including daily gauges read manually at 9 am, as in Sinclair et al. 1997 . We chose not to do this, because we expected 24-h totals would smooth out the influence of fluctuations in the velocity, moisture and thermodynamic properties of the incoming air that we were studying.
Table 1
Rainfall quantities used in the regression analyses for each band. For a particular band there are assumed to be M rain gauges, with N of these on the western side of the main divide. r is the 6-h accumulated rainfall fromi the ith of these gauges, and di, iq1is the distance between rain gauge i and rain gauge iq1. The first variable is called TOTVOL because it represents the total volume of rain falling on a 1 m wide strip across the mountains in 6 h
Quantity Expression
My1wŽ . x
TOTVOL Ýis1 riqriq1r2 di, iq1
Ny1wŽ . x
WESTVOL Ýis1 riqriq1r2 di, iq1
My1wŽ . x
EASTVOL ÝnsN riqriq1r2 di, iq1
SPILLRAT EASTVOLrTOTVOL
No corrections were attempted for rainfall measurement errors caused by wind field deformation over the gauges which may lead to an underestimate of 5–15% in rainfall
ŽBarry, 1992 , for gauge blockage by snowfall, or for delayed readings as snow melted..
For each of the raingauge bands, we calculated 6-h precipitation accumulations
Ž .
centered at noon and midnight i.e., ending at 0300 and 1500 UTC . Then, for those times for which precipitation was recorded by at least one of the transect gauges, we
Ž .
formed the following quantities defined in Table 1 for each 6-h accumulation:
Ž .
Ø precipitation integrated across the band TOTVOL ;
Ø precipitation integrated over the portion of the band west of the main divide
ŽWESTVOL ;.
Ø precipitation integrated over the portion of the band east of the main divide
ŽEASTVOL ;.
Ž .
Ø spillover ratio SPILLRATsEASTVOLrTOTVOL ;
Ø the furthest distance downwind at which the rainfall is still more that 20% of that at
Ž .
the main divide SPILLDIST .
2.2. Atmospheric data
The atmospheric data used in this study came from routine 0000 UTC and 1200 UTC
ECMWF global analyses on a grid of points separated horizontally by 2.58 in latitude
and longitude. A weighted average of data from appropriate grid points over the South Island was used, as documented in Table 2. The ECMWF grid points are shown in Fig. 6.
Geopotential height, dry bulb temperature, relative humidity, u and Õcomponents of
Ž .
the wind, and v the vertical p-velocity were extracted from the ECMWF data set at
the 500, 700, 850 and 1000 hPa standard pressure levels. The New Zealand upper level measurements available to the ECMWF for preparing these analyses comprised
ra-Ž .
diosonde flights at Invercargill, Paraparaumu and Kaitaia Fig. 6 , and winds from radar-tracked balloons at Hokitika. The extracted data for the points listed in Table 2 will also depend to some extent on upper air soundings from the Australian mainland, because of the physical constraints and synoptic continuity built in to the ECMWF
Ž .
analysis process. The low spatial resolution 2.58 means this ECMWF data set is not
suitable for inferring the detailed characteristics of fronts approaching the mountains. From the ECMWF data discussed above, weighted as shown in Table 2, we calculated several additional characteristics of the incoming air mass summarized in
Table 2
Weights given to ECMWF grid points in the data analyses. The points are shown in Fig. 5
U U U
Ž . Ž . Ž . Ž .
Transect 1 Arthur’s Pass 0.25 5,2q0.25 5,3q0.5 6,3
U U U
Ž . Ž . Ž . Ž .
Transect 2 Mount Cook 0.375 5,2q0.375 5,3q0.25 6,3
U U
Ž . Ž . Ž .
Fig. 6. Location of ECMWF grid points used in this study. Invercargill, Paraparaumu and Kaitaia were the routine radiosonde release sites for this period.
Table 3, including Froude number and vertical gradient of equivalent potential tempera-ture. Decreases in equivalent potential temperature with height indicate potential
insta-Ž .
bility Houze, 1993 , and small values of Froude number indicate the flow is likely to
Ž .
experience significant blocking and deviation by the mountains Barry, 1992 . We used
Ž .
the ECMWF vertical motion v field as an indicator of upward motion in synoptic-scale
weather systems. Negative values of v correspond to ascending motion.
Table 3
Extra air mass characteristics derived from the ECMWF data. Note that in the expression for Froude number, the Brunt–Vaisalla frequency N is calculated using the potential temperatures at 1000 and 850 hPa, and the¨
barrier heights H for the Arthur’s Pass, Mount Cook and Haast transects are 1600, 2400 and 1800 m, respectively
Derived characteristic Height or expression
Wind speed normal to the alpine axis, UN 500, 700, 850, 1000 hPa
Ži.e., wind component from 3158.
Dewpoint 500, 700, 850, 1000 hPa
Equivalent potential temperature 500, 700, 850, 1000 hPa
Precipitable water In air from 1000 to 500 hPa
Ž . Ž .
Dry stability 1000 to 700 hPa T700yT1000r H700yH1000
Ž .
Froude number using 850 hPa normal wind speed, UN, 850 UN,850rNH Equivalent potential temperature difference 1000 to 700 hPa ue,1000yue,700
Equivalent potential temperature difference 850 to 500 hPa ue,850yue,500
< <
()
D.S.
Wratt
et
al.
r
Atmospheric
Research
52
2000
261
–
282
271
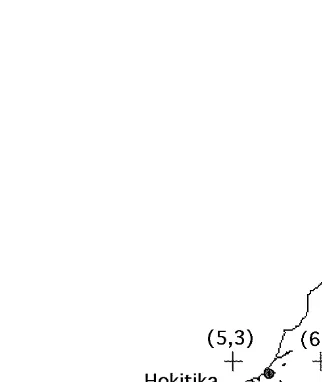
Partial correlations between selected air mass characteristics and values of TOTVOL, EASTVOL, SPILLRAT and SPILLDIST obtained from 6-h rainfall accumulations, for each of the rain gauge bands. Wind deviation is the absolute deviation of the 850 hPa wind direction from 3158. All correlations except those marked by an)would be statistically significant at the 0.001 level if successive rainfall measurements were statistically independent. Constraints: 850 hPa wind from between 2458and 258. For SPILLRAT and SPILLDIST: 700 hPa wind normal to alpine divide UN, 700G5.0 mrs. Note: wind deviationsabsolute deviation of 850 hPa wind direction from 3158
Transect volume Spillover volume Spillover ratio Spillover distance
ŽTOTVOL, cube root. ŽEASTVOL, cube root. ŽSPILLRAT, square root. ŽSPILLDIST, cube root.
Arthur’s Mount Haast Arthur’s Mount Haast Arthur’s Mount Haast Arthur’s Mount Haast
Pass Cook Pass Cook Pass Cook Pass Cook
Number of cases 1088 778 632 1088 778 632 865 626 571 865 626 571
T850 0.19 0.18 0.26 0.16 0.15 0.21 0.04) 0.01) 0.06) y0.02) 0.05) 0.10)
RH700 0.48 0.47 0.40 0.45 0.41 0.39 0.22 0.21 0.32 0.37 0.29 0.34
UN, 700 0.64 0.62 0.63 0.63 0.55 0.59 0.33 0.27 0.35 0.30 0.28 0.38
UN, 500 0.56 0.57 0.51 0.57 0.53 0.49 0.33 0.32 0.31 0.32 0.33 0.37
ue,1000yue,700 0.20 0.20 0.10) 0.22 0.19 0.13 0.19 0.15 0.16 0.20 0.18 0.17
ue,850yue,500 0.22 0.23 0.10) 0.22 0.20 0.14 0.13 0.14 0.21 0.20 0.15 0.22
Froude number 0.56 0.58 0.57 0.55 0.50 0.55 0.22 0.17 0.32 0.20 0.17 0.36
Precipitable water 0.38 0.36 0.39 0.34 0.29 0.34 0.08) 0.13) 0.15 0.11) 0.12) 0.20
Wind deviation y0.32 y0.25 y0.30 y0.28 y0.19 y0.28 y0.01) y0.02) y0.13) y0.01) y0.01) y0.19
Partial correlation coefficients between selected air mass characteristics obtained from the ECMWF data and TOTVOL can be read off Table 4. Note the relatively large positive correlations with relative humidity and normal wind speed at 700 hPa, and with Froude number. There is a moderate positive correlation for precipitable water, and a
moderate negative correlation for v and wind deviation. The atmospheric variables in
Table 4 are not fully independent. When we performed a multiple linear regression
analysis, we found that once the influence of UN,700 and RH700 had been taken account
of, the dependence of the residuals on remaining air mass properties was relatively
small. Once UN,700 and RH700 had been accounted for the remaining factors which gave
Ž
partial correlations of greater than 0.1 with transect integrated rainfalls were ue,850y
. Ž .
ue,500 or in some cases the Froude number, and v850.
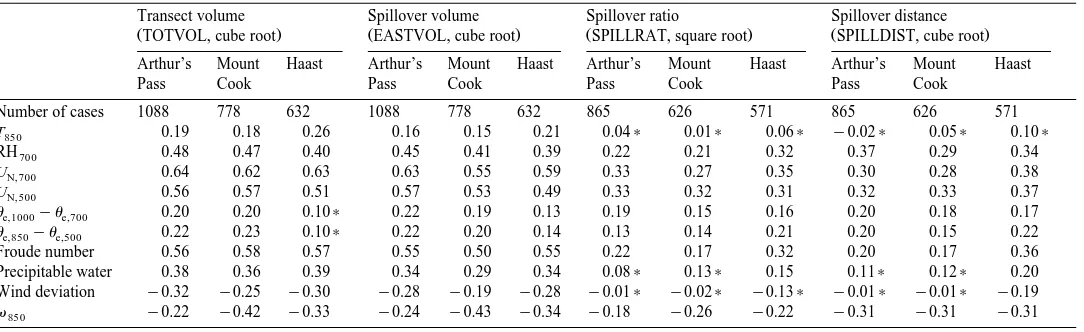
The first data column of Table 5 shows the proportion of the variance of the cube root of TOTVOL explained by multiple regression against air mass properties, for each
Ž .
of the raingauge bands. We used UN,700, RH700, ue,850yue,500 , the Froude number and
v850 as the predictors. These variables were chosen because they gave the highest
Table 5
Proportions of the variance in 6-h precipitation quantities explained by multiple regression against atmospheric variables for flow onto the mountains from the Tasman Sea. The number of cases for each regression is given in brackets. The analyses are restricted to periods when the 850 hPa wind is blowing between 2458and 258. The SPILLRAT and SPILLDIST regressions are also restricted to periods when the 700 hPa wind speed normal to the alpine divide is 5.0 mrs or greater. The SPILLRAT very heavy rain regressions are for the top 10% of TOTVOL values
Arthur’s Pass 55% 1088 53% 1088 15% 865 41% 110 23% 865
Ž . Ž . Ž . Ž . Ž .
Mount Cook 60% 778 50% 778 14% 626 34% 83 19% 626
Ž . Ž . Ž . Ž . Ž .
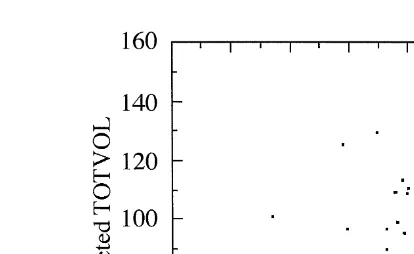
Fig. 7. Cube root of precipitation integrated over the Arthur’s Pass transect: Value predicted by the regression equation in the appendix vs. measured value. The units for TOTVOL are mm=m.
partial correlations in the stepwise regression analysis and generally exhibited
‘‘toler-2 Ž Ž .
ance’’ values greater than 0.7 and p-values less than 0.001. Wilkinson et al. 1992
advised that for stepwise linear regression one should only retain variables with
.
‘‘tolerance’’ values greater than 0.1 and p-values well below 0.05 . As discussed in Section 1.2 of this paper, there are also physical reasons to expect each of these factors to influence rainfall. We conclude that these variables account for about 55% of the variance in the total alpine precipitation during northwesterly winds. The actual regres-sion coefficients are given in Appendix A. Fig. 7 is a scatter plot of TOTVOL values predicted for the Arthur’s Pass transect from the multiple linear regression equation, against the measured value of TOTVOL, for the 1088 cases used in this study.
Ž
When we stratified the data by seasons, we found that the explained variance value
2. Ž . Ž
of r was smallest in summer all transects and highest in winter Mount Cook and
. Ž .
Haast transects or spring Arthur’s Pass transect . However, these seasonal differences were relatively small, with the maximum interseasonal differences between explained variances being 5%, 6% and 14% for the Arthur’s Pass, Mount Cook and Haast transects, respectively.
2
Ž .
Ž
temperature difference and 850 hPa vertical motion. The regression coefficients are
.
given in Appendix A . When we stratified the data by seasons, we found that as with
2 Ž .
TOTVOL, the value of r was smallest in summer all transects and highest in winter
ŽMount Cook and Haast transects or spring Arthur’s Pass transect . The difference. Ž .
between the explained variances for the lowest and the highest seasons were 6%, 12% and 16% for the Arthur’s Pass, Mount Cook and Haast transects, respectively.
3.3. SpilloÕer ratio
Ž .
For these analyses, the spillover ratio SPILLRATsEASTVOLrTOTVOL has
been transformed by taking its square root. We again considered only cases for which
the 850 hPa wind direction was from between 2458 and 258. We added the extra
constraint that wind speed normal to the alpine axis at 700 hPa was at least 5 mrs, to
ensure we were getting significant cross-mountain flow off the Tasman Sea.
Ž .
The partial correlation coefficients for SPILLRAT Table 4 are significantly weaker than those for SPILLVOL and EASTVOL. SPILLRAT is positively correlated with 700
Ž . Ž .
or 500 hPa cross-alpine windspeed rf0.3 , with 700 hPa relative humidity rf0.25 ,
Ž .
and with Froude number rf0.25 . It is negatively correlated with 850 hPa v. With
multiple linear regression we were able to explain only 15% of the observed variance in spillover ratio on the Arthur’s Pass and Mount Cook transects, and 22% of the variance
Ž .
on the Haast transect Table 5 . For the Arthur’s Pass and Mount Cook transects this
2 Ž .
value of r was much lower in summer 0.03–0.05 than for the other seasons
Ž . 2 Ž .
0.2–0.25 . For the Haast transect, r was lowest in summer 0.17 and highest in
Ž .
spring and autumn 0.26 .
Ž
When we restricted this analysis to periods of very heavy rain the top 10% of the
.
TOTVOL values , the air mass properties statistically explained a much higher propor-tion of the SPILLRAT variance: 41% for the Arthur’s Pass transect, 34% for the Mount
Ž .
Žpartial correlations between y0.45 and y0.55 and the freezing level also between. Ž .
y0.45 and y0.55 . For the Haast transect, the highest partial correlation with heavy
Ž .
rainfall spillover ratio was for the 1000 hPa v value q0.43 .
3.4. SpilloÕer distance
Ž
The spillover distance SPILLDIST distance from the alpine divide to the point where
.
the rain is still at least 20% of that at the main divide has been transformed by taking its cube root. As with SPILLRAT, we only considered cases for which the 850 hPa wind
direction was from between 2458and 258and the wind speed normal to the alpine axis
at 700 hPa was at least 5 mrs.
Ž .
The partial correlation coefficients for SPILLDIST Table 4 are significantly weaker than those for SPILLVOL and EASTVOL, and similar to those for SPILLRAT.
Ž .
SPILLDIST is positively correlated with 500 hPa cross-alpine windspeed rf0.35 and
Ž .
with 700 hPa relative humidity rf0.33 . With multiple linear regression we were able
to explain around 25% of the observed variance in spillover distance on the Arthur’s
Ž
Pass and Haast transects, and 20% of the variance on the Mount Cook transect Table
.
5 . As with SPILLRAT there was a significant seasonal variation: air mass conditions explained little of the spillover distance variance in summer, but around 38% of the variance in winter for the Arthur’s Pass and Mount Cook transects, and 38% of the
Ž .
autumn variance for the Haast transect. Table 6 .
Ž
We found that if we restricted our analysis to the highest 10% of the 6-h rainfalls as
.
indicated by TOTVOL , there was little change from Table 5 in the proportion of the SPILLDIST variance statistically explained by air mass properties. However, these high rainfall cases all exhibited a statistically significant negative correlation between 700 or 500 hPa temperature and rainfall spillover distance.
3.5. Storm phase
Finally, we examined how the precipitation intensity, the precipitation distribution, and significant air mass characteristics varied between the beginning and end of a northwesterly storm. For this purpose, we defined a storm as a run of at least three
Ž .
successive non-zero TOTVOL)0 transect integrated 6-h rainfalls, all with wind
direction from between 2458and 258. We then split each storm into five periods of equal
Ž .
length phases , and calculated the average values of TOTVOL, EASTVOL, SPILL-RAT, SPILLDIST and relevant air mass characteristics for each stage.
Table 6
Percentage of the variance in SPILLDIST explained by multiple linear regression against air mass character-istics as a function of season
Season Arthur’s Pass, % Mount Cook, % Haast, %
Summer 11 5 19
Autumn 25 22 38
Winter 36 40 29
Ž .
Fig. 8. Composite values of 700 hPa wind speed normal to the Alps mrs , equivalent potential temperature
Ž . Ž 2.
difference between 1000 and 700 hPa, 850 hPa p-velocity Pars , TOTVOL m , SPILLRAT, and
Ž . Ž
SPILLDIST km for each phase during a northwesterly storm, Arthur’s Pass transect each phase denotes a
.
subsequent fifth of a storm, Section 3.5 .
The resulting graphs for Arthur’s Pass are shown in Fig. 8, which shows that on average across all storms, the transect-integrated precipitation TOTVOL increased from phase 1 to 4, and then decreased for phase 5. However, the spillover ratio and the spillover distance increased right through to phase 5. The wind speed normal to the mountains and the Froude number increased from phase 1 to 4, and then decreased a
Ž .
little to phase 5. The synoptic-scale vertical motion v also decreased in the latter
Ž
stages of the storms, but the potential instability indicated by the equivalent potential
.
temperature difference between 1000 and 700 hPa increased throughout the storm period. This average storm behavior for the Arthur’s Pass transect was also followed on the other two raingauge transects.
4. Discussion
These results from 5 years of storm data for three transects across the Southern Alps
Ž .
show that around 55% rs0.74 of the variance in 6-hourly rain volume summed
Ž .
across each transect, and 50% rs0.71 of the variance in rain volume spilling across
approach-ing air mass: relative humidity at 700 hPa, wind velocity normal to the mountains at 700
Ž
hPa, potential instability as indicated by the equivalent potential temperature difference
.
between 850 and 500 hPa , and synoptically induced upward motion at 850 hPa. These
values of r2are statistically significant at better than the 99.9% level. When we split the
Ž .
data into a 3-year 1990–1992 and a 2-year sub-series, the explained variances were similar for each period, and the individual regression coefficients generally agreed to within about 10%. We therefore conclude that the regressions are stable. The air mass
Ž .
characteristics listed above also explain about 25% rf0.5 of the variance in spillover
distance.
Ž .
This work extends conclusions of Sinclair et al. 1997 who found that periods of maximum spillover within the single prolonged northwesterly storm they studied occurred with high Froude number flow, strong low-level cross-alpine windspeed,
andror weak static stability. Froude number and normal windspeed statistically
ex-plained around 80% of this within storm spillover variability. The lower correlations obtained in our multi-storm analysis reflect differences between storms in properties such as frontal intensity and upper air dynamics, which were not apparent in Sinclair’s pilot analysis and are not fully reflected in our ECMWF grid-point variables. The experience of MetService forecasters suggests strong frontal intensity, which they judge subjectively from the degree of convective cloud activity along the front in satellite
Ž .
imagery, favors spillover M. Pascoe, personal communication . The relationship
be-Ž .
tween upward motion as indicated byyv850 and spillover in Table 4 may be partially
reflecting an influence of frontal intensity. However, twice-daily values at four fixed ECMWF grid points may have often missed the period of maximum vertical motion associated with a front.
Ž .
Our work also shows that the conclusion reached by Chater and Sturman 1998 for the Waimakariri Catchment at the northern end of the Alps, that spillover of rainfall in winter and spring is positively correlated with cross-mountain winds and latent instabil-ity, is generalizable to the whole length of the Southern Alps and to all seasons of the
Ž 2 .
year. Their multiple regressions r f0.8 explained a higher proportion of the spillover
volume and distance variance than ours did, and were improved slightly if they included frontal intensity at Invercargill as a further predictor. Their higher correlations may have
Ž .
occurred because Chater and Sturman 1998 averaged the spillover and meteorological quantities over entire storms, thereby filtering out some of the higher frequency variability inherent in our 6-hourly analyses.
The correlations we found are consistent with the hypotheses outlined in Section 1.2. The observed positive correlation of total and spillover rainfall volume with relative
Ž .
humidity Table 4 occurs because high humidity air is readily saturated by lifting. The positive correlations of total and spillover rainfall with cross-mountain windspeed are
Ž .
expected since stronger winds lead to higher terrain-induced vertical velocities Eq. 2
Ž .
and higher condensation rates Eq. 1 . In addition, stronger cross-mountain winds will blow droplets further downwind before they reach the ground, explaining the observed
Ž
dependence of spillover ratio and distance on wind speed. Other studies Sinclair,
.
Ž .
Fig. 9. Perturbation vertical velocity field after Queney et al, 1960 for linear mountain waves forced by homogeneous flow over an isolated bell-shaped ridge of half-width of 20 km and maximum height of 2 km, at
Ž .
three stages during the approach of a front. Conditions typical of a stable, blocked flow of modest strength
Ž . Ž .
ahead of a front, b stronger pre-frontal flow closer to the front, and c pre-frontal flow adjacent to the front but with effective static stability reduced on account of efficient precipitation processes near the front. The horizontal velocity and Brunt–Vaisala frequency used for each calculation are indicated in the lower left of¨
precipitation processes extending through a greater depth of the atmosphere as stability decreases. Since saturation mixing ratio increases with temperature, the observed positive correlation between rainfall volume and temperature is predicted by Eq. 1. The
observed negative correlation between v and rainfall is consistent with ascent from
synoptic processes leading to increased precipitation. The negative correlations between
Ž . Ž .
atmospheric temperature or freezing level and spillover ratio or distance for the heaviest 10% of the 6-h rainfalls suggest to us that downwind transport of ice particles also plays a significant role. Ice crystals and snowflakes are carried much further by the wind than are raindrops because of their much slower fall speeds. A lower freezing level means ice crystals are subject to downwind transport for a longer time, leading to higher values of spillover ratio and spillover distance.
From our understanding of rainfall processes, and our results on changes with storm
Ž .
phase Section 3.5 , we have developed a conceptual model for precipitation variations as a northwesterly storm crosses the Southern Alps. This can be described with reference to Fig. 9, which shows linear solutions for the vertical velocity in airflow across a
Ž .
mountain geometry characteristic of the Alps using equations from Queney et al. 1960 .
Ž .
In the modest flow well before the arrival of the front, the air is stably stratified Fig. 8 , possibly due to subsidence from the nearby anticyclone. At this stage, the mountains strongly block the incoming air and ascent upwind of the alpine divide will be confined
Ž .
to a shallow layer which slopes upwind with height Fig. 9a . As consequence of the upwind slope and the shallowness of the precipitation layer, precipitation spillover is small at this stage. With the closer approach of the front, the flow onto the Alps
Ž .
increases Fig. 8 with less blocking, leading to a deeper layer of ascent and less upwind
Ž . Ž
slope Fig. 9b . At this stage both precipitation intensity related to vertical velocity and
.
its depth and spillover will increase. Spillover increases because precipitate is being generated through a deeper layer closer to the divide. With the close approach of the
Ž .
front Fig. 9c , precipitation is most intense as result of the frontal dynamics. The
Ž .
enhanced latent heat release results in reduced effective static stability Fig. 8 . At this stage, the ascent upwind of the mountains is at a maximum in depth and intensity, with virtually no upwind slope of the ascent maximum, resulting in substantial spillover. Note also that the increasing potential instability may trigger heavy local convective rainfall in the mountains. The lowering of the freezing level with frontal passage may also lead to increased spillover through enhanced downwind transport of ice crystals as explained above.
The Queney solutions in Fig. 9 are simplified schematics, which assume the Scorer parameter does not vary with height. In nature, detailed vertical and horizontal variations in wind and temperature and non-linear effects will lead to different vertical velocity responses for different storms. Nevertheless, three-dimensional mesoscale model simula-tions currently in progress for SALPEX case studies do exhibit the general progression in vertical velocity patterns illustrated by Fig. 9.
5. Conclusions
rainfall processes and wind-drift effects from detailed microphysical, and radar and environmental data collected during the SALPEX’96 campaign. Finally we will examine the ability of mesoscale models to simulate or parameterize these processes, the resulting precipitation in the Southern Alps, and their sensitivity to the factors identified in this study.
Acknowledgements
We thank Dr. Stephen Thompson for his assistance with the rainfall data sets, the NIWA field teams from Greymouth, Dunedin and Christchurch who collected and quality controlled the rainfall data, and the ECMWF for the use of their gridded meteorological analyses. We also thank Mark Pascoe of the New Zealand Meteorologi-cal Service for his helpful discussions. The research was supported by the New Zealand Foundation for Research, Science and Technology under contract CO1521.
Appendix A
This appendix gives coefficients from the multiple linear regression analyses de-scribed in Sections 3.1–3.4, for which the explained variance is summarized in Table 5.
The units for TOTVOL and EASTVOL are mm=m, SPILLRAT is a dimensionless
ratio, and SPILLDIST is in km. The units for the air mass characteristics are:
Ž .
UN, x x x wind speed normal to alpine axis at xxx hPa : mrs;
Ž . Ž .
RHx x x relative humidity at xxx hPa : decimal units 0.0 to 1.0 ;
Ž .
Tx x x temperature at xxx hPa : K;
Ž .
ue, x x xyue, y y y equivalent potential difference between xxx and yyy hPa : K;
Ž .
vx x x p-velocity at xxx hPa : Pars — a negative value for v denotes upward velocity; and
Arthur’s Pass Group
Precipitate Number Regression coefficients
variable of cases Constant UN, 700 UN,500 RH700 ue,850y ue,1000y Froude v850 ue,500 ue,700 number
0.333
TOTVOL 1088 3.71 2.98 43.5 0.905 y19.2
0.333
EASTVOL 1088 y2.41 2.34 27.8 0.686 y18.8
0.5
SPILLRAT 866 0.240 0.0082 0.148 0.0047 y0.046
0.333
SPILLDIST 866 0.0182 0.0408 1.665 0.0248 y0.653
Mount Cook Group
Precipitate Number Regression coefficients
variable of cases Constant UN, 700 UN,500 RH700 ue,850y ue,1000y Froude v850 ue,500 ue,700 number
0.333
TOTVOL 778 3.66 1.62 28.6 0.726 70.7 y38.1
0.333
EASTVOL 778 y2.48 1.29 15.3 0.396 40.4 y32.6
0.5
SPILLRAT 626 0.121 0.0105 0.127 0.0050 y0.128
0.333
SPILLDIST 626 0.330 0.0445 1.061 0.0290 y0.648
Haast Group
Precipitate Number Regression coefficients
variable of cases Constant UN, 700 UN,500 RH700 ue,850y ue,1000y Froude v850 ue,500 ue,700 number
0.333
TOTVOL 632 y4.95 1.80 33.5 36.8 y14.4
0.333
EASTVOL 632 y13.0 1.49 28.2 34.0 y14.3
0.5
SPILLRAT 571 0.051 0.005 0.374 0.363 y0.036
0.333
SPILLDIST 571 y0.514 0.0203 1.615 0.0267 2.025 y0.417
Ž .
Heavy rain SPILLRAT regressions for top 10% of TOTVOL values Group Number Constraint Regression coefficients for SPILLRAT0.5
of cases Constant T700 T500 v500 v1000 PW RH1000UN,500
Arthur’s Pass 110 TOTVOL 6.71 y0.0233 – 0.097 – 0.0079 – –
)1,000,000
Mount Cook 83 TOTVOL 3.76 –0.0123 – y0.0554 – – – 0.0041
)800,000
Haast 70 TOTVOL 2.16 y0.0068 – 0.1333 – 0.237 0.0042
)700,000
References
Ž .
Banta, R.M., 1990. The role of mountain flows in making clouds. Blumen, W. Ed. , Atmospheric Processes over Complex Terrain. Meteorological Monograph 45, 229–283, American Meteorological Society. Barry, R.G., 1992. Mountain Weather and Climate. 2nd edn. Routledge, 402 pp.
Bergeron, T., 1965. On the low-level redistribution of atmospheric water caused by orography. In: Proc. Int. Conf. Cloud Phys. IAMAPrWMO, Tokyo, Japan, pp. 96–100.
Browning, K.A., Hill, F.F., Pardoe, C.W., 1974. Structure and mechanism of precipitation and the effect of orography in a wintertime warm sector. Q. J. R. Meteorol. Soc. 100, 309–330.
Charba, J.P., Klein, W.H., 1980. Skill in precipitation forecasting in the National Weather Service. Bull. Am. Meteorol. Soc. 61, 1546–1555.
Houze, R.A., 1993. Cloud Dynamics. Academic Press, 570 pp.
Lauscher, F., 1976. Weltweite Typen der Hohenabhangigkeit des Neiderschlags. Wetter Leben 28, 80–90.¨ ¨
Marwitz, J.D., 1980. Winter storms over the San Juan Mountains: Part 1. Dynamical processes. J. Appl. Meteorol. 19, 913–926.
Panofsky, H.A., Brier, G.W., 1968. Some Applications of Statistics to Meteorology. Penn State University, 224 pp.
Queney, P., Corby, G., Gerbier, N., Koschmieder, H., Zierep, J., 1960. The Airflow Over Mountains. World Meteorological Organization, Geneva, Tech. Note 34, 135 pp.
Revell, M.J., 1993. Barrier jets along the Southern Alps of New Zealand, Australia. In: Proc. Fourth Int. Conf. on Southern Hemisphere Meteorology and Oceanography. American Meteorological Society, Hobart, Australia, pp. 128–129.
Rogers, M.W., Thompson, S.M., 1992. In: TIDEDA Reference Manual. 2nd edn. Hydrology Centre Publica-tion 24 NIWA, Christchurch.
Sawyer, J.S., 1956. The physical and dynamical problems of orographic rain. Weather 11, 375–381. Sinclair, M.R., 1994a. An objective cyclone climatology for the Southern Hemisphere. Mon. Weather Rev.
122, 2239–2256.
Sinclair, M.R., 1994b. A diagnostic model for estimating orographic precipitation. J. Appl. Meteorol. 33, 1163–1175.
Sinclair, M.R., 1996. A climatology of anticyclones and blocking for the Southern Hemisphere. Mon. Weather Rev. 124, 245–263.
Sinclair, M.R., Wratt, D.S., Henderson, R., Gray, W.R., 1997. Factors affecting the distribution and spillover of precipitation in the Southern Alps of New Zealand — a case study. J. Appl. Meteorol. 36, 428–442. Smith, R.B., 1979. The influence of mountains on the atmosphere. Adv. Geophys. 21, 87–230.
Smith, R.B., 1982. A differential advection model of orographic rain. Mon. Weather Rev. 110, 306–309. Smith, R.B., Paegle, J., Clark, C., Cotton, W., Durran, D., Forbes, G., Marwitz, J., Mass, C., McGinley, J.,
Pan, H.-L., Ralph, M., 1997. Local and remote effects of mountains on weather: research needs and opportunities. Bull. Am. Meteorol. Soc. 78, 877–892.
Thompson, C.S., Sinclair, M.R., Gray, W.R., 1997. Estimating long-term precipitation in a mountainous region from a diagnostic model. Int. J. Climatol. 17, 997–1007.