AUTOMATIC PADDY RICE MAPPING INTERFACE USING ARCENGINE AND
LANDSAT8 IMAGERY
(CASE STUDY IN NORTH PART OF IRAN)
Sh. Bahramvash Shams1
1Master of Science in Photogrammetry, Tehran, Iran [email protected]
KEY WORDS: Rice Paddy, Mapping, Landsat 8, Remote Sensing, ArcEngine
ABSTRACT:
Recognition of paddy rice boundaries is an essential step for many agricultural processes such as yield estimation, cadastre and water management. In this study, an automatic rice paddy mapping is proposed. The algorithm is based on two temporal images: an initial period of flooding and after harvesting. The proposed method has several steps include: finding flooded pixels and masking unwanted pixels which contain water bodies, clouds, forests, and swamps. In order to achieve final paddy map, indexes such as Normalized Difference Vegetation Index (NDVI) and Land Surface Water Index (LSWI) are used. Validation is performed by rice paddy boundaries, which were drawn by an expert operator in Google maps. Due to this appraisal good agreement (close to 90%) is reached. The algorithm is applied to Gilan province located in the north part of Iran using Landsat 8 date 2013. Automatic Interface is designed based on proposed algorithm using Arc Engine and visual studio. In the Interface, inputs are Landsat bands of two time periods including: red (0.66 μm), blue (0.48 μm), NIR (0.87 μm), and SWIR (2.20 μm), which should be defined by user. The whole process will run automatically and the final result will provide paddy map of desire year.
1. INTRODUSTION
Rice is one of the fundamental foods in the whole world (IRRI, 1993). In Iran rice is the main food and has a massive importance. Therefore, its self-sufficiency is vital. To this end, constant estimating and monitoring of rice production is needed. The basic step in this process is finding paddy locations and then monitoring those area conditions in order to provide proper production and yield management. Besides, owing to especial characteristics of this plant, it grows in the flooded land which cause methane emission and impacts on greenhouse gases (Denier Van Der Gon, 2000; Wassmann et al., 2000). As a result of that, many researches focus on this plant and its characteristics. As mentioned before paddy mapping is prier information for many rice monitoring purposes. Operator base layer using Google maps are so much expensive and require tremendous time, especially considering annual land use change, the whole process needs to be checked. Due to mentioned reasons, from its early appearance, satellite remote sensing became a valuable alternative to detect land cover and its changes (Ehlers et al., 1990; Meaille, 1990 ; Steininger, 1996 ). Also remote sensing is widely used in rice monitoring studies (Kuroso et al., 1997; Oette et al., 2000; Shao et al., 2001). Earlier studies used (Normalized Difference Vegetation Index) NDVI based image classification to distinguish rice paddy from other fields (Fang, 1998; Okamoto and Fukuhara, 1996). Further an index was proposed which was sensitive to soil and leaf water, (Land Surface Water Index) LSWI (Maki et al., 2004; Xiao et al., 2002) and turned out to be so beneficial in rice paddy detection. A combination of two mentioned indexes and (Enhanced Vegetation Index) EVI in entire year are used in an effective algorithm to detect rice paddies (Xiao et al., 2002) and is implemented in china (Xiao et al., 2005). In another valuable study, this method is applied to 13 countries in South and Southeast Asia, using MODIS (Moderate resolution Imaging Spectroradiometer) images (Xiao et al., 2006 ). Similar algorithm is proposed and applied to Egypt rice farms
(Elshorbagy et al., 2013). In a different research, MODIS bands are analysed to find most suitable bands combination for rice paddies detection which declared that combination of bands 2 (0.860 μm) and 19 (0.940 μm) achieved best results (Cheng and Wu, 2011). Also Landsat ETM+ with higher spatial resolution was applied in rice studies (Fang et al., 1998; Nuarsa et al., 2005).
Owing to this, rice paddy detection is the key factor for lots of rice related studies. Most of Iran rice paddies are located in the north part of Iran close to the Caspian Sea coastal. This region is mostly covered by clouds due to Alborz Mountains, so the earlier algorithms which require whole data of entire year, are not Applicable for this region. Hence, in this research, a simple paddy mapping algorithm in median spatial resolution is proposed that only require two temporal images. One of the images must be chosen in the initial period of flooding and another one, after the harvesting. As an automatic rice mapping Interface can optimize time and budgets, an important asset of this research is providing full automatic Interface using ArcEngine that by two Landsat8 images will distinguish rice paddies and provide corresponded paddy map. In following sections proposed method will be described completely.
2. METHOD DISCRIPTION
2.1 Data and Study Area
enhanced and containing more bands lead to more accuracy in interest discrimination (http:\\landsat.usgs.gov).
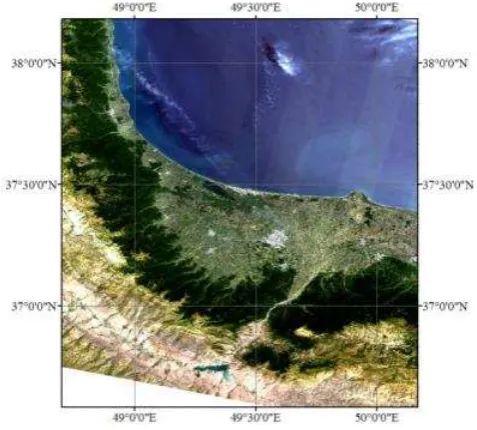
The algorithm is applied to Gilan province of Iran, which is one the main area for rice paddy in this country. This province with 14000 km2 area is covered by varieties of vegetation and farms. As half of these farms are paddies, this area plays an important role in providing rice in Iran. The Detection procedure is a challenging issue because of adjacent vegetation and paddies in this province. Another problematic matter in this case study is cloud coverage domination in most days. This is owing to clouds spreading prevention by Alborz Mountains which surround south and west part of the study area. So it is impossible to implement methods that need whole year data. Hence, in this research, a method is proposed that just require two temporal images with least cloud contamination in critical period of rice growing. This location of the study area is shown in figure 1.
Figure 1. Landsat 8 RGB image of Gilan province in Iran, as research case study. high moisture in harvesting period. Moreover, full automatic paddy mapping Interface will be introduced. Comprehensive description of each steps will be discuss in the following
existence even in sub pixels can cause uncertainties (Xiao et al., 2006 ). Therefore all of the clouds should be excluded from further analysis. In this research bands red (0.66 μm), NIR (0.870 μm), and blue (0.470 μm) are used to gain proper cloud mask. Owing to the higher reflectance of clouds, bands red and NIR more than 0.2 and band blue more than 0.25 was used to ρSWIR2105= reflectance of band SWIR (2.105μm)
This relation is established in previous research and is shown in equation 3 (Xiao et al., 2002; Xiao et al., 2005):
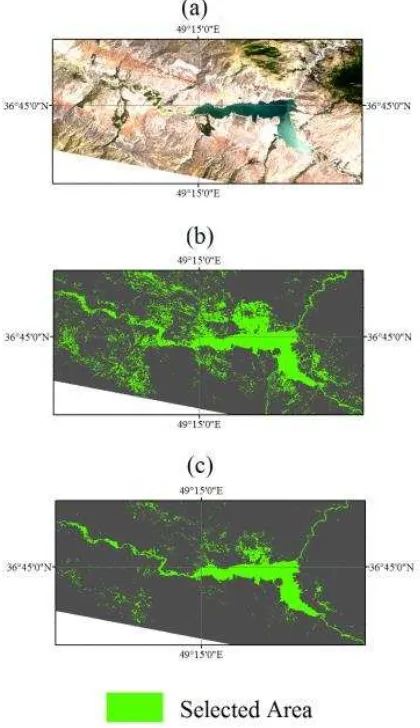
LSWI+Δ>NDVI (3) In South and Southeast Asia the Δ= 0.05 gave best results (Xiao et al., 2006 ), but in our study area this threshold did not achieve proper results so it is adjusted. In figure 2 different Δ results in Manjil sluice are presented.
Figure 3. Applying different Δ value for Manjil sluice in the study area. (a) RGB image. (b) Δ=0. 05. (C) Δ= 0.
As it is obvious from figure 3 that Δequal to 0.05 detected lots noises and had massive uncertainties. Based on trial and error approach best result has been achieved in Δ = 0. So by using equation 3 and mentioned Δ, all high moisture pixels which also contained paddy potential are detected. It must be notice that this process is applied in initial period of flooding that in this case study is May.
2.2.3 Masking unwanted pixels: As mentioned before the
former step detects all high humidity pixels which contain lots of unwanted entities such as water bodies, high moisture forests, and swamps.
Initial masking should eliminate permanent water bodies. This procedure is done based on NDVI<0.05 in the initial period of flooding.
Two other misclassifies are high precipitation evergreen forests and swamps. For omit the first, NDVI>0.65 in period of after harvesting is used. Excluding swamplands are more
challenging, due to their temporary vegetation cover, which made them behave comparable to the paddies. To eliminate these areas we have used equation 3 after harvest period. Best result of swampland elimination is achieved by Δ= -0.4. In figure 4, detection of Anzali swampland in Gilan province is shown with different Δ threshold. As it is observable in figure 4, Δ= -0.3 detect lots of other noise and Δ= -0.5 has under estimations.
Figure 4. Applying different Δ value for Anzali swampland in
Gilan provinces of the survey region. (a) RGB image, (b) Δ= -0.3, (c) Δ= -0.4, (d) Δ= -0.5.
2.3 Resultant paddy
After masking all unwanted pixels the final paddies will be provided. In future section the proposed Interface will be described and the final result will be evaluated due to the operator base border.
2.4 Interface
Figure 5. Paddy Mapping Interface.
Figure 6. Paddy Mapping Interface under progress
3. EVALUATION AND DISCUSSION
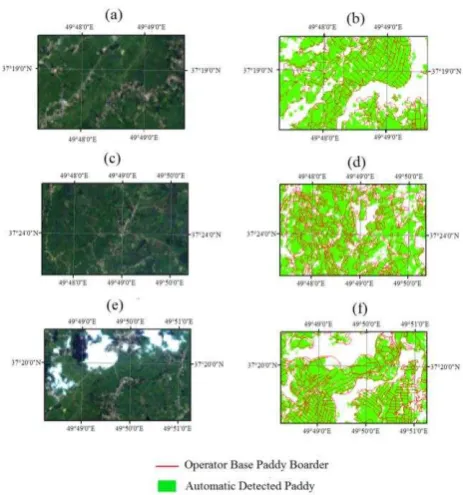
Likewise other paddy detection researches Appraisal of this method is done by operator base layer. The operator had used Google earth maps to distinguish rice paddies. In figure 6 three windows in the study area are represented, in order to compare Interface result and boarder layer. Area of paddies in boundary layer is compared with area of pixel base paddy detection. The comparisons show near to 90% correlation between Interface and operator base layer which are represented in table I. As mentioned before proposed method achieved good results in compare to boundaries Layer. There is another issue about boundaries maps that these layers are so much dependent to their operator’s accuracies and errors. The automatic paddy detection is devoid of human mistakes. However other parameters such as spatial resolution of remotely sensed images and size of farms can influence on automatic paddy detection accuracy. For example due to 30 m * 30 m resolution of Landsat data detection of under 900 m^2 area paddies have uncertainties. Another matter is choosing initial image, as first image should be selected in flooding period which in our case study is May. If some paddies start their implantation so sooner or later than estimated flooding period (more than 15 days), their farm did not contain enough water and algorithm is not able to detect them. In order to overcome this problem, proper knowledge of paddy implantation is required. Having separate time of implantation can be solve by executing program via those implantation time of flooding images, separately and calculate paddies individually.
Figure 7.Comparison of Interface paddy detection and operator
base layer.
Table I_ quantify the comparison of Interface result and operator base paddy layer
4. CONCULUSION
Due to major cloud coverage in north part of Iran and annual change in Land use, in this study an automatic mapping rice paddy is proposed, based on two temporal images: the initial period of flooding and after harvesting. Moreover a fast automatic paddy mapping Interface is proposed. Finding flooded pixels and masking unwanted pixels is basic ideas of this algorithm. Water, cloud, forest, and swamps are mentioned unwanted classes. The process is based on moisture and humidity in comparing to greenness. Parameters such as Normalized Difference Vegetation Index (NDVI) and Land Surface Water Index (LSWI) are used in this methodology. Landsat 8 ETM, 30 m spatial resolution bands include red (0.66 μm), blue (0.48 μm), NIR (0.87 μm), and SWIR (2.20 μm) are used in this algorithm. Automatic Interface is created by ArcEngine 10.1 and visual studio 10, which decrease time and budget considerably. The algorithm applies to Gilan province located in the northern part of Iran. The evaluation is performed due to operator base rice paddy boundaries. Boundary layers were created using Google maps. Due to this appraisal good agreement near to 90% is achieved. Thus the proposed Interface can map paddies in a fast and accurate way successfully.
ACKNOWLEDGEMENTS
This study was funded by Soil Conservation and Watershed Management Research Institute (SCWMRI). The author would
Samples Percentage
Interface result Operator result Paddy
area
Non-paddy
area
Paddy area
Non-paddy
area
1 80% 43
67852 0635233 0000333 6575885
2 89% 74
00243 476533 7600233 475542
3
87% 643
like to thank the Dr. Jalali deputy of research in SCWMRI, and for his helpful advices.
REFERENCES
http:\\www.landsat.usgs, Access On 5.6.2014.
Cheng, Q., and Wu, X., 2011, Mapping paddy rice yield in Zhejiang Province using MODIS spectral index: Turk J Agric, v. 35, p. 579-589.
Denier Van Der Gon, H., 2000, Changes in CH4 emission from rice fields from 1960s to 1990s: 1. Impacts of modern rice technology: Global Biogeochemical Cycles, p. 61– 72.
Ehlers, M., Jadkowski, M. A., Howard, R. R., and Brostuen, D. E., 1990, Application of SPOT data for regional growth analysis and local planning: Photogrammetric Engineering and Remote Sensing, v. 56, p. 175–180. Elshorbagy, A. M., Imam, E., and Nourb, M., 2013, Rice Area
Interannual Variation Through A Remote Sensing Based Mapping Algorithm, ISPRS2013-SSG: Antalya, Turkey, International Archives of the Photogrammetry, Remote Sensing and Spatial Information Sciences.
Fang, H., 1998, Rice crop area estimation of an administrative division in China using remote sensing data: International Journal of Remote Sensing, v. 17, p. 3411– 3419.
Fang, H., Wu, B., Liu, H., and Huang, X., 1998, Using NOAA AVHRR and Landsat TM to estimate rice area year-by-year: International Journal of Remote Sensing, v. 19, p. 521-525.
IRRI, 1993, 1993–1995 IRRI Rice Almanac. Manila7: International Rice Research Institute.
Kuroso, T., Fujita, M., and Chiba, K., 1997, Monitoring of Rice Fields Using Multi-Temporal ERS-1 C-band SAR Data: International Journal of Remote Sensing, v. 14, p. 2953-2965.
Maki, M., Ishiahra, M., and Tamura, M., 2004, Estimation of leaf water status to monitor the risk of forest fires by using remotely sensed data: Remote Sensing of Environment, v. 90, no. 441– 450.
Meaille, R. W., L, 1990 Using geographic information system and satellite imagery within a numerical simulation of regional urban growth: International Journal of Geographic Information Systems, v. 4, p. 445–456. Nuarsa, I. W., Kanno, S., Sugimori, Y., and Nishio, F., 2005,
Spectral Characterization of Rice Field Using Multi-Temporal Landsat ETM+ Data: International Journal of Remote Sensing and Earth Sciences, v. 2, p. 65-71. Oette, D. R., C, W. B., B, M., Maiersperger, T. K., and
Kennedy, R. E., 2000, Land Cover Mapping in Agricultural Setting Using Multiseasonal Thematic Mapper Data: Remote Sensing of Environment, v. 76, p. 139-155.
Okamoto, K., and Fukuhara, M., 1996, Estimation of paddy rice field area using the area ratio of categories in each pixel of Landsat TM: International Journal of Remote Sensing, v. 9, p. 1735– 1749.
Shao, Y., Fan, X., Liu, H., Xiao, J., Ross, S., Brisco, B., Brown, R., and Staples, G., 2001, Rice Monitoring and Production Estimation Using Multitemporal RADARSAT: Journal of Remote Sensing for Environment, v. 76, p. 310–325.
Steininger, M. K., 1996 Tropical secondary forest regrowth in the Amazon: age, area and change estimation with
Thematic Mapper data: International Journal of Remote Sensing, v. 17, p. 9–27.
Wassmann, R., Neue, H. U., Lantin, R. S., Makarim, K., Chareonsilp, N., and Buendia, L. V., et al. , 2000, Characterization of methane emissions from rice fields in Asia: II. Differences among irrigated, rainfed, and deepwater rice. Nutrient Cycling in Agroecosystems, v. 58, p. 13–22.
Xiao, X., Boles, S., Frolking, S., Li, C., Babu, J. Y., Salas, W., and III, B. M., 2006 Mapping paddy rice agriculture in South and Southeast Asia using multi-temporal MODIS images: Remote Sensing of Environment v. 100, p. 95 – 113.
Xiao, X., Boles, S., Frolking, S., Salas, W., Moore, B., Li, C., He, L., and Hao, R., 2002, Observation of flooding and rice transplanting of paddy rice fields at the site to landscape scales in China using VEGETATION sensor data: Remote Sensing of Environment, v. 82, p. 335–348.