GENERATION OF 3D MODEL FOR URBAN AREA USING IKONOS ANDCARTOSAT-1
SATELLITE IMAGERIES WITH RS AND GIS TECHNIQUES
N. R. Rajpriya
a*, Anjana Vyas
b, S. A. Sharma
ca Dept. of Geography, Shri H. K. Arts College, Ashram Road, Ahmedabad-380009, Gujarat State, India. [email protected]
b Prof. and acting dean, Faculty of Technology, CEPT University, Ahmedabad-380009, India. [email protected]
c Senior scientist, Space Application Centre, ISRO, Ahmedabad, India. [email protected]
KEY WORDS: Digital Elevation Model (DEM), Stereo image, Orthoimage, 3D city model.
ABSTRACT: Urban design is a subject that is concerned with the shape, the surface and its physical arrangement of all kinds of urban elements. Although urban design is a practice process and needs much detailed and multi-dimensional description. 3D city models based spatial analysis gives the possibility of solving these problems.Ahmedabad is third fastest growing cities in the world with large amount of development in infrastructure and planning. The fabric of the city is changing and expanding at the same time, which creates need of 3d visualization of the city to develop a sustainable planning for the city. These areas have to be monitored and mapped on a regular basis and satellite remote sensing images provide a valuable and irreplaceable source for urban monitoring. With this, the derivation of structural urban types or the mapping of urban biotopes becomes possible. The present study focused at development of technique for 3D modeling of buildings for urban area analysis and to implement encoding standards prescribed in
‘OGC City GML’ for urban features. An attempt has been to develop a 3D city model with level of details 1 (LOD 1) for part of city of Ahmedabad in State of Gujarat, India.It shows the capability to monitor urbanization in 2D and 3D.
1. INTRODUCTION
1.1 Need of the study: Map visualization is often considered as important as the map content. In community planning, a GIS map is typically used to model reality. While good analysis is important and data quality is a key factor, the most critical matter is the method of communication. When GIS information is presented using appropriate visualization techniques, it can stimulate public participation.
A three-dimensional GIS simulation always communicates more effectively than two-dimensional. With the rapid development of technologies in the recent years, 3D GIS have emerged as a reality. Creation of 3D digital city model using conventional stereo images of aerial photos or satellite images is cumbersome and is a less cost-effective technique for many applications, (Jalli and D, 2007).
1.2 Aim of the study: To describe the integration of geo-informatics techniques with 3D modeling software to develop three-dimensional GIS database which includes reconstruction of buildings and terrain using Cartosat-1 stereo pair PAN data and multispectral high resolution data of IKONOS satellite.
1.3 Study Objectives:
To evaluate and compare different methods of generating 3D city models in a GIS environment. To answer the questions regarding the extent of
reliability, accuracy and time of geo-referenced database.
To generate Digital Elevation Model (DEM) To generate Ortho rectified image.
To carry co-registration of IKONOS and ortho rectified image.
To extract building footprints from satellite data employing visual analysis techniques.
To extract 3D buildings with semi automatic and automatic methods using integrated GIS techniques.
To generate 3D city models using building footprints and the associated heights of the building from DEM.
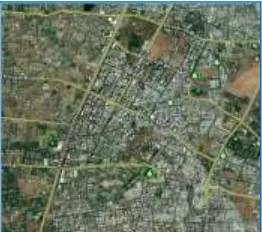
1.4 Area of Interest: A highly crowded built-up area of Ahmedabad city is selected for this study. It covered arround11X11 Sq. Km area of the western Ahmedabad city. The study area includes some parts of the western side of the Ahmedabad city named Bodakdev area, Vastrapur area and Satellite area. Western Ahmedabad has grown faster than eastern Ahmedabad, especially the peripheral areas. Over the years, rapid urbanization has led to spillover of population outside the city limits. This has resulted in intensification of development high rise structures which have been putting tremendous pressure on the infrastructure facilities. The skyline of Ahmedabad city rises with its horizontal expansion.
2. METHODOLOGY
2.1 Methodology: The techniques used in the creation of a 3D GIS city model has been provided by the GIS environment and assisted by a high resolution satellite images used digital photogrammetry and 3D modeling software. The reliable data are prepared from digital photogrammetry and image analysis process using high resolution satellite image, then the data extraction continues to develop GIS database. The method processing is combined with ERDAS LPS 9.2, Arc GIS 9.3.1, Arc Globe 9.3.1, ERDAS Imaging 9.2, iGIS 1.0, eCognition 5.0 and Microsoft Office 2007.
2.2 Data used: The fore and after scenes of Cartosat-1 data is used to generate the Digital Elevation Model in Leica's Photogrammetry Suite. The scenes are provided with Rational Functions Coefficients (RPC). These coefficients are used to specify the geometric model, which defines the internal characteristics (i.e. internal geometry of the camera or sensor while capturing the imagery) and external parameters (i.e. original position and orientation of the camera or sensor). For visual analysis IKONOS high resolution data is used
2.3 Data source: Indian Space Research Organization (ISRO), GCP Library.
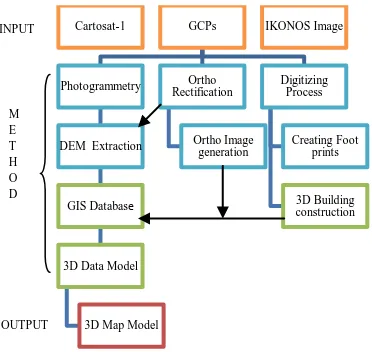
2.4 Study Process: This study involved 4 main working processes. Photogrammetry process, Ortho-rectification process, creating footprint of buildings and Three-dimensional map model.
Chart 1. Methodology Applied for study
Photogrammetry process dealt with the creation of DEMs from Cartosat-1 Satellite stereo images. Ortho-rectification process dealt with the modification of DEM into orthoimage. Point file generation was done for 2D-footprints to give the
building height. The examination of the building’s height and
its other features was done to support the making of three-dimensional footprint. Then, all data was gathered to create three-dimensional map model.
2.5 Flow Chart for the proposed method:
Chart 2. Flowchart
3. PRE-PROCESSING
3.1 Cartosat-1 Image
Figure 2. Cartosat-1 band a and band f
3.2 Preprocessing of raw Imagery: Block model is binary file which contains of processed images, Ground Control Points (GCPs), orientation parameters, image coordinates and projections. The block model is built using the Cartosat-1 Stereo images in LPS S/W. The reference coordinate system assigned as, projection in Geographic Lat/Lon and horizontal units are in degree. Vertical spheroid and datum are in WGS 84. The file is generated as a block file format. To add the frame for Cartosat-1 stereo pair (Banda and Band)
images “Tiff” format is used.The option “pyramid” is used
for large images for faster processing and opening in the Viewer.
Point Measurement is done by applying Classic Point Measurement tool from LPS software package.For the Point
Measurement process controlled ‘z’ value assigned by GCP
library using LPS S/W. With Image matching task 35 reference points generated as Control points. Defined ground control points (GCPs) through GCP library.
To update the Z values for selected ground control points
based on the vertical reference source “Automatic tie point generation method” is used. Automatic tie point collection tools are used to measure the corresponding image positions of tie points on overlapping images.
Aerial triangulation is performed to adjust the exterior orientation parameters and determine the XYZ coordinates of
Cartosat-1 GCPs
the tie points. To add tie points one can calculate different strategy parameters. Like search size, correlation size, least square size, feature point density, coefficient limit and initial accuracy.
4. DIGITAL ELEVATION MODEL
4.1 Creating the Digital Elevation Model (DEM): Automatic Terrain Extraction (ATE) is used to automatically extract digital terrain models (DTMs) from images in a block. DEM Extraction process is done by using “DTM
extrection tool” on the LPS Project Manager toolbar. Source
is taken as ‘Z’ value of the image. DTM cell size is in degree selected for 2.5m resolution and DEM background value as default value.
Figure 3. DEM with 2.5m resolution
4.2 Ortho rectification of cartosat-1 pan data: Criteria used to generate orthoimage are “Bilinear Interpolation
method” and output cell size selected as 2.5m and DEM is used as the source for orthoimage. DEM is a necessary input for the generation of orthoimage, which involves terrain correction. Once a DEM has been generated over a given area using a stereo pair, same could be used for generating Orthoimage. Resempling method is applied to generate Orthorectified image.
Figure 4. Orthoimage with 2.5m resolution
4.3 Co-registration of IKONOS and ortho rectified image of cartosat-1 data
Figure 5. Co-registration
4.4 3D shape file generation
For Point file generation 3D shape file is selected as the output type, and the output prefix is come in the dem_point_shp format. Cell size is selected in meters.
Figure 6. Point file
5. EXTRACTING BUILDING FOOTPRINTS-SEMI AUTOMATIC METHOD
5.1 Extracting building footprints from satellite data employing visual analysis techniques (manual digitization)-Semi Automatic Method: Building footprint extraction source is IKONOS high resolution (2.5m) georeferenced image.To digitize the footprints the database file with proper database behavior added in the software by using data management tools in Arc CATLOG. In this study Arc Map tools are used for editing, analyzing, and creating maps from the data for acquiring editing the geodatabase.The building footprints are manually extracted by visualizing the
image. The digitizing process of a building’s structure to
make footprint in order to create three-dimension building
model would mainly examine the edges of the building’s
roof which could be seen from IKONOS image.
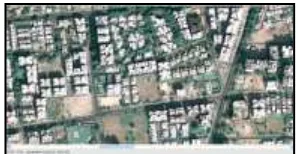
5.2 IKONOS Image:
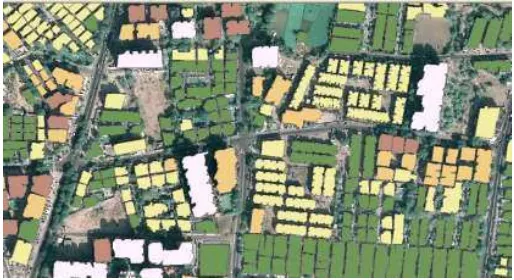
Figure 7. IKONOS high resolution image
5.3 Footprints of buildings:
5.4 Enlarged Footprints of buildings:
Figure 9. Footprints generated by digitizing
6. AUTOMATIC METHOD FOR OBJECT EXTRACTION
6.1 Flow chart:
Chart 3. Process chain
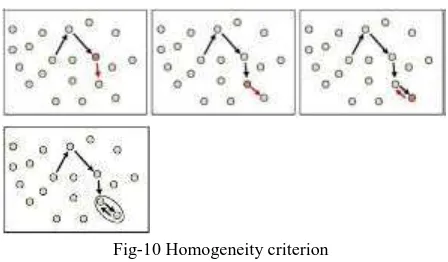
6.2 Footprints extraction: Acquired IKONOS high resolution satellite imagery for the required area. Satellite imagery correction is done by Arc GIS software. Visual inspection and interpretation of the buildings is done by eCognition Developer software. Segmentation algorithms are used to subdivide entire images at a pixel level, or specific image objects from other domains into smaller image objects. The method of the process is selected for Multi resolution Segmentation or Classification. To define a process using this algorithm as a parent process, one can choose the Insert Child command. The Multi resolution Segmentation algorithm consecutively merges pixels or existing image objects. Essentially, the procedure identifies single image objects of one pixel in size and merges them with their neighbors, based on relative homogeneity criteria. This homogeneity criterion is a combination of spectral and shape criteria.
6.3 Homogeneity criterion:
Fig-10 Homogeneity criterion
6.4 Multiresolution concept:
Figure 11. Multiresolution concept flow diagram One can influence this calculation by modifying the scale parameter. Higher values for the scale parameter result in larger image objects, smaller values in smaller image objects. The compactness criterion is used to optimize image objects with regard to compactness.
6.5 Assigning Class Algorithm and Class description: To assign classes to the image for object identification one has to choose Class Hierarchy task. Each class should be created with different color for the identification. One can classify objects in sub classes also. Byapplying algorithms for the different classes with mean value of the image layers one can extract footprints by correcting the values of the different classes.
By merging same class polygons one can correct the polygons for acquiring accurate boundaries of the footprint.
Figure 12. Class Hierarchy
6.6 Layer value:
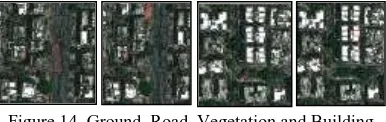
Figure 14. Ground, Road, Vegetation and Building (Mean value)
6.7 Developing rule sets: For developing rule sets object features are calculated by evaluating image objects themselves as well as their embedding in the image object hierarchy.
Layer value features utilize information derived from the spectral properties of image objects. Image objects have spectral, shape, and hierarchical characteristics and these features are used as sources of information to define the inclusion-or-exclusion parameters used to classify image objects.
The most common single layers are the red, green and blue (RGB) layers that go together to create a color image. Mean calculates the mean value of selected features of an image object and its neighbors. Algorithm applied for all classes are as below.
6.8 Algorithm applied for all classes:
Figure 15. Threshold condition
Figure 16. Ground and Roads
Figure 17. Vegetation and Building
6.9 Merging polygons:
Figure 18. Same class polygons
Figure 19. Corrected footprints
6.10 Exported building footprints:
Figure 20: Footprints (Automatic Method)
7. BARE EARTH MODEL EXTRACTION
7.1 Bare Earth: To extract Bare Earth Model the building footprints and Point file are clipped using Arc GIS software package. The selected building footprints areas are eliminated from the point file to create bare earth model. Point file converted in raster format through Arc Scene using
“point to raster” tool. Then applied “Raster interpolation”
tool from Arc Scene and interpolated the AOI clusters. This process converts Greed file into img file. Thus we can generate Bare Earth Model also.
Figure 22. Point File with erased Building footprints
Figure 23. Eliminated areas (TIN)
Figure 24. Bare Earth Model of AOI
8. GENERATION OF 3D CITY MODEL
8.1 Generating 3d city models by using footprints(Semi-Automatic method) and the associated heights of the buildings from DEM: Arc Scene software is used to generate 3D model. By using ‘extrusion tool’ and assigning”
mean value” of the height to the layer, 3D buildings are
generated. To correct the height of the building we have to calculate layer exaggeration of the scene value. Applying this method one can extract 3D form of the object. Point file is used as the source to assign building heights using eCognition software.
Figure 25. 3D model with mean value
Figure 26. 3D city model applying on Arc Globe (Semi automatic method)
8.2 Generating 3d city model by using footprints (Automatic method) and the associated heights of the buildings from DEM: The same process is applied for this method also. Point file is used as the source to assign building heights using eCognition software.
Figure 27. Footprints (Automatic Method)
9 ANALYSES
Figure 28. Footprint generation by Automatic method
Figure 29. Footprint generation by Semi Automatic method
Figure 30. Comparison between Automatic and Semi Automatic footprint generation
9.2 Comparisons between 3D Models
Figure 31 & 32. Comparison between 3D Models
3. Comparison between two methods:
TASK FOOTPRINTS S/W HEIGH
T
Semi automatic method: Foot prints are extracted manually in this method. Digitizing process is taking a long time. Software used is EDAS, LPS, Arc GIS and iGIS. Source to generate DEM and 3D city model is point file. We cannot digitize each shape of the object very properly so we can get less accuracy than automatic method.
Automatic method: Foot prints are extracted automatically with eCognition S/W. Other Software used is EDAS, LPS, Arc GIS and iGIS. Source to generate DEM and 3D city model is point file. Merging process is taking a very long time. Accuracy is more than automatic method. For large spatial area eCognition S/W is difficult. To extract footprints from eCognition S/W we need image with very high resolution.
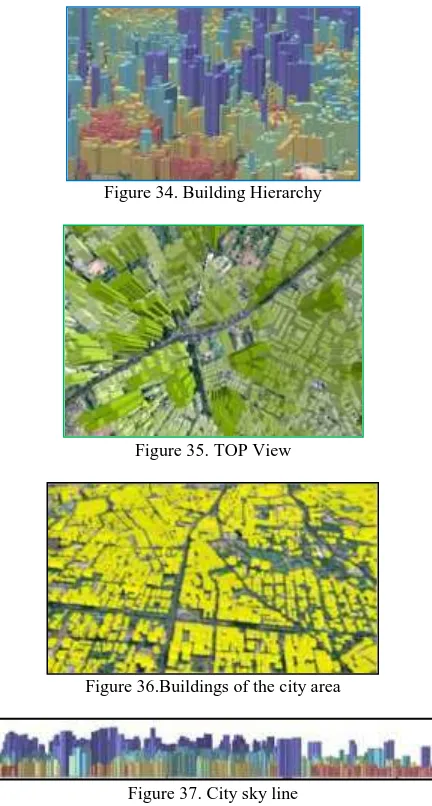
Figure 34. Building Hierarchy
Figure 35. TOP View
Figure 36.Buildings of the city area
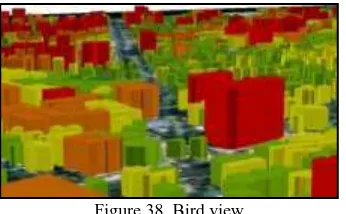
Figure 38. Bird view
However, challenges are still existed. This includes the acquisition of accurate and reliable spatial data, which requires high knowledge and techniques.
Also, the working processes are complicated and take times to develop the database. This work needs tools that are effective enough to complete the processes.
Conclusion:
i. With these methods one can extract 3D models for any city.
ii. All though there is possibility for enhancing many techniques for different applications and one can extract 3D model for further levels also.
iii. Today, software technology of Geo-informatics and 3D modeling can be working together. iv. A working integration of three-dimensional models
with geo-referenced database holds great promise for large scale spatial study.
v. ERDAS LPS, is developed uncomplicated for the users and, also, less expensive.
vi. When combining spectral and elevation data, significant elevation information for the objects in question and their spectral properties can be used to outline their shape and to classify them adequately with Definiens eCognition.
vii. eCognition’s intelligent feature extraction capabilities accelerate mapping, change detection and object recognition—delivering standardized and reproducible image analysis results.
viii. Using high resolution remote sensing data such as IKONOS data makes it possible in principle to detect man-made features such as buildings and roads.
REFERENCES
i. A. Gruen, Institute of Geodesy and Photogrammetry, ETH Zurich, Switzerland. ii. Benoit Fredericque, Product Manager 3D City GIS
Products
iii. ETH Zurich Hoenggerberg, CH-8093 Zurich, Switzerland.
iv. German Aerospace Center (DLR), Remote Sensing Technology Institute, D-82234 Wessling, Germany.
v. Institute for Photogrammetry, UniÍersity of Stuttgart Geschwister-Scholl-Strasse 24, D-70174 Stuttgart, Germany.
vi. Mohammed Abdul Khader Nayati, University of GAVLE, Dept. of Geomatics.
vii. Remote sensing Application institute of Aerophotogrammtry & Remote Sensing of China Coal, Xi.an, China.