COMPARISON OF BIOCLIMATIC, NDVI AND ELEVATION VARIABLES IN ASSESSING EXTENT OF COMMIPHORA WIGHTII (ARNT.) BHAND.
Kulloli R. Na., Suresh Kumara*
Central Arid Zone Research Institute, (CAZRI) Jodhpur-342003, India ([email protected], [email protected])
KEYWORDS: Bioclimatic variables, Commiphora wightii, Elevation, IUCN, MaxEnt, NDVI
ABSTRACT:
Commiphora wightii (Arnt.) Bhand., is an important medicinal plant of Indian Medicine System (IMS) since ancient time. It is used in different ailments of obesity, arthritis, rheumatism and high cholesterol. Due to overexploitation its natural populations declined to large extent. IUCN has put it under Data Deficient (DD) category due to lack of data on its extent of occurrence in nature. Hence, the study was carried out using MaxEnt distribution modelling algorithm to estimate its geographic distribution and to identify potential habitats for its reintroduction. For modelling employed 68 presence locality data, 19 bioclimatic variables, Normalize Difference Vegetation Index (NDVI) and elevation data. These were tested for multicollinearity and those variables having r-value less than 0.8 were selected for further analysis, which was carried out in two ways i) Bioclimatic variables and elevation; ii) NDVI and elevation. Area Under the Curve (AUC) in both analysis was above 0.9 for all variables, indicating very high accuracy of prediction. Variables governing distribution of C. wightii in the analysis usingbioclimatic and elevation data setare precipitation seasonality (56.6%),annual precipitation (16.4%) and elevation (14.7%). Extent of occurrence of C.wightii predictedby model closely matched in the districts of Jaisalmer and Barmer. In the second analysis elevation (48.3%), NDVI of June (11.1%) and August (11.2%) contributed for NDVI and Elevation data set. NDVI of June corresponds to its leafing phase while NDVI of August to flowering phase. Area of its occurrence predicted for NDVI and elevation data set are Bikaner, Churu, Jhunjhunun some part of Jodhpur which are completely sandy, where C. wightii is totally absent. Extent of occurrence was also validated in ground survey. Potential areas for its reintroduction were identified as Jaisalmer and Barmer districts in Indian arid zone.
*Corresponding author - Dr. Suresh Kumar
Head & Principal Scientist, Division of Integrated Land Use Management and Farming System Central Arid Zone Research Institute, Jodhpur-342003, India
Email- [email protected] Mob. No- 09414130030
1. INTRODUCTION
Habitat fragmentation, over exploitation, climate change and human activities are responsible for biodiversity degradation. Consequently, some 20% of plant species are now close to disappearance from planet earth (Brummitt & Bachman, 2010). In order to conserve these species understanding patterns of occurrence of these species is a prerequisite to prioritize habitats for reintroduction (Margules & Pressey, 2000). One of the most effective ways to know habitat suitability for reintroduction is to model existing habitats of occurrence so as to know areas of abundance, scarcity and absence. This enables conservation planning for rescue and recovery of threatened species with assured success under the challenging situations of degradation and climate change. (Gogol-Prokurat, 2011; Barik & Adhikari, 2011). Different environmental factors affecting species distribution are assessed by using Ecological Niche Modeling (ENM) (Guisan & Zimmermann, 2000; Elith et al., 2006, Adhikari et al., 2012). Ecological Niche is defined as a
produce offsprings (Grinnell, 1917). Modelling of these ecological conditions takes into account temperature, precipitation, soil, vegetation and land cover; much of it from Geographic Information System (GIS) databases (www.worldclim.org and www.diva-gis.org.). High resolution satellite imageries coupled with environmental variables and spatial datasets on climate and vegetation enhance models accuracy (Philips et al., 2006). Since ENM predicts occurrence of a species, it can be inter-alia used to extrapolate species distribution across landscape in time and space. Species distribution maps prepared using ENM have, therefore high level of statistical confidence and help to succinctly locate suitable areas for reintroduction of threatened species (Irfan-Ullah et al., 2006, Kumar & Stohlgren, 2009; Ray et al., 2011; Adhikari et al., 2012). But data on species distribution in many regions is not available and collecting such data involves huge cost and labor (Ottaviani et al., 2004). Predictive modeling of
evolution, ecology, conservation, and invasive-species management (Peterson & Robins, 2003; Araujo et al., 2004).
These predictive models combine many GIS tools to generate maps of areas where the habitats are most similar to those where the species is actually found. Amongst the different models, generalized linear model (GLM) (Guisan et al., 2000), ecological niche factor analysis (ENFA) (Santos et al., 2006), genetic algorithm for rule-set production (GARP) (Sweeney et al., 2007). MaxEnt (maximum entropy algorithm modeling program) have been widely used in recent studies (Elith et al., 2006), in view of their useful predictions. Hence, in order to know trends in distribution of C. wightii and selecting areas and habitats for its reintroduction amongst large variety of agroclimates in Indian Arid Zone, ecological niche modeling to assess distribution of C. wightii in arid regions of India assumed importance and priority in view of its unconfirmed threat status. We describe below results of this investigation.
2. Materials and Methods
2.1 Study species and occurrence data
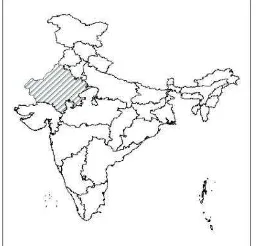
Commiphora wightii (Arn.) Bhandari, the ‘guggal,’ of the family Burseraceae, is a small shrub, characterized by a thick main stem with crooked knotty branches. It occurs in arid tracts of Rajasthan (Fig1). It has been categorized as threatened but International Union for Conservation of Nature (IUCN) has put it under data deficient (DD) category. Consequently, placing it
in ‘Data Deficient’ category of IUCN requires detailed
information on its spatial distribution and other related aspects. Species occurrence records were collected from previously published research papers, floras, herbarium records and during field work. During course of field work, it was observed that it occurs in low rainfall area i.e. mostly in arid area.
Figure 1. Study area for potential habitats of C. wightii.
2.2 MaxEnt model
MaxEnt, a general purpose model was employed as it assesses environmental layers based on the training data location and then selects the probability of occurrence of species in the whole study area (Buehler & Ungar, 2001). It is based on maximum entropy algorithm and can be downloaded from the website: http://www.cs.princeton.edu/~schapire/maxent/ (Phillips et al., 2006)
2.3 Environmental variables
Three types of environmental variables viz. bioclimatic variables, NDVI and elevation were used in this study (Table 1). Nineteen bioclimatic variables (Hijmans et al., 2005) with 1 km resolution, were downloaded from World climate website (http://www.worldclim.org.). This has a set of climate layers representing bioclimatic variables, derived from monthly temperatures and rainfall recorded worldwide (Graham & Hijmans, 2006). The multicollinearity test was conducted by using Pearson Correlation Coefficient to examine the cross-correlation and variables with cross- cross-correlation coefficient value of over 0.8 were excluded. Elevation (Digital Elevation Model-DEM) data were also obtained from the WorldClim website. The normalized difference vegetation index (NDVI) was used in the model as a measure of the amount of healthy green vegetation on the ground. NDVI was derived from SPOT vegetation sensor data. The NDVI data were processed to create 12 monthly mean composite NDVI images. All these variables are taken from mean value over 10 years from 2003 to 2013. The prediction year was 2013.
2.4 Modeling Procedure
Sr. No.
Code Variable Unit Sr.
No.
Code Variable Unit
1 Bio_1 Annual Mean Temp. 0C 17 Bio _17 Precipitation of Driest Quarter mm 2 Bio _2 Mean Diurnal Range 0C 18 Bio _18 Precipitation of Warmest Quarter mm 3 Bio _3 Isothermality (Bio2/Bio7)*100 - 19 Bio _19 Precipitation of Coldest Quarter mm 4 Bio _4 Temp. Seasonality (Std.
deviation*100)
- 20 Eu_1 NDVI January -
5 Bio _5 Max Temp. of Warmest Month 0C 21 Eu_2 NDVI February -
6 Bio _6 Min Temp. of Warmest Month 0C 22 Eu_3 NDVI March -
7 Bio _8 Mean Temp. of Wettest Quarter 0C 23 Eu_4 NDVI April -
8 Bio _7 Temp. Annual Range (Bio5-Bio6) 0C 24 Eu_5 NDVI May -
9 Bio _9 Mean Temp. of Driest Quarter 0C 25 Eu_6 NDVI June -
10 Bio _10 Mean Temp. of Warmest Quarter 0C 26 Eu_7 NDVI July -
11 Bio _11 Mean Temp. of Coldest Quarter 0C 27 Eu_8 NDVI August -
12 Bio _12 Annual Precipitation mm 28 Eu_9 NDVI September -
13 Bio _13 Precipitation of Wettest Month mm 29 Eu_10 NDVI October - 14 Bio _14 Precipitation of Driest Month mm 30 Eu_11 NDVI November - 15 Bio _15 Precipitation Seasonality (Coefficient
of variation)
- 31 Eu_12 NDVI December -
16 Bio _16 Precipitation of Wettest Quarter mm 32 h_DEM Elevation m Table 1. List of NDVI, bioclimatic variables and elevation used in the model (Hijmans et al., 2005).
3. RESULTS AND DISCUSSION
3.1 MaxEnt Modeling Analysis
Of the 68 C. wightii record points51 points were used to build the model (training points) and 17 points to test the model. Predicted potential habitats of C. wightii are shown in figs 2 and 3. MaxEnt’s statistical evaluation of the model indicated that the model provided useful prediction. The AUC was above 0.9 for all variables indicating very high accuracy (Swets,
1988; Manel et al., 2001). The model that included all variables had the highest AUC. Relatively high AUC values (>0.8) for the testing points, were another indication of the predictive power of the model. Finally, MaxEnt tests the null hypothesis that the test points are predicting no better than a random prediction using various thresholds (Phillips et al., 2006). Further the MaxEnt model also allows for performing an internal jack-knife test to quantify the importance of the variables in influencing the distribution of C. wightii (Figs 4 and 5).
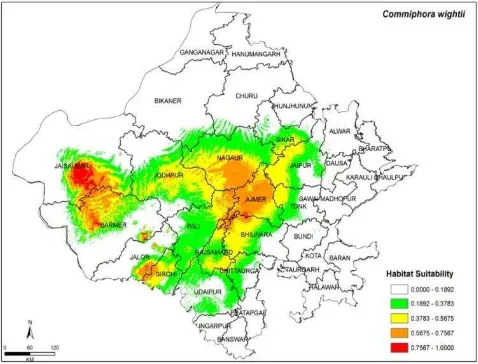
Figure 3. Predicted potential distribution of C. wightii for NDVI and elevation dataset.
Figure 4. Jackknife test results for Bioclimatic variables and Elevation dataset.
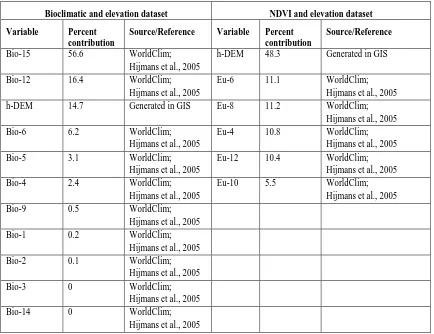
3.2 Contribution of the variables to the model
Variables which mostly contributed to the model are precipitation seasonality (coefficient of variation), precipitation of coldest quarter, elevation with 46.6%, 15.7% and 14.8% respectively for bioclimatic and elevation data set (Table 2). For NDVI and elevation dataset, elevation contributed 48.3% giving maximum gain, NDVI June (eu6_1_eur) and NDVI August (eu8_1_eur) contributing 11.1% and 11.2% respectively (Table 2). NDVI June is
contributing more because new leaves emerge in June and flowers during August in C.wightii.
Based on above data coldest quarter with no precipitation receiving sites are the most favored areas for reintroduction of C. wightii. The habitats of C.wightii can withstand extreme variability in seasonal precipitation which is so common in arid parts of Rajasthan. Variability in seasonal rainfall in different districts of Rajasthan revealed that such districts are Jaisalmer and Barmer harbouring its habitats. These are also the areas having coldest quarter with no precipitation to enhance success in reintroduction of C. wightii.
Bioclimatic and elevation dataset NDVI and elevation dataset
Variable Percent
Table 2. Relative contribution of variables to the MaxEnt Model for different datasets.
3.3 Variables Performance and Ground Truthing
The predicted distribution naturally included most of the Aravallis hill ranges having rainfall up to 550 mm. Results of MaxEnt model using Bioclimatic variables and Elevation dataset are similarto what has been found in larger areas in the districts of Jaisalmer and Barmer, partially in Ajmer, Jalore, Sirohi, Nagaur and Pali (Fig.2). These results revealed that elevation is a major factor in determining the distribution of potential habitats of C. wightii in Rajasthan. Accordingly highly suitable habitats of C. wightii are reported up to ≈ 500 m elevations indicating that it is narrowly endemic
of complex environmental factors that determine the potential habitats of C. wightii but, potential areas predicted is mismatching. Predicted area was totally sandy which are not the habitats of C. wightii. This NDVI database has cumulative data of ten years and thus is a better option for landscape level modeling and prediction. Aim here was not to detect individual C. wightii plant for which field based hyperspectral data with resolution in terms of 50cm would be more suitable. The aim here was to use such variables which could model and predict likely zones for reintroduction of this species. And for this purpose, bioclimatic parameters and elevation are most preferred. Other variables like precipitation seasonality (bio_15) and precipitation of coldest quarter (bio_19) also have considerable predictive value with regard to distribution of C. wightii.
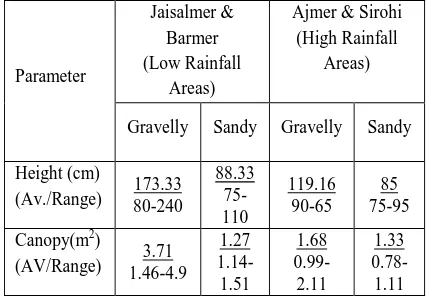
Ground truthing revealed that across all districts in western Rajasthan at gravelly soils of hills under both protected and unprotected conditions density of C. wightii wasmore than that in sandy soils of plains in all situations. This validates the modeling results that predicted its occurrence on mid elevation zone of upto 500m above mean sea level. Interestingly, low rainfall receiving districts i.e. Jaisalmer and Barmer (250 mm) had its higher density (10-12 plants per tenth ha) than those districts receiving more rain districts are highly correspondent with an actual occurrence in the study area.
Gravelly Sandy Gravelly Sandy Height (cm) Table 3. Ecological parameters of C. wightii in protected areas in low and high rainfall districts of Rajasthan.
Conclusion
We concluded from above study that
1. MaxEnt modeling based on bioclimatic variables and elevation together effectively determined habitat distribution and predicted habitats for reintroduction of C. wightii. NDVI has not given satisfactory results.
2. C. wightii preferentially occurs in mid elevational
altitude ≈ 500 m.
3. C.wightii distribution prediction closely matched in the districts of Jaisalmer and Barmer; making them potential area of reintroduction.
4. Seasonal factors substantially contribute to its distribution. Hence, while planning its
conservation/production areas, matching season for its optimum growth will result in sustainable plantations.
Acknowledgments
We are grateful to Director, CAZRI for providing necessary facilities for this work. The authors thank National Medicinal Plant Board, Govt. of India, New Delhi for financial support. Also we would like to thank Prof. S. K. Barik and Dr. Dibyendu Adhikari for necessary guidance in carrying out Ecological Niche Modelling.
References
Adhikari, D., Barik, S.K., Upadhaya, K. 2012. Habitat distribution modelling for reintroduction of Ilex khasiana Purk., a critically endangered tree species of northeastern India. Ecological Engineering40: 37-43.
Araujo, M.B., Cabeza, M., Thuiller, W., Hannah, L., Williams, P.H. 2004. Would climate change drive species out of reserves? An assessment of existing reserve- selection methods. Global Change Biology10: 1618–1626.
Barik, S.K., Adhikari, D. 2011 Predicting geographic distribution of an invasive species Chromolaena odorata L (King) & H. E. Robins in Indian subcontinent under climate change scenarios. In: Bhatt JR, Singh JS, Tripathi RS, Singh SP, Kohli RK. (Eds.), Invasive Alien Plants- An Ecological Appraisal for the Indian Subcontinent. CABI, Oxfordshire, UK.
Giriraj, A., Irfan-Ullah, M., Ramesh, B.R., Karunakaran, P.V., Jentsch, A., Murthy, M.S.R. 2008. Mapping the potential distribution of Rhododendron arboretum Sm. Ssp. nilgiricum (zenker) Tagg (Ericaceae), an endemic plant using ecological niche modelling. Current Science 94 (12): 1605-1612
Gogol-Prokurat, M. 2011. Predicting habitat suitability for rare plants at local spatial scales using a species distribution model. Ecological Application 21: 33–47.
Guisan, A., Zimmermann, N.E. 2000. Predictive habitat distribution models in ecology. Ecological Modelling 135: 147– 186.
Irfan-Ullah, M., Amarnath, G., Murthy, M.S.R., Peterson, A.T. 2006. Mapping the geographic distribution of Aglaia bourdillonii Gamble (Meliaceae), an endemic and threatened plant, using ecological niche modeling. Biodiversity Conservation 16: 1917-1925.
IUCN 2011. IUCN Red List of Threatened species. Version 2011.1.\www.iucnredlist.org
Kumar, S., Stohlgren, T.J. 2009. Maxent modelling for predicting suitable habitat for threatened and endangered tree Canacomyrica monticola in New Caledonia. Journal of Ecology and Natural Environment 1: 094–098.
Margules, C.R., Pressey, R.L. 2000. Systematic conservation planning. Nature 405: 243–253.
Ottaviani, D., Lasinio, G.J., Boitani, L. 2004. Two statistical methods to validate habitat suitability models using presence only data. Ecological Modelling 179: 417–443.
Pearson, R.G. 2007. Species distribution modelling for conservation educators and practitioners. Synthesis. American Museum of Natural History. http://ncep.amnh.org Phillips, S.J., Anderson, R.P., Schapire, R.E. 2006. Maximum entropy modeling of species geographic distributions. Ecological Modeling 190: 231-259.
Ray, R., Gururaja, K.V., Ramachandra, T.V. 2011. Predictive distribution modeling for rare Himalayan medicinal plant Berberis aristata DC. Journal of Environment and Biology 32: 725–730.
Santos, X., Brito, J.C., Sillero, N., Pleguezuelos, J.M., Llorente, G.A., Fahd, S., Parellada, X. 2006. Inferring habitat-suitability areas with ecological modelling techniques and GIS: a contribution to assess the conservation status of
–
Soleimani, K., Kordsavadkooh, T., Muosavi, S.R. 2008. The effect of environmental factors on vegetation changes using GIS (Case Study: Cherat Catchment, Iran). World Applied Science Journal 3: 95–100.